http://www.sciencepublishinggroup.com/j/jfns doi: 10.11648/j.jfns.20180602.11
ISSN: 2330-7285 (Print); ISSN: 2330-7293 (Online)
Development and Validation of a B.
E.
A.
N. Survey for
College Students
Morgan F. Sowers
1, Sarah E. Colby
1, *, Chelsea L. Allison
1, Wenjun Zhou
21
Department of Nutrition, University of Tennessee, Knoxville, United States of America
2Department of Business Analytics and Statistics, University of Tennessee, Knoxville, United States of America
Email address:
*
Corresponding author
To cite this article:
Morgan F. Sowers, Sarah E. Colby, Chelsea L. Allison, Wenjun Zhou. Development and Validation of a B. E. A. N. Survey for College
Students. Journal of Food and Nutrition Sciences. Vol. 6, No. 2, 2018, pp. 37-45. doi: 10.11648/j.jfns.20180602.11
Received: December 18, 2017; Accepted: January 17, 2018; Published: February 5, 2018
Abstract: Background: College students often do not consume the recommended amounts of beans and legumes. To develop
interventions aimed at improving the intake of beans and legumes in the college population, more information is needed on the behaviors, environment, attitudes, and nutrition knowledge (B. E. A. N.) of college students regarding beans. Validated tools to assess these bean-related constructs are currently lacking. Objectives: The objectives of this study are to 1). Gather preliminary qualitative information about bean-related constructs (Phase I); and 2). Create a valid and reliable survey tool to measure the B. E. A. N. constructs with a larger sample of college students (Phase II). Methods: Phase I included cognitive interviews with university students (n = 30) to collect baseline data on the B. E. A. N. constructs. Phase II involved survey development and content validation with 5 content experts and face validation with 5 undergraduate students. A convenience sample of undergraduate students was surveyed to test internal structure and consistency (n = 355), establish convergent and discriminantevidence (n = 351), and measure test-retest reliability (n = 242) of the developed tool. Results: Development and revisions in
Phase I and content and face validation resulted in a 13-question survey consisting of four primary constructs of behavior (4 items), environment (2 items), attitudes (5 items), and nutrition knowledge (2 items). In Phase II, factor analysis resulted in one factor of “bean consumption” being created from combining attitude and behavior questions, with factor loadings from .77 to .94. However, two environment and two knowledge questions were retained due to perceived relevancy. The internal consistency was α = 0.97 for the “bean consumption” construct (8 items) and α = 0.96 for the entire survey (12 items). The knowledge construct was validated by those that had taken an introductory nutrition course having significantly higher mean knowledge scores than those that had not taken an introductory nutrition course (p < 0.001; 3.05 ±.89 vs. 2.30 ± 1.62,
respectively). The test-retest results ranged from r =.480 to .825 with all correlations being statistically significant (p < 0.01).
The average total score for the pilot testing was 33.7 (± 27) out of a possible 100 points. Conclusion: This validated survey may be used in future research to examine the B. E. A. N. of college students regarding beans. This knowledge may be valuable in developing future effective health promotion interventions with college students.
Keywords: Bean Intake, College Students, Survey Development
1. Introduction
College-age students experience many lifestyle changes, including autonomy with lifestyle choices, [1] which often results in negative changes in dietary behavior. [2] This population, on average, consumes excess amounts of calories, fat, and sodium, and deficient amounts of fiber,
among college students. [7] This unwanted weight gain, which commonly tracks into adulthood, [8] has been associated with development of preventable chronic diseases. [9] Interventions focused on improving nutrient intake and weight status of college-aged individuals would likely benefit from focusing on negative dietary behaviors common in this population. [10]
Though many interventions have focused on increasing intake of fruits and vegetables, vegetables not usually targeted include those in the bean and legume group. The nutritional benefits of beans make them an ideal target to improve the dietary quality of many college students. Consumption of ½ cups of beans per day has been associated with significantly higher intakes of fiber, protein, folate, zinc, iron, and magnesium as well as lower intakes of saturated fat and total fat (p < 0.05). [11] College students and other adults who consumed higher amounts of beans have been found to have smaller waist sizes, lower body mass indexes (BMI), and reduced risk of becoming obese compared to those who did not consume beans. [12, 13] However, reports indicate on average, college-aged students only consume 40 percent of the 3 cups per week recommended amount of beans and legumes. [12] Therefore, increasing the intake of beans among college students could improve their consumption of important nutrients and maintenance of a healthy weight status.
Before developing interventions to improve bean intake in a college population, it is important to understand potential influences of dietary behavioral intentions. The social cognitive theory (SCT) describes how an individual’s personal, behavioral, and environmental factors interact to influence their ideas and behaviors. [14] For example, personal factors such as in individuals’ ideas, beliefs, knowledge, or expectations can influence
how an individual responds or interacts with their environment as well as their likelihood to participate in a certain behavior. [14, 15] In addition, the campus environment has been shown to influence dietary choices and habits of college student by influencing the nutrition environment, which can then influence individuals’ attitudes and behavioral skills or intentions towards healthy eating. [16, 17]
However, the personal factors (knowledge and attitudes), behaviors, and environmental perceptions regarding beans among college students have not been established in the literature and validated tools to assess these constructs are lacking. As a first step toward long-term goals of developing, implementing and evaluating bean interventions to promote health on college campuses, the objective of this study was to create a valid and reliable survey that could be used to gather information regarding the behaviors, environment, attitudes and nutrition knowledge (B. E. A. N.) regarding beans with a college student population.
2. Methods
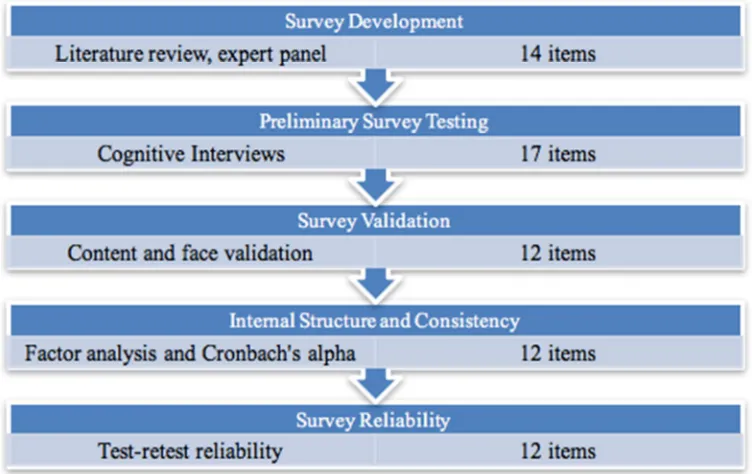
This study utilized a multi-phase, exploratory sequential mixed-methods approach to develop and test the B. E. A. N. survey.[18] In phase I, utilized preliminary interviews were utilized to inform development of the survey questions and scoring system. In phase II, validation of the survey was accomplished through conducting content and face validation as well as a pilot testing to measure internal consistency and test-retest reliability. Figure 1 illustrates the survey development process and the number of revised questions in each stage. The Institutional Review Board at the study university approved all study procedures prior to data collection.
This survey provides a unique, comprehensive, and valid approach to measuring a variety of concepts associated with bean consumption. The quantitative and descriptive measures included in this survey provide information that can be used to inform, develop, and evaluate interventions focused on improving college students’ dietary intake of beans.
2.1. Phase I: Survey Development
2.1.1. Question Development
In 2014, an expert panel of nutrition professionals developed an initial pool of 14 questions based on previous literature on the desired constructs and target population. These questions focused on students’ bean behavior, including frequency of consumption, favorite types, preferred form, pairings, and usual form of purchase; environmental factors regarding beans including perceived availability on campus and ideas for incorporation on campus; attitudes
regarding beans, including opinions, reasons for
consumption, and perceptions of other students opinions; and nutrition knowledge of beans, including types, associated food groups and health benefits.
2.1.2. Preliminary Interviews
In February 2015, a trained, undergraduate student researcher conducted 30 in-depth cognitive interviews with students at the study university over a 2-day period. A sample of 30 students (15 male and 15 female) was decided a priori to reach adequate saturation of response using grounded theory.[18] Data saturation was determined by repetition and lack of variation in responses.[18] If saturation was not reached after the 30 interviews, 30 additional interviews would be conducted until no new information was being added to responses. The inclusion criteria of this phase was to be a current student at the study university and at least 18 years of age. Students were to be recruited in the study university’s library and participation in the interviews was based on convenience. The 14 questions were asked in the same order for each interview and remained unchanged through the 30 interviews. Interviews were conducted and audio recorded at the study university’s library in a private room reserved for the researcher upon the student’s consent to participate in the study. The same student researcher transcribed the interviews verbatim and proceeded to code using open-ended thematic coding. Findings were used to preliminarily understand the college student’s behavior, environment, attitude, and nutrition knowledge about beans. These findings were used as guidance to develop the resulting survey by a nutrition professional and the student researcher.
2.2. Phase II: Survey Testing and Validation
2.2.1. Content Validation
A trained student researcher conducted cognitive interviews with 5 registered dietitian nutritionists (RDNs), with expertise working with college populations, to determine if the content was appropriate for the target
population and sufficient to meet overall objectives of the survey. Changes were made using an iterative process, with revisions made after each interview. Wording, implied meaning, possible interpretation, and potential answers choices and scoring for each question were also discussed. Questions considered confusing or irrelevant to the survey’s purpose were modified or removed.
2.2.2. Face Validation
A trained student researcher conducted cognitive interviews with 5 undergraduate students to test face validity. Participants provided their interpreted meaning and reasons for responses for each question. If a participants’ interpretation was not consistent with the intended meaning, the researcher used probing techniques to identify reasons for the discrepant interpretation. Participants also provided suggested wording improvements to perceived confusing
questions. Participants’ explanations were used to
continuously revise questions after each interview, as deemed necessary.
2.2.3. Internal Structure and Consistency
Internal structure and consistency was tested using a pilot test of the survey with a convenience sample of approximately 500 undergraduate students at the study university. A majority of students (96.9%) were recruited, using class announcements and e-mails, from an introductory nutrition course, with a smaller number (3.1%) recruited from a non-nutrition related class. The goal sample size was at least 10% of the sample size, or 50 participants, which is above the rule of having at least 30 participants. [18, 19] The survey was administered via an online link using Qualtrics software. Participants had 1 week to complete the survey and were compensated with extra points in their course.
2.2.4. Test-Retest Reliability
Participants who completed the pilot test survey were given the opportunity to take the survey again 10 days later for additional extra credit points. The time period chosen was adapted from the flexible recommendation for a test-retest time period of 2 to 4 weeks between tests. [21] A slightly shorter time period was chosen due to the time constraints associated with a majority of students being in the introductory nutrition course where they were expected to be learning about topics that might have potentially biased results within 2 weeks of the first test being administered. Results from the 2 time points were then statistically compared via Pearson's product moment correlations to determine if the tool produced consistent results. A acceptable level of 0.60 was used as the reference cut-off for the test-retest results. [19]
3. Results
3.1. Phase I: Survey Development
The 30 student participants from the preliminary interviews were mostly white (73.3%) and 20.7 years of age on average. Saturation of response was met after the 30 interviews. Common themes emerging for the 4 bean constructs included low consumption, perceived lack of availability on campus, positive attitudes, and low nutrition knowledge of types and food groups. An expert panel used these themes to develop a 17-question survey with the most frequently mentioned answers chosen as multiple-choice options. Questions categorized by construct included 5 behavior questions, 2 environment questions, 6 attitude questions, and 6 nutrition knowledge questions.
3.2. Phase II: Survey Testing and Validation
3.2.1. Content Validation
Cognitive interviews with the RDNs led to minor changes
in the survey. Questions were reworded to be more appropriate for the college student population and ensure balanced flow of the survey. Also, 5 attitude questions were changed from single or multiple-choice questions to a 5-point Likert scale. Survey flow was also changed allowing participants who reported they “never” or “rarely” consumed beans to skip questions regarding consumption and liking of different types of beans. An additional behavior question was also added for these participants to assess the reasoning for their lack of bean consumption. The question “beans are healthy” was deleted due to the vagueness of interpretation and disagreement on its fit within the attitudes or knowledge construct. Three knowledge questions were deleted because they measured knowledge of fiber requirements and content, not specific to beans. A question regarding knowledge of proper serving size of beans was also deleted due to the concept already being addressed by another question. One behavior question was deleted because it did not measure bean consumption, but rather bean purchasing. The resulting revised survey included 12 questions (3 behavior, 2 environment, 5 attitude, and 2 nutrition knowledge).
3.2.2. Face Validation
Minor changes were made to increase clarity and representation of intended constructs. Three questions with interpretations inconsistent with the intended meanings were reworded. In addition, per student suggestions, more options were added to some questions to reflect additional responses provided by the students. For example, “I do not know” was added as a choice for 2 questions with a Likert scale. All 12 survey questions were retained after this step.
3.2.3. Internal Structure and Consistency
The majority of student participants (n=355) were female (80%), white (89%), between 18 and 20 years of age (82%; M=19.6±1.32), and a freshman (39%) or sophomore (36%).
Table 1. Factor Analysis for the B. E. A. N. Survey.
Question Factor 1 Factor 2 Factor 3
Question 5. Rate on a scale how much you like beans. .940 -.051 -.025
Question 9. The reasons I eat beans are because of: OR Question 8. The reasons I rarely or do not eat beans are
because of: .924 .088 .107
Question 6. Please check the box which describes how much you like each type of bean. .899 .129 .156
Question 7. How often do you eat beans? .823 -.339 .072
Question 10. I usually eat beans: .811 .153 -.332
Question 11. When I eat beans, I usually consume: .800 -.133 -.150
Question 12. The main reason people might not eat beans are because of: .772 -.057 -.095
Question 3: I would like to see beans on campus .339 .283 .039
Question 4: Beans are found in the following food group (s): .239 .235 .039
Question 1: Which of the following is/are a bean or a legume? .160 .227 .171
Question 2: I think there are enough beans available on campus .033 -.105 .080
Eigenvalues 5.56 1.28 1.05
Variance 50.51% 11.59% 9.58%
Goodness-of-fit test (chi-square) 41.74 (p < 0.019)
*Note: Factor analysis conducted with results from a pilot test of the B. E. A. N. survey using a convenience sample of 355 college students from a large university in the southeastern U.S.
As shown in table 1, the factor analysis revealed only one factor had items that loaded with the minimum 0.70 criteria level. This factor, labeled “bean consumption,” included 3 behavior questions and 5 attitude questions. These 8 items had factor loadings ranging from .772 to .940. Eigenvalues after rotation matrix was 5.56 with 51% of the variance being explained by these questions. Two environmental availability questions and 2 nutrition knowledge questions that did not fit into the factor analysis were retained as part of the survey, to be analyzed separately, due to their perceived importance in measuring key constructs.
Totaling all scored questions provided a total survey score of -36 to 89. Each question scored was worth approximately 2 to 4 points to provide equal question weight. One exception was the 3 matrix questions, which had 8 to 9 options, each worth 1 point, for a total of 9 to 10 points per question. In addition, the question
regarding reasons why the students do not eat beans was reverse scored to accurately reflect negative bean attitudes. Only questions with scoring were used to calculate the internal consistency scores. The two excluded questions without scoring included the environmental question number 3 and attitude question number 12, described above, since both questions included non-scaled descriptive options. Internal consistency was α=0.965 for the bean consumption construct (8 items) and α=0.960 for the overall survey (12 items).
3.2.4. Test-Retest Reliability
A total of 242 students from the pilot test convenience sample completed the survey again the following week. The demographics were not significantly different from that of the larger sample. The results of the Pearson’s correlation can be found in table 2.
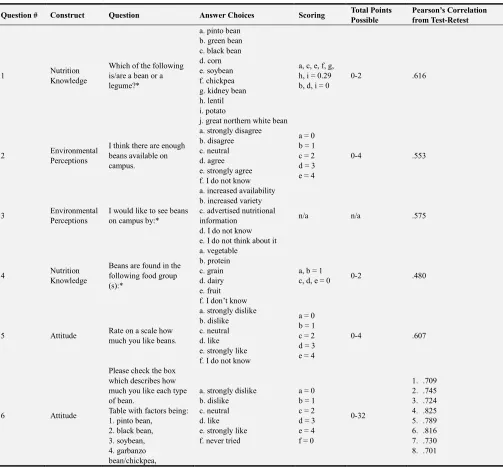
Table 2. Final B. E. A. N. Survey Questions and Scoring.
Question # Construct Question Answer Choices Scoring Total Points Possible
Pearson’s Correlation from Test-Retest
1 Nutrition
Knowledge
Which of the following is/are a bean or a legume?*
a. pinto bean b. green bean c. black bean d. corn e. soybean f. chickpea g. kidney bean h. lentil i. potato
j. great northern white bean
a, c, e, f, g, h, i = 0.29 b, d, i = 0
0-2 .616
2 Environmental
Perceptions
I think there are enough beans available on campus.
a. strongly disagree b. disagree c. neutral d. agree e. strongly agree f. I do not know
a = 0 b = 1 c = 2 d = 3 e = 4
0-4 .553
3 Environmental
Perceptions
I would like to see beans on campus by:*
a. increased availability b. increased variety c. advertised nutritional information
d. I do not know e. I do not think about it
n/a n/a .575
4 Nutrition
Knowledge
Beans are found in the following food group (s):* a. vegetable b. protein c. grain d. dairy e. fruit f. I don’t know
a, b = 1
c, d, e = 0 0-2 .480
5 Attitude Rate on a scale how
much you like beans.
a. strongly dislike b. dislike c. neutral d. like e. strongly like f. I do not know
a = 0 b = 1 c = 2 d = 3 e = 4
0-4 .607
6 Attitude
Please check the box which describes how much you like each type of bean.
Table with factors being: 1. pinto bean,
2. black bean, 3. soybean, 4. garbanzo bean/chickpea,
a. strongly dislike b. dislike c. neutral d. like e. strongly like f. never tried
a = 0 b = 1 c = 2 d = 3 e = 4 f = 0
Question # Construct Question Answer Choices Scoring Total Points Possible
Pearson’s Correlation from Test-Retest 5. kidney bean,
6. navy bean, 7. great northern white bean,
8. red bean
7 Behavior How often do you eat
beans?
a. I don’t eat beans b. rarely
c. 1 time last month d. 2-3 times last month e. 1 time / week f. 2 times / week g. 3-4 times / week h. 5-6 times / week i. 1 time / day j. 2 or more times / day
a, b = 0 c, d, e, f = 1 g, h, i, j = 2
0-2 .789
8a Attitude
The reasons I rarely or do not eat beans are because of:
Table with factors being: 1. taste
2. health 3. protein content 4. preparation 5. price 6. gas 7. texture 8. availability 9. other
a. low b. c. neutral d. e. high
a = 0 b = -1 c = -2 d = -3 e = -4
-36-0
1. .724 2. .774 3. .665 4. .810 5. .494 6. .749 7. .693 8. .751 9. .716
9b Attitude
The reasons I eat beans are because of: Table with factors being: 1. taste
2. health 3. protein content 4. preparation 5. price 6. gas 7. texture 8. availability 9. other
a. low b. c. neutral d. e. high
a = 0 b = 1 c = 2 d = 3 e = 4
0-36
1. .776 2. .649 3. .558 4. .577 5. .706 6. .638 7. .616 8. .524 9. .659
10b Behavior I usually eat beans:*
a. combined with other foods
b. boiled c. baked d. refried e. other
1 point each 0-5 .715
11b Behavior When I eat beans, I usually consume:
a. ½ cup b. 1 cup c. 1.5 cups d. 2 cups or greater
a = 1
b, c, d = 2 0-2 .648
12b Attitude
The main reason people might not eat beans are because of:
a. taste b. texture c. gas d. other
n/a n/a .515
a: Only answered by participants who answered a or b on question 7. b
: Only answered by participants who answered c, d, e, f, g, h, i, or j on question 7. * Multiple answer questions: “Choose all that apply”
Correlation coefficients ranged from .480 to .825, with all correlations being statistically significant at the p<0.01 level (2-tailed). After rounding, only two questions fell below the 0.60 cut-off, including question 4 regarding nutrition knowledge and question 12 regarding attitudes or reasons why people may not eat beans.
3.2.5. Overall Pilot Survey Results
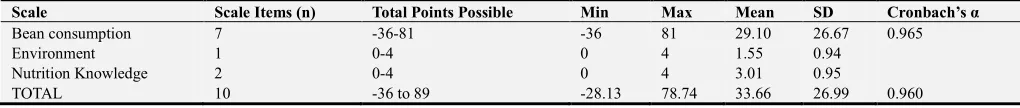
of a possible -36 to 81 points. The environment and nutrition knowledge scores were 1.55 (±0.94) and 3.01 (±0.95),
respectively, out of possible scores of 4 points.
Table 3. Scoring and Results of the B. E. A. N. Pilot Test with College Students (n = 355).
Scale Scale Items (n) Total Points Possible Min Max Mean SD Cronbach’s α
Bean consumption 7 -36-81 -36 81 29.10 26.67 0.965
Environment 1 0-4 0 4 1.55 0.94
Nutrition Knowledge 2 0-4 0 4 3.01 0.95
TOTAL 10 -36 to 89 -28.13 78.74 33.66 26.99 0.960
*Note: Pilot test was conducted with a convenience sample of 355 college students at a large university in the Southeastern United States.
The results of the pilot test were analyzed for descriptive data. The bean consumption results indicated 28% of participants never or rarely consumed beans, 28% consumed beans 1 to 3 times per month, and 39% consumed beans 1 to 2 times per week. However, only 4.5% of participants met the recommended dietary bean and legume intake of at least 3 cups per week, [10] with the average consumption being 0.75 (±1.06) cups per week. A majority of participants indicated they liked (57%) or strongly liked (20%) beans, with the types liked by a majority of participants including black (73%), pinto (60%), red (55%), and kidney (51%). The most important reasons for eating beans included taste (63%), health (60%), and protein content (57%) while the most common reasons for not eating beans included taste (55%) and texture (40%). The nutrition knowledge results indicated 36% of participants were able to correctly identify all of the bean items and 57% were able to correctly identify beans as being in the protein and vegetable food groups. Finally, 49% of students disagreed or strongly disagreed that there were enough beans on campus, with the most common suggestions for improvement being to increase the variety (55%) and availability (43%).
4. Discussion
This study developed a valid and reliable survey for assessing the behaviors, environment, attitudes, and nutrition knowledge of beans in a college population. This survey contributes to the current gap in literature specifically focusing on all aspects of bean consumption with the college population. Other surveys and screeners measuring bean consumption have commonly grouped beans and legumes with other vegetables when assessing intake, with many only including 1 or 2 questions inquiring about the frequency and amount of beans consumed. [22, 23] However, this survey uniquely addressed concepts of the SCT by also gathering information on the personal and environmental factors that may influence behavioral intention, including knowledge, attitudes, and environmental perceptions regarding bean consumption. [14]
The main construct revealed with this survey was related to bean consumption, which included measures of both behavior and attitudes regarding bean intake. This survey included the novel aspect of providing a quantitative score for bean consumption to complement the descriptive information provided, with higher scores indicating higher frequency, variety and amount of bean consumption as well
as more positive attitudes regarding their preferences and reasons for consumption.
The unique and specific nature of this survey focused on bean consumption in the college population. The lack of previously validated surveys in this area presented a challenge for comparison, making it difficult to ensure convergent validity. Furthermore, while reported bean consumption is important to assess, the limited evidence in actual bean consumption with this population, both in this and other studies, make it difficult to corroborate these findings to interpret them as actual bean intake. In addition, while bean consumption was an important area to study in the college population due to the lack of intake [12] and association with weight and health, [12, 13] the development of a survey specifically focused on a single food group and population may limit its wide-spread use. However, it could be argued that the lacking research on tools assessing the unique behaviors and attitudes of this population warrant the development of this and other specific, targeted surveys.
While this survey was designed for use in a general college student population in the United States, the lack of diversity in the sample used in the validation process may have presented additional limitations. This survey was only completed in a sample of students, who were primarily female and freshmen, from a university in the southeastern U.S. However, other studies have indicated that, while males consumed slightly more beans than females, these differences were not significant. [11] In addition, studies have indicated bean intake as well as attitudes and perception of healthy foods varies by race, ethnicity, or culture. [11, 24] Finally, the convenience sample consisted largely of individuals who were enrolled in a nutrition course, which could have introduced sampling bias. Further research should test this survey in other universities around the U.S., with a variety of different students, to confirm the validity and reliability among the entire target population of college students.
A strength of this study that could have improved generalizability of the survey was the use of a multi-phase, exploratory sequential mixed methods approach. [18] Gathering qualitative data prior to survey development allowed tailoring and revision of the resulting quantitative survey to capture the rich ideas expressed in the open-ended interviews. [18] Consistent results between the cognitive interviews and pilot test also provided reliability to the findings. [18]
First, to alleviate the potential limitation of lack of existing surveys for comparison, future studies can use techniques used in previous survey development papers in this population of testing concurrent-criterion validity with in-depth interviews where students’ answers to verbal interviews and survey questions are statistically compared. [25] Future research should also test the reported intake that can be gathered with the survey to actual intake within the same college student population to strengthen the concurrent-criterion validity of the bean intake measures. In addition, due to the limited, homogeneous sample, the survey should be tested with a broader, more diverse subset of the population to confirm the reliability and validity results, as well as appropriateness with other populations, before fully implementing the survey.
The information gathered with these validated questions can be used to better frame bean-related interventions targeting college students. The quantitative scores can be used as a baseline measure to improve upon with interventions focused on beans. Exploring students’ individual answers on the attitudes, knowledge, and environmental perceptions items can help to determine potential facilitators or barriers to bean consumption that can be used as a focus for interventions. Addressing the barriers and facilitators to a particular dietary behavior aligns with the principles of the SCT, in that individuals’ behavior will not change if the surrounding environment does not provide support for desired behaviors. [14]
Additionally, despite college students’ inadequate bean consumption demonstrated in this and other studies, [10, 12] there is little research on interventions focused specifically on improving individuals’ intake of beans and legumes. Therefore, this survey also contributes to research by providing a tool for collection of formative research to inform the development and measurement of success of future interventions to improve bean consumption. Particularly, when designing interventions regarding beans in the future, each measured construct of behavior, environmental perceptions, attitudes, and nutrition knowledge should be considered and included to maximize effectiveness in the college population. While this bean consumption survey was specifically developed for college students, future research could adapt and test this survey for use in a variety of populations.
5. Conclusion
This study presents the development and validation of a unique 12-question survey focused on assessment of the behaviors, environment, attitudes, and nutrition knowledge of beans in a college population. The main construct revealed with this development and validation is the concept of bean consumption, which assesses both behavior and attitudes of college students regarding beans. In addition, by including both quantitative scores and descriptive measures for the main constructs in this short, standardized survey, more detailed information on the concepts can be gathered easily and conveniently. The aim is that this validated survey can be
applied in future research with the college population to examine the concepts presented. The results of the survey may then be valuable in developing future effective health promotion interventions with college students. Future research should build upon these results to strengthen the validity and generalizability of the findings and extend its use to additional populations and settings.
Acknowledgements
This material is based upon work that is supported by the National Institute of Food and Agriculture, U.S. Department of Agriculture, under award number 2014-67001-21851.
References
[1] Arnett, J. J., Emerging adulthood. A theory of development from the late teens through the twenties. Am Psychol., 2000. 55 (5): p. 469-80.
[2] Vella-Zarb, R. A. and F. J. Elgar, The ‘Freshman 5: A meta-analysis of weight gain in the freshman year of college. J Am Coll Health., 2009. 58 (2): p. 161-166.
[3] Krebs-Smith, S. M., et al., Americans do not meet federal dietary recommendations. J Nutr, 2010. 140 (10): p. 1832-8.
[4] Laska, M. N., et al., The differential prevalence of obesity and related behaviors in two- vs. four-year colleges. Obesity (Silver Spring), 2011. 19 (2): p. 453-6.
[5] Deforche, B., et al., Changes in weight, physical activity, sedentary behaviour and dietary intake during the transition to higher education: a prospective study. Int J Behav Nutr Phy., 2015. 12 (1): p. 1-10.
[6] American College Health Association, American College Health Association - National College Health Assessment II: Undergraduate Student Reference Group Executive Summary Spring 2015.. 2015, American College Health Association: Hanover, MD.
[7] Pliner, P. and T. Saunders, Vulnerability to freshman weight gain as a function of dietary restraint and residence. Physiol and Behav., 2008. 93 (1-2): p. 76-82.
[8] Holm-Denoma, J. M., et al., The "freshman fifteen" (the "freshman five" actually): Predictors and possible explanations. Health Psychol., 2008. 27 (1 Suppl): p. S3-9.
[9] Center for Disease Control and Prevention. Adult Obesity Facts. 2015 [cited 2015 October 2, 2015]; Available from: http://www.cdc.gov/obesity/data/adult.html.
[10] U.S. Department of Agriculture and U.S. Department of Health and Human Services, 2015-2020 Dietary Guidelines for Americans. 2015.
[11] Mitchell, D. C., et al., Consumption of dry beans, peas, and lentils could improve diet quality in the US population. J Am Diet Assoc, 2009. 109 (5): p. 909-13.
[13] Papanikolaou, Y. and V. L. Fulgoni, 3rd, Bean consumption is associated with greater nutrient intake, reduced systolic blood pressure, lower body weight, and a smaller waist circumference in adults: Results from the National Health and Nutrition Examination Survey 1999-2002. J Am Coll Nutr., 2008. 27 (5): p. 569-76.
[14] Bandura, A., Social Foundations of Thought and Action: A Social Cognitive Theory. 1986, Upper Saddle River, NJ: Prentice Hall.
[15] Bandura, A., Health promotion by social cognitive means. Health Educ Behav., 2004. 31 (2): p. 143-64.
[16] Sallis, J. F. and K. Glanz, The role of built environments in physical activity, eating, and obesity in childhood. Future Child., 2006. 16 (1): p. 89-108.
[17] Pelletier, J. E. and M. N. Laska, Campus food and beverage purchases are associated with indicators of diet quality in college students living off campus. Am J Health Promot., 2013. 28 (2): p. 80-87.
[18] Creswell, J. W., Research Design: Qualitative, Quantitative, and Mixed Methods Approaches.. 4th ed. 2013, Thousand Oaks, CA: Sage Publications.
[19] Gliner, J. A., G. A. Morgan, and N. L. Leech, Research
Methods in Applied Settings: An Integrated Approach to Design and Analysis. 2nd ed. 2009, New York, NY: Taylor and Francis Group.
[20] SPSS Inc., SPSS Statistics for Mac,. 2014, IBM Corp.: Armonk, NY.
[21] Grove, S. K., N. Burns, and J. R. Gray, The Practice of Nursing Research: Appraisal, Synthesis, and Generation of Evidence. 7th ed. 2013, St. Louis, MO: Elsevier.
[22] Erinosho, T. O., et al., Awareness of the Fruits and Veggies-More Matters campaign, knowledge of the fruit and vegetable recommendation, and fruit and vegetable intake of adults in the 2007 Food Attitudes and Behaviors (FAB) Survey. Appetite, 2012. 59 (1): p. 155-60.
[23] Thompson, F. E., et al., Fruit and vegetable assessment: performance of 2 new short instruments and a food frequency questionnaire. J Am Diet Assoc, 2002. 102 (12): p. 1764-72.
[24] Hubbard, R. R., et al., Culturally-Based Communication about Health, Eating, and Food: Development and validation of the CHEF scale. Appetite, 2016. 96: p. 399-407.