Modern Chemistry
2014; 2(3): 19-28Published online August 20, 2014 (http://www.sciencepublishinggroup.com/j/mc) doi: 10.11648/j.mc.20140203.11
ISSN: 2329-1818 (Print); ISSN: 2329-180X (Online)
Synthesis and characterization of binary and ternary
dioxouranium (VI) complexes with oxygen, Nitrogen and
sulphur donor ligands
Abeer A. Faheim
1, 21
Chemistry Department, Faculty of Science (Girl's), Al-Azhar University, Nasr-City, Cairo, Egypt, P.O.Box 11754. 2
Chemistry Department, College of Education and Science (Khurma), Taif University, Al-khurma, Taif, Sudia Arabia
Email address:
To cite this article:
Abeer A. Faheim. Synthesis and Characterization of Binary and Ternary Dioxouranium (VI) Complexes with Oxygen, Nitrogen and Sulphur Donor Ligands. Modern Chemistry. Vol. 2, No. 3, 2014, pp. 19-28. doi: 10.11648/j.mc.20140203.11
Abstract:
Mononuclear binary and ternary complexes of UO22+ ion with N-salicylidene-4-Aminotoluene-3-sulfonic acidas primary ligand and 8-hydroxyquinoline as coligand have been prepared. The elemental analysis, molar conductance, IR and solid reflectance spectra in addition to the magnetic moment measurements, thermal study, XRD and SEM analysis were utilized to investigate the coordination behavior of these complexes. From the investigation data, all complexes have metal to ligand ratio of 1:1 and 1:1:1 with octahedral and dodecahedral geometry for binary and ternary complexes, respectively and the force constant, FU-O and bond length, RU-O were calculated. The thermal behavior of these complexes
was investigated and the thermal decomposition pathways have been postulated showing that the final product is metal or metal oxide. Antimicrobial properties of the complexes have also been examined against Staphylococcus aureus (ATCC 25923), Streptococcus pyogenes (ATCC 19615), Pseudomonas fluorescens (S 97), Pseudomonas phaseolicola (GSPB 2828), Fusarium oxysporum and Aspergillus fumigatus. The corrosion inhibition of aluminum specimens in acidic solution was studied by weight loss method. The ternary complex, [UO2(HL)(8-Oqu)H2O] was found to be exhibits excellent
inhibitory activity against the different microorganisms in addition to its corrosion inhibition efficiency towards Al-specimens in acidic solution more than the binary complex, [UO2(HL)NO3].2H2O.
Keywords:
8-Hydroxyquinoline, Mixed Ligand Complexes,Spectroscopic Characterization, Thermal Investigation, Acid Inhibition, Biological Study1. Introduction
The actinides occupy the second row of the f-block on the periodic table, are strong electron acceptors and tend to interact with strong electron donors [1,2]. Of all the actinide ions, the uranyl ion (UO2)2+ has been the most
thoroughly studied as it has the most stable oxidation state and can easily form complexes with various types of ligands [3,4]. The dioxouranium (VI) complexes with N and O donor Schiff bases have been the subject of many investigations, moreover, in the last few decades, mixed ligand complexes have been extensively studied in solution as well as in the solid state and the ternary complexes are found to be more stable than binary complexes [5,6]. These mixed ligand complexes are used in a number of fields like biological, analytical, agricultural industrial and
therapeutic applications [7]. Accordingly we intend to report herein, the synthesis and characterization of ternary complexes using Schiff base ligand with nitrogen, oxygen and sulphur donor sites [8] as primary ligand and 8-hydroxyquinoline as coligand.
2. Experimental
2.1. Analysis and Physical Measurements
N-salicylidene-4-aminotoluene-3-sulfonic acid (H2L) has been described previously [8].
Microanalyses of carbon, hydrogen, nitrogen and sulfur contentswere determined using a Perkin–Elmer 2408 CHN analyzer.Uranyl contents were determined gravimetric [9]. Melting or decomposition points were carried out on a melting point apparatus, Gallenkamp, England. Molar conductance measurements were measured in solutions of the metal complexes in DMF (10–3 M) using WTWD-812 Weilheium-Conductivity meter model LBR, fitted with a cellmodel LTA100. IR spectra were recorded on a Perkin– Elmer FTIRtype 1650 spectrophotometer using KBr discs. The solid reflectance spectra were recorded on a Jasco model V-550 UV–Vis spectrophotometer. TG–DSC measurements were carried out on a Shimadzu thermogravimetricanalyzer using the TA-50 WSI program. X-ray powder diffraction analysis were carried out at ambient temperature with a Shimadzu 160D X-ray diffractometer using Cu-Kα radiation overthe range (4< 2θ
< 80), with steps of 0.01o and a step time of 2 s. Scanning electron microscopy (gold coating, Edwards Sputter Coater, UK) was performed using a Jeol 6310 (Jeol Instruments, Tokyo, Japan) system running at 5–10 keV. The agar-disk diffusion technique was followed to determine the activity of the synthesized compounds against some sensitive organisms [10]. Corrosion inhibition properties have been studied by weight loss measurements for aluminum specimens in 1.0 M HCl solution for different exposure periods (0.5–1.5h) at ambient temperature [11].
2.2. Preparation of the Binary Complex
(0.005 mol) of Uranyl nitrate hexahydrate dissolved in a least amount of distilled water was added to a mixture of (0.005 mol) LiOH·H2O and (0.005 mol) H2L in 40 ml
ethanol. After complete addition, the reaction mixture was refluxed for 3 h with constant stirring to ensure the complete formation of metal complex. The precipitated solid complex was filtered, washed several times with 50% (v/v) ethanol–water followed by ethyl alcohol then diethyl ether and dried in vacuum desiccators over anhydrous CaCl2.
2.3. Preparation of Ternary Complex
(0.005 mol) of Uranyl nitrate hexahydrate dissolved in a least amount of distilled water was added to a mixture of (0.005 mol) LiOH·H2O, (0.005 mol) H2L and (0.005 mol)
of 8-hydroxyquinoline as a coligand in 60 ml ethanol. After complete addition, the reaction mixture was refluxed for 4 h with constant stirring to ensure the complete formation of metal complex. The precipitated solid complex was filtered, washed several times with 50% (v/v) ethanol–water followed by ethyl alcohol then diethyl ether and dried in vacuum desiccators over anhydrous CaCl2.
2.4. Weight Loss Measurements
Weight loss measurements were carried out using aluminum specimens from Aluminum Company of Egypt
has a composition (wt %): Ti (0.006), Zn (0.002), Sb (0.010), Mg (0.002), V (0.005), Mn (0.001), Sn (0.002), Cu (0.003), Pb (0.001), Fe (0.159), Ni (0.002), Si (0.065), Cr (0.004) and balance Al with an regular shapes of 4 cm2 cross-sectional area. Prior to experiment, the surface of aluminum specimens was abraded with the finest grade emery papers to mirror finish, washed thoroughly with acetone and distilled water and finally dried at room temperature. After weighing accurately, Al-specimens were immersed in 50 mL solution of 1.0 M HCl without and with the compounds under study (Schiff base ligand / metal complexes) acting as inhibitors at concentration 0.004 M for different exposure periods (0.5–1.5h) at room temperature. At the end of a run, the specimens were taken out, washed, dried and weighed accurately. Duplicate experiments were performed in each and the mean value of the weight loss has been reported [11].
2.5. Antimicrobial Screening
Eight pathogenic microbes were used to test the biological potentials of the newly synthesized binary and ternary complexes. They were Staphylococcus aureus
(ATCC 25923) and Bacillus subtilis (ATCC 6635) as Gram-positive bacteria; Escherichia coli (ATCC 25922)
and Salmonella typhimurium (ATCC 14028) as
Gram-negative bacteria in addition to Yeast; Candida albicans
(ATCC 10231) and Fungus; Aspergillus fumigatus. The antibiotics; Cephalothin and Chloramphencol, were used as standard references for Gram-positive bacteria and Gram-negative bacteria, respectively, while Cycloheximide
was used as standard reference in the case of yeasts and fungi. Antimicrobial activity was determined using the standardized disk–agar diffusion method [10] described below:
Modern Chemistry 2014; 2(3): 19-28 21
3. Results and Discussion
3.1. Elemental Analysis
The elemental analysis results for the metal complexes are in good agreement with the calculated values (Table 1)
showing that the complexes have metal to ligand stoichiometry of 1:1 and 1:1:1 for binary and ternary complexes, respectively with suggested formula as : [UO2(HL)NO3].2H2O (1) and [UO2(HL)
(8-Oqu)H2O].2H2O (2) that represented in Fig.1.
Table 1. Analytical data and some physical properties of the binary and ternary complexes Compd. No(a)
Emperical formula Color
M.P (°°°°C)
Conductance value (Ω−1mol−1cm2)
µeff
(B.M)
Elemental analysis, found (calcd. %)
C H N S M
(1) [UO2(HL)NO3].2H2O UO2C14H12N2O7S.2H2O; 658.42
Pale
orange > 300 22 Dia.
25.33 (25.54)
1.91 (1.84)
4.48 (4.25)
4.61 (4.87)
36.42 (36.15)
(2) [UO2(HL)( 8-Oqu) H2O].2H2O UO2C23H18N2O5S.3H2O; 758.59
Darck
orange > 300 48 Dia.
36.88 (36.41)
2.76 (2.40)
3.21 (3.69)
4.50 (4.23)
31.09 (31.38)
(a)HLRepresent the deprotonated form of Schiff base ligand 8-Oqu Represent the deprotonated form of 8-hydroxyquinoline.
(b)Conductance value measured in DMF.
O
U O
O N
S O
O
OH O
N O O
.2H2O
[UO2(HL)NO3].2H2O (1)
O
U O
O N
S O
O
OH .2H2O
H2O
O N
[UO2(HL)( 8-Oqu) H2O].2H2 (2)
Figure. 1. Suggested structure of binary and ternary complexes (1,2), respectively
3.2. Conductivity Measurements
The molar conductance values of the metal complexes in DMF (10-3 M solution) were measured at room temperature and the results are listed in Table 1. It is concluded from the results that the metal complexes (1,2) were found to have molar conductance values 22 and 48 Ω−1cm2mol−1, respectively which indicates that they are non electrolytic in nature and there is no counter ion present outside their coordination sphere [13].
3.3. Infrared Spectroscopy
The main IR characteristic stretching frequencies of the binary complex, ternary complex and free ligand (H2L),
along with their proposed assignments are given in Table 2.
The IR spectra of metal complexes show a shift of the ν(C=N) to lower frequency by 23–21 cm−1 compared with the free ligand band at 1651cm−1. This shift indicates coordination of the azomethine group to the metal ions, moreover the coordination of nitrogen to the metal ions would be expected to reduce the electron density of the azomethine link and thus cause a shift in the ν(C=N) group [14]. In the far IR spectra of all complexes, the non-ligand bands observed at 455–410 cm−1 region assigned to ν(M–N) stretch [15]. The disappearance of the free ligand ν(OH) band around 3425 cm−1 in the spectra of all complexes indicating deprotonation of Schiff base prior to coordination, on the other hand, the ν(C–O), which occur at 1304 cm−1 for the ligand, was moved to higher frequencies, (1396 –1312 cm−1) by 92–8 cm−1 after complexation, this shift confirms the participation of phenolic oxygen of the ligand in C–O–M bond formation [16,17]. Conclusive evidence regarding the bonding of oxygen to the metal ions is provided by the occurrence of bands at 525–502 cm−1 region due to ν (M–O) [18]. Moreover, the characteristic vibrations of ν(SO3 asym), ν(SO3 sym) and ν(SO2–OH) at
1204, 1018 and 2530 cm−1 in the free ligand are located around 1157-1155, 1072-995 and 2631-2523 cm−1, respectively in the metal complexes confirming the involvement of sulphonato group in coordination [8]. IR spectra also display two strong bands at 926 and 903 cm−1 for the complexes (1,2), respectively assigned to ν3(O=U=O) vibration. The force constant (FU=O) and the
bond length (RU–O) were calculated. The calculated bond
length values are 7.0632 and 6.7516 mdyn / ˚A, while the calculated force constant values are 1.7329 and 1.7414 ˚A for the UO2(II) complexes, (1,2), respectively [19,20].
involved in formation of a bond with metal [21]. Thus 8 hydroxyquinolate in this complex is monobasic bidentate chelating. Additionally, IR spectrum of complex (
three bands at 1443, 1281 and 1072 cm
unidentate coordination of nitrate [22]. Finally, assignment of the nature of water molecules associated
Table 2. Infrared wave numbers (cm Compd.
No(a) ѵ(C=N)
ν(C–O)
Phenolic Ѵ(SO
H2L 1651 1304 1204, 1018
(1) 1628 1312 1157, 995
(2) 1630 1396 1155, 1072
arepresent the complex number as in table 1.
bQu represent quinoline moiety
3.4. Electronic Spectra
The electronic reflectance spectra of the metal complexes (1,2) have been recorded in the 800
range. The spectra showed new absorption band at 490 and 485 nm for complexes (1,2), respectively
charge transfer transition from the ligand to uranium ion indicating the formation of uranyl complexes.
the magnetic moment measurement
complexes are diamagnetic as expected with coordination number 6 and 8 and exists in octahedral and dodecahedral
Table 3. Thermal analyses data (TG
Compd. No Emperical formula
Temp. Range (°C)
% Weight loss Found (Calcd.)
(1) [UO2(HL)NO3].2H2O UO2C14H12N2O7S.2H2O
47-362 363-412 414-498 499-719 5.67(5.47) 7.33(6.99) 19.74(19.15) 31.88(32.24)
(2) [UO2(HL)(8-Oqu) H2O].2H2O
UO2C23H18N2O5S.3H2O
44-324 324-389 389-545 545-686 687-776 11.92(11.34) 4.73(4.22) 31.48(31.42) 13.50(13.85) 2.62(3.56)
Figure 2. TG- thermograme
involved in formation of a bond with metal [21]. Thus 8-hydroxyquinolate in this complex is monobasic bidentate chelating. Additionally, IR spectrum of complex (1) shows bands at 1443, 1281 and 1072 cm−1 attributed to unidentate coordination of nitrate [22]. Finally, the assignment of the nature of water molecules associated
with the complex formation under study was much more complicated as ligand vibrations interfere in
The thermal data confirms the nature of water molecule to be lattice/coordinated. The thermal study will be discussed in detailed manner later.
Infrared wave numbers (cm−1)and tentative band assignments for the binary and ternary complexse
(SO3) Ѵ(SO2-OH) Ѵ(M-O) Ѵ(M-N) Other bands
1204, 1018 2530 - - 3425 ν(OH)
1157, 995 2523 502 410 926
ν(NO
1155, 1072 2631 525 455 903
The electronic reflectance spectra of the metal ) have been recorded in the 800–200 nm absorption band at 490 and ), respectively attributed to a ligand to uranium ion indicating the formation of uranyl complexes. Additionally, suggested that the expected with coordination in octahedral and dodecahedral
geometry, respectively [23-25].
3.5. Thermal Analyses (TG-DSC) of the
The results of TG-DSC analyses of the
(1,2), Figs.2,3 as the decomposition stages, temperature ranges, decomposition products, the found and calculated weight loss as well as the
reaction are given in Table 3. agreement with the previous complexes and revealed the following:
Thermal analyses data (TG-DSC) for binary and ternary complexes
% Weight loss
Found (Calcd.) Lost fragment
Probable residue Found/(Calcd.) 5.67(5.47) 7.33(6.99) 19.74(19.15) 31.88(32.24)
2H2O (hyd.) NO2 NO2 and SO3
O2, HC≡CH and C6H5-C6H5
UO2C14H12N UO2C14H12NO UO2C14H12 U; 35.38(36.15) 11.92(11.34) 4.73(4.22) 31.48(31.42) 13.50(13.85) 2.62(3.56)
2H2O (hyd.), H2O (coord.) and O2
O2
C6H5SH and C10H8 CO, HCN and HC≡C-C≡CH HCN
UO2C23H18N UO2C23H18N UO2C7H4N2O
UO2CHN
UO2; 35.75(35.60)
thermograme of (a) binary and (b) ternary complexes (1,2), respectively
the complex formation under study was much more as ligand vibrations interfere in this region. the nature of water molecule to thermal study will be discussed
ts for the binary and ternary complexse
Other bands(b)
3425 ν(OH) phenolic
ν3(O=U=O) and 1443; 1281; 1072 NO3 coordinate).
ν3(O=U=O) and 1535(Qu.moiety)
25].
DSC) of the Complexes
DSC analyses of the metal complexes, , Figs.2,3 as the decomposition stages, temperature ranges, decomposition products, the found and calculated ll as the probable residue and heat of reaction are given in Table 3. The results show good agreement with the previous suggested formulae of the
and revealed the following:
Probable residue Found/(Calcd.)
DSC peak (◦C)
Endo Exo ∆H (J/g)
N2O7S NO5S
U; 35.38(36.15) 86 104 360 459 -60.82 -53.61 -32.44 -6.49
N2O3S N2OS
O 35.75(35.60) 104 399 453 523 279 -66.12 33.71 -20.44 -20.49 -14.44
Modern Chemistry 2014; 2(3): 19-28 23
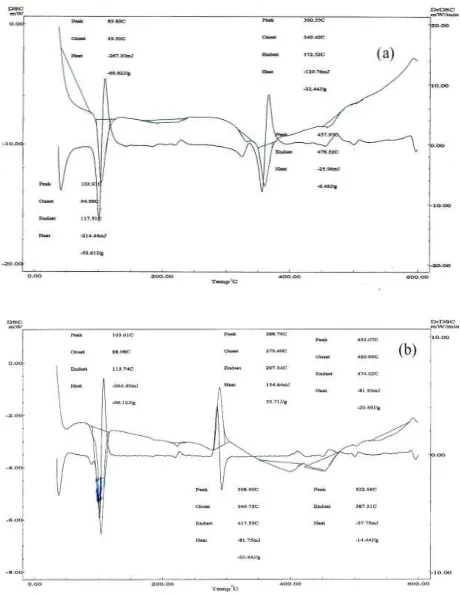
Figure 3. DSC- thermograme of (a) binary and (b) ternary complexes (1,2), respectively
[UO2(HL)NO3].2H2O (1) exhibits four steps of
decomposition process from 47-719 0C. The initial weight loss of 5.67% (calcd. 5.47%) in the temperature range 47-362 0C is due to the loss of two hydrated water molecules. The loss of crystal water molecules in this complex was accompanied by an endothermic peak at 86 oC with ∆H -60.82 J/g. The next weight loss of 7.33% (calcd. 6.99%) in the range 363-412 0C attributed to a loss of NO2 and
accompanied by an endothermic peak at 104 oC with ∆H -53.61 J/g. The third stage within the temperature range 414-498 oC is related to the evolution of NO, O2 and SO2
with a found mass loss of 19.74% (calcd. 19.15%) and accompanied by an endothermic peak at 360 oC with ∆H -32.44 J/g. The final stage between 499-719 oC, represents the loss of O2, HC≡CH and C6H5-C6H5 with a found mass
loss of 31.88% (calcd. 32.24%) and accompanied by an endothermic peak at 459 oC with ∆H -6.49 J/g. The remaining residue is 35.38%, corresponding to formation of U- metal (calcd. 36.15%).
[UO2(HL)( 8-Oqu) H2O].2H2O (2)exhibits five steps of
decomposition process from 44-776 0C. The initial weight loss of 11.92% (calcd. 11.34%) in the temperature range 44-324 0C is due to the loss of two hydrated water molecules, one molecule of coordinated water and O2. This
step was accompanied by an endothermic peak at 104 oC with ∆H -66.00 J/g. The next weight loss of 4.73% (calcd. 4.22%) in the range 324-389 0C attributed to a loss of O2
and accompanied by an exothermic peak at 279 oC with ∆H
33.71 J/g. The third stage within the temperature range 389-545 oC is related to the evolution of C6H5SH and C10H8
with a found mass loss of 31.48% (calcd. 31.42%) and accompanied by an endothermic peak at 399 oC with ∆H -20.44 J/g. The fourth stage between 545-686 oC, represents the loss of CO, HCN and HC≡C-C≡CH with a found mass loss of 13.50% (calcd. 13.85%) and accompanied by an endothermic peak at 453oC with ∆H -20.49 J/g. The final step is due to loss of HCN with a found mass loss of 2.62% (calcd. 3.56%) at temperature range 687-776 oC and accompanied by an endothermic peak at 523 oC with ∆H -14.44 J/g. The remaining residue is 35.75%, corresponding to the formation of UO2 (calcd. 35.60%).
The sequence of the thermal decomposition process for the for binary and ternary complexes (1,2), respectively is summarized in Scheme 1 and the results obtained are in good agreement with the theoretical formula suggested from the elemental analysis.
3.6. Powder X-Ray Diffraction Characterization
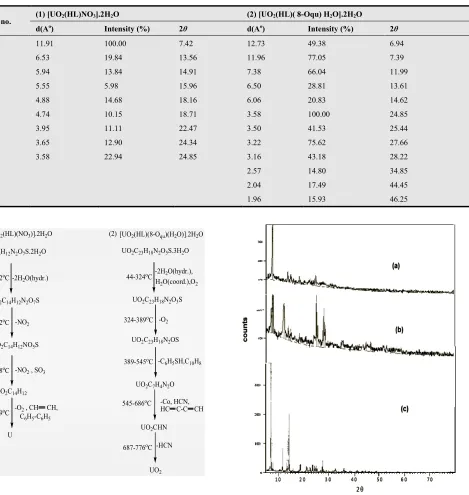
The powder X-ray diffraction patterns of the metal complexes have been recorded in a scanning range of 5– 80◦ (2θ) and depicted in Fig.4. Table 4 shows the observed diffraction data, i.e., inter planar spacing d (Ǻ), relative intensities (I/I0) and (2θ). From the patterns plotted in Fig.
2, we can observe that the diffraction peaks of all metal complexes, in terms of location, numbers or intensity are different from the ligand [8] indicating that the reaction produced a new crystalline phase, that is, the complex has been formed [26].
3.7. Scanning Electron Microscopy Analysis
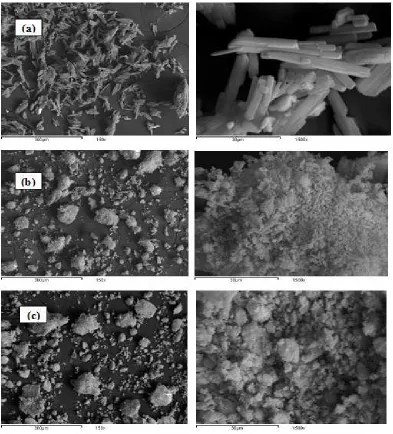
Scanning electron microscope technique (SEM) gives a general perception about the microstructure, surface morphology and particle size of the compounds [27]. The scanning electron micrograph of Schiff base ligand and its uranyl complexes, (1,2) at room temperature depicted in Fig.5(a- c). and indicate that Schiff base ligand differ significantly from that of its complexes due to the metal ion, moreover, the surface morphology of metal complexes changes as a result of quinoline moiety [28].
3.8. Corrosion inhibition study
Table 4. X-ray diffraction data of for binary and ternary complexes
Peak no. (1) [UO2(HL)NO3].2H2O (2) [UO2(HL)( 8-Oqu) H2O].2H2O
d(Ao) Intensity (%) 2θ d(Ao) Intensity (%) 2θ
1 11.91 100.00 7.42 12.73 49.38 6.94
2 6.53 19.84 13.56 11.96 77.05 7.39
3 5.94 13.84 14.91 7.38 66.04 11.99
4 5.55 5.98 15.96 6.50 28.81 13.61
5 4.88 14.68 18.16 6.06 20.83 14.62
6 4.74 10.15 18.71 3.58 100.00 24.85
7 3.95 11.11 22.47 3.50 41.53 25.44
8 3.65 12.90 24.34 3.22 75.62 27.66
9 3.58 22.94 24.85 3.16 43.18 28.22
10 2.57 14.80 34.85
11 2.04 17.49 44.45
12 1.96 15.93 46.25
[UO2(HL)(NO3)].2H2O
UO2C14H12N2O7S.2H2O
47-362oC -2H2O(hydr.)
UO2C14H12N2O7S
363-412oC
UO2C14H12NO5S
-NO2
414-498oC
UO2C14H12
-NO2 , SO3
499-719oC
U
-O2 , CH CH,
C6H5-C6H5
[UO2(HL)(8-Oqu)(H2O)].2H2O
UO2C23H18N2O5S.3H2O
44-324oC-2H2O(hydr.),
UO2C23H18N2O3S
324-389oC UO2C23H18N2OS
-O2
-C6H5SH,C10H8
H2O(coord.),O2
389-545oC
UO2C7H4N2O
545-686oC -Co, HCN, HC C-C CH
UO2CHN
-HCN 687-776oC
UO2
(1) (2)
Scheme 1. The thermal decomposition sequence for binary and ternary complexes (1,2), respectively
Figure 4. XRD diagram of (a) binary complex, (b) ternarycomplex and (c)) H2L ligand respective
Table 5. Corrosion parameters data for Al-specimens in absence and existence of corrosion inhibitors at ambient temperature after 0.5, 1.0 and 1.5h
Inhibitor name
Weight loss, inhibition efficiency (%) and degree of surface coverage (θ)
after 0.5h after 1.0h after 1.5h
W(mg/cm2) IE (%) W(mg/cm2) IE (%) W(mg/cm2) IE (%)
Blank(a) *
1.65 - 3.48 - 5.78
-H2L 1.54 6.67 (0.07)* 2.89 16.95(0.17) 3.50 39.45(0.39)
(1) 1.31 20.61(0.21) 2.48 28.73(0.29) 2.81 51.38(0.51)
(2) 1.00 39.39(0.39) 1.79 48.56(0.48) 2.03 64.88(0.65)
(a)1M HCl
Modern Chemistry 2014; 2(3): 19-28 25
When Al-specimens were immersed in 1.0 M HCl after exposure period of 0.5, 1.0 and 1.5 h, it suffered a weight loss of 1.65, 3.48 and 5.78mg cm−2, respectively. A reduction in weight loss of the metal coupons in the presence of the inhibitors was observed compared to the blank, this indicates that the additives inhibit the corrosion of Al-specimens in the aggressive solution; (1.0 M HCl) [30]. Table 5 represents the corrosion inhibition efficiencies (% IE) of the synthesized inhibitors on the Al-specimens corrosion in 1.0 M HCl solution at ambient temperature. The extent of covering the metal surface by inhibitor molecules can be expressed in term of the surface coverage (θ) which represents the degree of arrangement of inhibitor molecules on the metal surface [31,32]. The relation
between the different parameters was given in Figs.6,7 and revealed that the presence of the Schiff base ligand or its metal complexes in the aggressive solution inhibited the corrosion of Al-specimens and such inhibition may be attributed to larger coverage of metal surface with inhibitor molecules as a result to the accumulation of the inhibitor molecules onto the metal surface and protective film formation on the metal surface which decreases the interaction between the acidic medium and the metal surface [33]. Moreover, the ternary complex (2), showed comparatively enhanced inhibition efficiency than binary complex (1) or the Schiff base ligand may be due to presence of more functional groups as a result of the quinoline moiety [34].
Figure. 6. Weight loss against time for Al-specimens corrosion in 1.0M HCl in absence and presence of 0.004M of corrosion inhibitors
Figure 7. Variation of inhibition efficiency (%) with immersion time in 1.0 M HCl in absence and presence of 0.004M of corrosion inhibitors
3.9. Antimicrobial Assay
The antimicrobial activities of the newly synthesized complexes were tested in vitro against series of organisms to increase the chance of detecting antibiotic principles in tested materials. The activity was determined by measuring the inhibition zone diameter values (mm) of the complexes against the organisms. The screening data in addition to the calculated percent activity index are given in Table 6 and are graphically presented in Fig. 8(a,b). Analyzing the tabulated results show the following:
a) The complexes show a significant degree of antimicrobial activity against the tested organisms and the activity increases as the concentration of the complexes increases [35]. Both the uranyl complexes (1,2) have remarkable activity against all types of bacteria, yeasts and fungi. They display high activity (mean of zone diameter is >2/3 of mean zone diameter of reference standard) against
Salmonella typhimurium, intermediate activity (mean of
zone diameter is ≤ 2/3 of mean zone diameter of reference standard) against Staphylococcus aureus and Bacillus subtilis and displaylow activity (mean of zone diameter is ≤ 1/3 of mean zone diameter of reference standard) against
Escherichia Coli, Candida albicans and Aspergillus
fumigates.
b) The ternary complex (2) has a higher degree of activity than the binary complex (1) against all strains of organisms may be due to the increase in the functional group as a result to quinoline moiety [21].
c) The ternary complex (2) showed excellent inhibitory activity against the growth of the Salmonella typhimurium, it displays a comparable value to the standard.
These studies reveal that the ternary uranyl complex (2) can be used as potential chemotherapeutic agent and hold much promise in the field of drug discovery.
4. Conclusions
Binary and ternary complexes of UO2(II) ion have been
synthesized and their structural situation elucidated by various instrumental techniques. An octahedral and dodecahedral geometries were achieved around UO2(II) in
binary and ternary complexes, respectively. The bioactivity of these complexes in addition to their corrosion inhibition properties was studied. [UO2(HL)(8-Oqu)H2O].2H2O (2)
exhibits biological effect and corrosion inhibition properties higher than [UO2(HL)NO3].2H2O (1) may be
due to quinoline moiety.
Table 6. Antimicrobial screening results of the binary and ternary uranyl complexes
Organism
Gram - positive bacteria Gram - negative bacteria Yeasts Fungi
Staphylococcus aureus (ATCC 25923) Bacillus subtilis (ATCC 6635) Salmonella typhimurium (ATCC 14028) Escherichia coli (ATCC 25922) Candida albicans (ATCC 10231) Aspergillus fumigatus Conc. Sample 1 mg/mL 0.5 mg/mL 1 mg/mL 0.5 mg/mL 1 mg/mL 0.5 mg/mL 1 mg/mL 0.5 mg/mL 1 mg/mL 0.5 mg/mL 1 mg/mL 0.5 mg/mL
(1) 20(57) 15(58) 19(54) 13(52) 25(69) 21(75) 10(26) 8(30) 9(26) 7(25) 11(30) 7(27)
(2) 23(66) 17(65) 22(63) 14(56) 30(83) 26(93) 13(34) 9(33) 11(31) 9(32) 12(32) 9(35)
DMF 0 0 0 0 0 0 0 0 0 0 0 0
R.S 35 26 35 25 36 28 38 27 35 28 37 26
• The test was done using the agar–disc diffusion method and % Activity indices are in parentheses.
• R.S; Reference standard : Chloramphencol and Cephalothin were used as standard references for Gram positive bacteria and Gram negative bacteria, respectively and Cycloheximide was used as standard reference in case of yeasts and fungi.
• Inhibition values: (a) low activity = diameter zone is ≤ 1/3 of mean zone diameter of control, (b) intermediate activity = diameter zone is ≤ 2/3 of mean zone diameter of control, (c) high activity = diameter zone is >2/3 of mean zone diameter of control and (e) -No effect.
0 1 2 3 4 5 6 7
0.5 1 1.5
Immersion time (h)
W e ig h t L o s s ( m g /c m 2)
Control HHH2L22L)L) (1) (2)
0 10 20 30 40 50 60 70
0.5 1 1.5
Im m ersion tim e (h)
In h ib it io n e ff e c ie n c y ( % )
Modern Chemistry 2014; 2(3): 19-28 27
Figure. 8. Antimicrobial activity of metal complexes towards different organisms at (a) higher concentration and (b) lower concentration, respectively
References
[1] L.S. Natrajana, A.N. Swinburnea, M.B. Andrewsa, S. Randalla and S. L. Heatha, Coord. Chem. Rev., 2014, 267, 171–193.
[2] J.P. Dognon, Coord. Chem. Rev., 2014, 266, 110–122. [3] R.J. Baker, Chem. Eur. J., 2012, 18, 16258 – 16271. [4] S. D. Houwer and C. G. Walrand, J. Alloys Compd., 2001,
323–324, 683–687.
[5] S.K. Gupta, N. Sen and R. J. Butcher, Polyhedron, 2014, 71, 34–41.
[6] A.Z. El-Sonbati, M. A. Diab, A. A. El-Bindary, M. I. Abou-Dobara and H. A. Seyam, Spectrochim. Acta Part A, 2013, 104, 213–221.
[7] J. Dharmaraja, T. Esakkidurai, P. Subbaraj and S. Shobana, Spectrochim. Acta Part A, 2013, 114, 607-621.
[8] A.A. Faheim, S.N. Abdou and Z. H. Abd El-Wahab, Spectrochim. Acta Part A, 2013, 105, 109-124.
[9] M. Shebl, Spectrochim. Acta Part A, 2014, 117, 127-137. [10] M. Shebl, S. M. E. Khalil and F. S. Al-Gohani, J. Mol.
Struct., 2010, 980, 78-83.
[11] X. Li, S. Deng and H. Fu, Corros. Sci., 2012, 62, 163–175. [12] M. Aljahdali, Spectrochim. Acta Part A, 2013, 112, 364-376. [13] J. F. Wang, N. Ren, F. T. Meng, J. J. Zhang, Thermochim.
Acta., 2011, 512, 118-123.
[14] Z. H. Abd El-Wahab, Spectrochim. Acta Part A, 2007, 67, 25-38.
[15] H. A. El-Boraey, F. A. El-Saied and S. A. Aly, J. Therm. Anal. Calorim. 2009, 96, 599–606.
[16] A. A. Nejo, G. A. Kolawole and A. O. Nejo, J. Coord. Chem., 2010, 63, 4398-4410.
[17] A. Manimaran and C. Jayabalakrishnan, Synth. React. Inorg. Met-Org. Nano-Met. Chem., 2010, 40, 116-128.
[18] N. Raman and A. Selvan, J. Mol. Struct., 2011, 985, 173-183.
[20] A. A. Ibrahim, A. M. Adel, Z. H. Abd El–Wahab and M. T. Al–Shemy, Carbohydr. Polym., 2011, 83, 94–115.
[21] Z. H. Abd El-Wahab, J.Coord. Chem., 2008, 61, 3284–3296. [22] Z. H. Abd El-Wahab, M. M. Mashaly and A. A. Faheim,
Chem. Pap., 2005, 59, 25-36.
[23] S. A. Sadeek, M. S. El-Attar and S. M. Abd El-Hamid, J. Mol. Struct., 2013, 1051, 30–40.
[24] O. M. I. Adly, Spectrochim. Acta Part A., 2011, 79, 1295– 1303.
[25] A. A. Faheim, Spectrochim. Acta Part A., 2012, 88, 10– 22 [26] J. Wanga, F. Mengc, S. Xud, X. Liua and J. Zhanga,
Thermochim. Acta., 2011, 521, 2– 8
[27] F. A. Al-Saif and M. S. Refat, J. Therm. Anal. Calorim., 2013, 111, 2079–2096.
[28] E. H. El-Mossalamy, F. M. Al-Nowaiser, S. A. Al-Thabaiti,
A. O. Al-Youbi, S. N. Baschel and A. Y. Obaid, Monatsh. Chem., 2007, 138, 853–857.
[29] M. Behpour, S. M. Ghoreishi, N. Mohammadi, N. Soltani and M. S. Niasari, Corros. Sci., 2010, 52, 4046–4057. [30] I. B. Obot, E. E. Ebenso and M. M. Kabanda, J. Environ.
Chem. Eng., 2013, 1, 431–439.
[31] S. E. Nataraja, T.V. Venkatesha and H.C. Tandon, Corros. Sci., 2012, 60, 214–223.
[32] E.E. Ebenso, Mater. Chem. Phys., 2003, 79, 58–70.
[33] N. A. Negm, Y. M. Elkholy, M. K. Zahran and S. M. Tawfik, Corros. Sci., 2010, 52, 3523–3536.
[34] G. Achary, H. P. Sachin, Y. A. Naik and T.V. Venkatesha, Mater. Chem. Phys., 2008, 107, 44–50.