© Author(s) 2009. This work is distributed under the Creative Commons Attribution 3.0 License.
Earth System
Sciences
Variability of the groundwater sulfate concentration in fractured
rock slopes: a tool to identify active unstable areas
S. Binet1,2,3,5, L. Spadini2, C. Bertrand3, Y. Guglielmi4, J. Mudry3, and C. Scavia5
1Institut des Sciences de la Terre d’Orl´eans, ISTO, UMR 6113, Universit´e d’Orl´eans, CNRS/INSU, Universit´e Franc¸ois Rabelais, Tours, Campus G´eosciences, 1A, rue de la F´erollerie, 45071 Orl´eans cedex 2, France
2Laboratoire de G´eophysique interne et tectonophysique, LGIT, UMR 5559, Universit´e Joseph Fourier, CNRS/INSU, Observatoire de Grenoble, BP 53, 38041 Grenoble, France
3Laboratoire de Chrono-Environnement, LCE, UMR 6249, Universit´e de Franche-Comt´e, CNRS/INSU France 4G´eoSciences Azur (GA), UMR6526, CNRS/INSU/IRD, UR082, Observatoire de la Cote d’Azur, Universit´e de Nice Sophia-Antipolis, Universit´e Pierre et Marie Curie, Paris VI, 250 rue A. Einstein, 06560 Valbonne, France
5Dipartemento Ingegneria Strutturale e Geotecnica, DIST, Politecnico di Torino, Corso Duca Abruzzi 24, 10129 Torino, Italy Received: 29 June 2009 – Published in Hydrol. Earth Syst. Sci. Discuss.: 6 August 2009
Revised: 29 October 2009 – Accepted: 7 November 2009 – Published: 8 December 2009
Abstract. Water chemical analysis of 100 springs from the Orco and the Tin´ee valleys (Western Italy and Southern France) and a 7 year groundwater chemistry monitoring of the 5 main springs were performed. All these springs drain from crystalline rock slopes. Some of these drain from cur-rently active gravitational slope deformations.
All groundwaters flowing through presently unstable slopes show anomalies in the sulfate concentrations com-pared to stable aquifers. Particularly, an increase of sul-fate concentrations was observed repeatedly after each of five consecutive landslides on the La Clapi`ere slope, thus at-testing to the mechanical deformations are at the origin of this concentration change. Significant changes in the water chemistry are produced even from slow (mm/year) and low magnitude deformations of the geological settings.
Pyrite nuclei in open fractures were found to be coated by iron oxides. This suggests that the increase of dissolved sul-fate relates to oxidative dissolution of Pyrite. Speciation cal-culations of Pyrite versus Gypsum confirmed that observed changes in the sulfate concentrations is predominantly pro-vided from Pyrite. Calculated amounts of dissolved miner-als in the springs water was obtained through inverse mod-elling of the major ion water analysis data. It is shown that the concentration ratio of calculated dissolved Pyrite versus calculated dissolved gneiss rock allows us to unambiguously
Correspondence to: S. Binet
distinguish water from stable and unstable areas. This result opens an interesting perspective for the follow-up of sliding or friction dynamic in landslides or in (a) seismic faults.
1 Introduction
The water in fractured rock is one of the major triggering factors that influence the rock stability (Keefer et al., 1987). The water saturation conditions determines the interstitial pressure. Changing interstitial pressure may cause fracture growth and landslides which, in turn, affect the infiltration conditions and the groundwater pathways (Guglielmi et al., 2005) and this potentially impacts the water transfer time and the water saturation conditions (Bonzanigo et al., 2001). During a deformation event, the combination of all these ef-fects may affect, in turn, the interstitial pressure and, thus, the overall stability of the rock masses (Forlati et al., 2001). Thus, a good hydrogeological knowledge is necessary to re-alize an accurate stability evaluation.
specific hydrogeochemical methods from karstic hydrology (Mudry, 1990) to the unstable fractured areas (Vengeon, 1998; Guglielmi et al., 2000; Tullen, 2002) in the aim of characterizing the groundwater flows. The results highlight – pore water pressure triggers the gravitational deformation – induce a motion of the entire rocky slope – a propaga-tion of discontinuities in the rock material (Barla and Chiri-otti, 1996; Agliardi et al., 2001). It can generate additional cracks (Scavia, 1995) leading to a porosity and permeability changes creating a new water pressure distribution (Binet et al., 2007c).
Thus, in theory this hydro-mechanical deformation phe-nomenon may generate additional reactive surface areas which, in turn, can change the chemical weathering rate and the groundwater chemistry. The aim of the present study is to characterise the chemical changes of major ions of water flowing through gravitational active faults compared to in-active ones in a similar geological context. The changes in the water chemistry obtained within the framework of a long survey, indicates that sliding velocity and chemical composi-tion are closely related. Unstable areas could be unambigu-ously determined by an original approach, which is based on the determination of the potentially dissolving minerals in spring water. This result opens interesting perspectives for monitoring the deformations and can provide a tool for the an eventual fracture growth monitoring.
2 Material and methods 2.1 Study sites
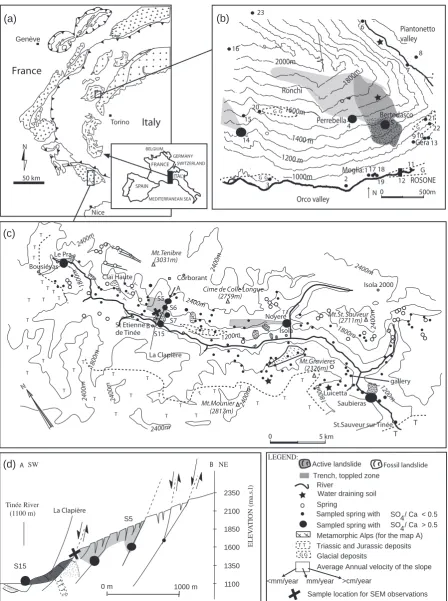
“Tin´ee” (Southern Alps, France) and “Orco” (Rosone slope in the Eastern Alps, Italy) are two Alpine valleys composed of gneiss rocks (Fig. 1). These valleys are characterised by continuous landslide movements (Barla and Chiriotti, 1996; Casson et al., 2003), which shaped the landscape from the post-glacial period (Julian and Anthony, 1996). The past and actual landslides in these valleys may mobilize several million cubic metres of rock. Due to the inherent risk, both Italian and French government authorities (Follacci, 1987; Amatruda et al., 2004) monitor the actual active slope defor-mations. In Fig. 1, the locations and velocities of the actual movements are symbolized by grey surfaces. In these areas, different kinds of deformation were described by Julian and Anthony (1996). Toppling, in the higher part of the slopes (1500–2500 m above-sea-level), where cracks and trenches move typically some mm per year (Fig. 1d). Downhills, ve-locities of more than one metre per year were recorded in 1997 and 2001 by the French authorities, in the “La Clapi`ere” landslide and about 1 to 10 cm in 2001 in the “Rosone” landslide recorded by Italian authorities. The deformation velocities are recorded using a distancemeter – tachome-ter, the detection limits are under 1 cm/an. More detailed methodologies of the ground deformation monitorings used
in this paper are described in Follacci (1987) and Amatruda et al. (2004).
The flow and geological conditions are as follows: In the Tin´ee valley, the rainwater infiltrates through the frac-tured gneiss rocks at the top of the hillslope around 1500– 2000 m above sea level (m a.s.l.) and moves to the valley (1000 m a.s.l.) (Cappa et al., 2004; Binet et al., 2007b). Wa-ter flows through the cracks, until it reaches 100 m under the ground surface where it arrives at the saturated zone where it increases the pore pressure and, thus, participates in the landslide triggering (Cappa et al., 2004). Local high perme-able Triassic and Jurassic deposits are pinched in gneiss rock (seeT in the Fig. 1), for example under the foot of the La Clapi`ere landslide (Gunzburger and Laumonier, 2002). Such deposits were observed in the Tin´ee valley close to the S15 springs and at the top of the Mounier mount (Fig. 1).
In the Orco valley, water flows through a 10 m deep sub-surface aquifer (developed in the weathered gneiss rocks and decompressed cracks of the slope. The groundwater recharge occurs locally in the upper part of the slope by infiltration at about 2500–1900 m a.s.l. In this valley, the groundwater will not be in contact with gypsum-rich Triassic formations. Instead, some of the areas are covered by glacial deposits which may be the principal aquifers for specific sources. The main outflow occurs downhill from the Rosone unstable area (around 1000 m a.s.l) (Binet et al., 2007a).
2.2 Sampling and analysis of the Alpine crystalline rocks
Our own field trips (Binet et al., 2007a, b), combined with previous investigations (Mazeran and F´eraud, 1974; F´eraud et al., 1975; Gunzburger and Laumonier, 2002) lead to the establishment of the list of the major rocks and associated minerals determined in the investigated areas (Table 1).
NN
0 5 km
1800m 1800m 1800m 2400m 1200m 1200m 1800m 2400m 2400m 2400m 2400m 2400m 2400m 2400m 2400m Bousiéyas Le Pra Corborant Isola Isola 2000
St.Sauveur sur Tinée La Clapière S15 S7 S6 S5 Mt.Tenibre (3031m)
Cime de Colle Longue (2759m) Mt.St. Sauveur (2711m) Mt.Gravieres (2326m) Mt.Mounier (2817m) Noyere Luicetta Saubieras St Etienne de Tinée gallery Claï Haute
(c)
(d)
A B LEGEND: nn Sampled spring with Active landslide River Spring
France
Italy
Torino Genève Nice 50 km N(a)
SO / Ca > 0.5 4 SO / Ca < 0.54 Sampled spring with
Average Annual velocity of the slope S15 S5 Tinée River (1100 m) 2350 2100 1850 1600 1350 1100 SW ELE V A TION (ma.s.l)
0 m 1000 m
NE
A B
La Clapière
Sample location for SEM observations Trench, toppled zone
Fossil landslide Perrebella Bertodasco ROSONE Piantonetto valley Orco valley 16 15 14 3 2 17 18 19 1 5 6 7 23 4 910 8 20 11 12 21
N 0 500m
Ronchi 2000m 1800m 1600m 1400 m 1200 m 1000m
(b)
Metamorphic Alps (for the map A)
<mm/year mm/year >cm/year
FRANCE SPAIN ITALY GERMANY MEDITERRANEAN SEA BELGIUM SWITZERLAND T T T ? T T T T
T T T T T T T
T T T T
T
T T
T T T
T T ?
T T T T
T T Triassic and Jurassic deposits T T T T T T T T T T T T T T T T T T T T
G G Glacial deposits
G G G G
G G
13 22
Moglia:
Gera
Water draining soil
[image:3.595.75.524.64.666.2]Table 1. Main and secondary minerals observed in the Orco and Tin´ee valleys. Molar percentage and chemical equations of the dissolution in a gneiss rock media are assessed for the La Clapi`ere slope by Guglielmi et al. (2000). Log (K) values come from wateq4f database (Parkust and Appelo, 2004).
Minerals % molar Log (K) Dissociation equations
Quartz 66 −3.98 SiO2+2H2O⇔H4SiO4
Kmica 4.1 11.63 KAl3Si3O10(OH)2+9H2O+H+⇔K++3H4SiO4+3Al(OH)3
Phlogopite 3.0 −35.19 KMg3AlSi3O10(OH)2+7H++3H2O⇔K++3Mg+2+3H4SiO4+Al(OH)3
Plagioclase solid solution between:
Albite / 4.6 NaAlSi3O8+H++7H2O⇔Na++3H4SiO4+Al(OH)3
Anorthite / −9.21 CaAl2Si2O8+2H++6H2O⇔Ca+2+2H4SiO4+2Al(OH)3
Plagioclase An 70 8.0 −9 Na0.3Ca0.7Al1.7Si2.3O8+6.3H2O+1.7H+⇔.3Na++ .7Ca+2+1.7Al(OH)3+2.3H4SiO4
Secondary minerals
Pyrite / −18.48 Fe S2+3.75 O2+3.5 H2O⇔4 H++Fe(OH)3+2 SO24−
Fe oxides / 4.89 Fe(OH)3+3H+⇔Fe+3+3H2O
Gibbsite / 8.11 Al(OH)3+3H+⇔Al+3+3H2O
Gypsum / −4.58 Ca SO42H2O⇔Ca2++SO24−+2H2O
Halite / 1.58 NaCl⇔Na++Cl−
Dolomite / −16.54 CaMg(CO3)2⇔Ca+2+ Mg+2+ 2CO−32
Calcite / −8.48 Ca CO3⇔Ca2++CO23−
2.3 Sampling and analysis of the Alpine crystalline basement groundwater
2.3.1 Spatial variability of groundwater chemistry The water composition of a large number of the Tin´ee and the Orco valley springs was determined during the low water-level periods (recession stage).In the Tin´ee valley, 92 springs were analyzed during an intensive campaign in August 2003 (Fig. 1c). On the Orco valley, 22 springs were analyzed in June 2004 (Fig. 1b).
Each sample was classified depending on the geological environment of catchment (soil, gneiss rock, glacial or Tri-assic deposits in Fig. 1 based on geological map described in Faure-Muret, 1955) and on the stability of the correspond-ing formations (are some rock deformations known in the catchment or not?). The stable/unstable classification was based on geomorphological observations and on prior slope stability studies performed in these two valleys (Forlati et al., 2001; Julian and Anthony, 1996). The “La Clapi`ere” region and the Rosone slope are known to be a very unstable area. In all these sites, the water flows from soil to the gneiss rock but in different environments of slope stabilities: Unstable for S15 and S5 La Clapi`ere (Tin´ee) and Bertodosca Rosone (Orco) springs, and stable for Luicetta (Tin´ee) and Moglia (Orco) springs.
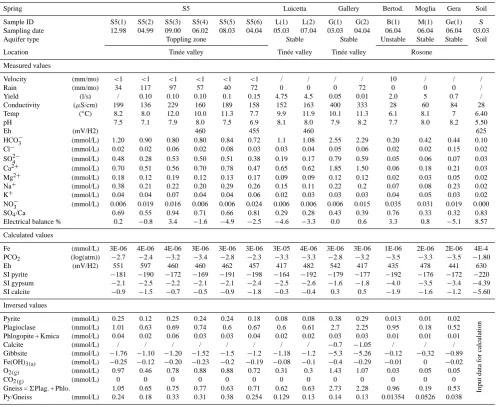
Corresponding sulfate and calcium data of all springs are given in Fig. 3, and Table 2 gives the complete water chemi-cal analysis for the main springs draining through gneiss rock of the two valleys.
2.3.2 Temporal variability of groundwater chemistry Previous studies pointed to the S15 spring, situated down-stream of the landslide, drains the water flowing through this unstable area (Guglielmi et al., 2000, 2002). The wa-ter composition and the temporal variability of this spring were consequently studied in the framework of a nine year survey (1995 to 2004). Table 3 presents the complete water chemical analysis of the S15 spring situated at the foot of the landslide for ten dates that characterise the surrounding data, and Fig. 4 represents the sulfate concentrations of the whole survey.
The periods of freshwater intrusion into the S15 aquifer downstream needs to be identified. The presence of groundwater Nitrate levels above the detection limit (>0.001 mmol/L) correlated to meteorological events (snow melting and rainfall), whereas in the recession stages (low water period) showed that nitrate contributions decreased be-low the detection limit. The recession stages where conse-quently associated with periods of null nitrate concentration. The sulfate measurements realized during the low water pe-riod are plotted in Fig. 4 with a square symbol. Such exhaus-tive long-time surveys are not available for the other sites. 2.3.3 Analytic protocol
Table 2. Spatial variability of water quality recorded on the six major springs from the two studied valleys. S5 refers to the spring of the La Clapi`ere (Tin´ee) site. Calculated values of the saturation index (SI) and inversed values of the amount of dissolved minerals (positive values means dissolution, negative values means precipitation, inversed O2values exceed the saturation limit, this means that the system is open for
oxygen).
Spring S5 Luicetta Gallery Bertod. Moglia Gera Soil
Sample ID S5(1) S5(2) S5(3) S5(4) S5(5) S5(6) L(1) L(2) G(1) G(2) B(1) M(1) Ge(1) S Sampling date 12.98 04.99 09.00 06.02 08.03 04.04 05.03 07.04 03.03 04.04 06.04 06.04 06.04 03.03 Aquifer type Toppling zone Stable Stable Unstable Stable Stable Soil
Location Tin´ee valley Tin´ee valley Tin´ee valley Rosone
Measured values
Velocity (mm/mo) <1 <1 <1 <1 <1 <1 / / / / 10 / / / Rain (mm/mo) 34 117 97 57 40 72 0 0 0 72 0 0 0 / Yield (l/s) / 0.10 0.10 0.10 0.1 0.15 4.75 4.5 0.05 0.01 2.0 5 0.7 / Conductivity (µS/cm) 199 136 229 160 189 158 152 163 400 333 28 60 84 28 Temp (◦C) 8.2 8.0 12.0 10.0 11.3 7.7 9.9 11.9 10.1 11.3 6.1 8.1 7 6.40 pH 7.5 7.1 7.9 8.0 7.5 6.9 8.1 8.0 7.9 8.2 7.7 8.0 8.2 5.50
Eh (mV/H2) 460 455 460 625
HCO−3 (mmol/L) 1.20 0.90 0.80 0.80 0.84 0.72 1.1 1.08 2.55 2.29 0.20 0.42 0.44 0.10 Cl− (mmol/L) 0.02 0.02 0.06 0.02 0.08 0.03 0.03 0.04 0.05 0.06 0.02 0.02 0.15 0.02
SO2−4 (mmol/L) 0.48 0.28 0.53 0.50 0.51 0.38 0.19 0.17 0.79 0.59 0.05 0.06 0.07 0.03 Ca2+ (mmol/L) 0.70 0.51 0.56 0.70 0.78 0.47 0.65 0.62 1.85 1.50 0.06 0.18 0.21 0.03 Mg2+ (mmol/L) 0.18 0.12 0.19 0.12 0.13 0.17 0.09 0.09 0.12 0.12 0.02 0.03 0.05 0.02 Na+ (mmol/L) 0.38 0.21 0.22 0.20 0.29 0.26 0.15 0.11 0.22 0.2 0.07 0.08 0.23 0.02 K+ (mmol/L) 0.04 0.04 0.07 0.04 0.04 0.06 0.02 0.03 0.03 0.03 0.04 0.05 0.03 0.02 NO−3 (mmol/L) 0.006 0.019 0.016 0.006 0.006 0.024 0.006 0.006 0.006 0.015 0.035 0.031 0.019 0.000 SO4/Ca 0.69 0.55 0.94 0.71 0.66 0.81 0.29 0.28 0.43 0.39 0.76 0.33 0.32 0.83
Electrical balance % 0.2 −0.8 3.4 −1.6 −4.9 −2.5 −4.6 −3.3 0.0 0.6 3.3 0.8 −5.1 8.57
Calculated values
Fe (mmol/L) 3E-06 4E-06 4E-06 3E-06 3E-06 3E-06 3E-05 4E-06 3E-06 3E-06 1E-06 2E-06 2E-06 4E-4 PCO2 (log(atm)) −2.7 −2.4 −3.2 −3.4 −2.8 −2.3 −3.3 −3.3 −2.8 −3.2 −3.5 −3.3 −3.5 −1.80
Eh (mV/H2) 551 597 460 460 462 457 417 482 542 417 435 478 441 630 SI pyrite −181 −190 −172 −169 −191 −198 −164 −192 −179 −177 −192 −176 −172 −220 SI gypsum −2.1 −2.5 −2.2 −2.1 −2.1 −2.4 −2.5 −2.6 −1.6 −1.8 −4.0 −3.5 −3.4 −4.39 SI calcite −0.9 −1.5 −0.7 −0.5 −0.9 −1.8 −0.3 −0.4 0.3 0.5 −1.9 −1.6 −1.2 −5.60
Inversed values
Pyrite (mmol/L) 0.25 0.12 0.25 0.24 0.24 0.18 0.08 0.08 0.38 0.29 0.013 0.01 0.02
Input
data
for
calculation
Plagioclase (mmol/L) 1.01 0.63 0.69 0.74 0.6 0.67 0.6 0.61 2.7 2.25 0.95 0.18 0.52 Phlogopite + Kmica (mmol/L) 0.04 0.02 0.06 0.03 0.03 0.04 0.02 0.02 0.03 0.03 0.01 0.01 0.01 Calcite (mmol/L) / / / / / / / / −0.7 −1.05 / / / Gibbsite (mmol/L) −1.76 −1.10 −1.20 −1.52 −1.5 −1.2 −1.18 −1.2 −5.3 −5.26 −0.12 −0.32 −0.89 Fe(OH)3(a) (mmol/L) −0.25 −0.12 −0.20 −0.23 −0.2 −0.19 −0.08 −0.1 −0.4 −0.29 −0.01 0 −0.02
O2(g) (mmol/L) 0.97 0.46 0.78 0.88 0.88 0.72 0.31 0.3 1.43 1.07 0.03 0.05 0.05
CO2(g) (mmol/L) 0 0 0 0 0 0 0 0 0 0 0 0 0
Gneiss =6Plag. + Phlo. 1.05 0.65 0.75 0.77 0.63 0.71 0.62 0.63 2.73 2.28 0.96 0.19 0.53 Py/Gneiss (mmol/L) 0.24 0.18 0.33 0.31 0.38 0.254 0.129 0.13 0.14 0.13 0.01354 0.0526 0.038
Dionex DX 100) measurements, the alkalinity (HCO−3 concentration) was obtained using standard titrimetric meth-ods. Detection limits are 0.005 and 0.002 mmol/L for AAS and HPLC tools and the precisions are 5%±1% for AAS, HPLC and alkalinity.
3 Results: field measurements of water quality and correlation with unstabilities
3.1 Analysis of in situ gneiss matrix and fractures walls Gneiss rock is the dominant rock found in both val-leys. The mineralogical composition, of Tin´ee gneiss rock was previously determined by Mazeran and F´eraud (1974) and F´eraud (1975): 66% quartz, 3% Biotite, 4% Kmica,
8% Plagioclase solid solution with 70% of Anorthite and 30% of Albite. The global mineralogical composition of the Rosone gneiss rock described in Amatruda et al. (2004) ap-pears to be similar to the Tin´ee gneiss rock.
Inside cracks, secondary minerals such as pyrite, calcite and amorphous Ferric oxides were found beneath the essen-tial primary minerals forming the gneiss rock found every-where else.
Granular deposits 2m 2 m
Fe, O
O, Al, Si, Mg, K, Ca, S,
(a) Cross section (b) sample 1 (c) sample 2
Sliding direction
Fracture activated by the sliding Fracture inactive
Sample 2 Sample 1
W E
[image:6.595.98.496.64.181.2]S, Fe
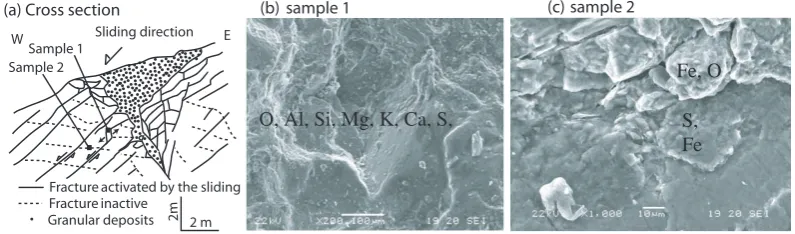
Fig. 2. Localization and observations of fracture walls: (a) Localization of fractures in a cross-section with sliding displacements along fracture dipping towards West (b) electronic microscope and micro-probe results in an active (dipping west, sample 1) fracture and (c) in an inactive (dipping Est, sample 2) fracture covered with a thin ferric layer.
3.2 Water chemistry composition
3.2.1 Dependent on geological formations
The water (four samples) from the soil has a 580– 650 mV/H2 redox value and the bicarbonate concentration is 0.1 mmol/L±0,01. The calculated log of the CO2pressures ranges from−1.7 to−1.9. Average values are presented in Table 2.
The water from gneiss rock (quartz, biotite, Kmica, pla-gioclase and pyrite) is characterised by low Mg2+ concen-trations, (0.02 to 0.18 mmol/L) low electric conductivity (<500µS/cm), and strongly variable SO24− concentrations (0.03 to 0.79 mmol/L, Table 2).
The water collected from downstream Triassic-Jurassic formations is characterised by high SO24− concentra-tion (>1 mmol/L, “Mont Mounier” downhill springs and S15, Fig. 3a insert), high electrical conductivi-ties (>500µSiemens/cm) and high Mg2+concentrations (>1.5 mmol/L). This suggests the dissolution of Ca-Mg-SO4 gypsum dolomite Triassic formations (Fig. 1). This applied, for example, to the S15 spring (Table 3). This variability was already described in a previous study (Guglielmi et al., 2000; Binet et al., 2007b). Such water interacted supposedly with limestones, gypsum and pyrite.
Figure 3 presents the SO4versus Ca concentration ratios of the Tin´ee (Fig. 3a) and the Rosone slope (Fig. 3b) springs. The data presented are dependent on geological and geomor-phological conditions. In both valleys, the water from gneiss rock type are characterised by a constant SO4/Ca ratio of 0.2– 0.3. Triassic rock presents a ratio of 1, but with an offset of around 0.8 mmol/L of calcium for 0 mmol/L of sulfate. Wa-ter flowing through Triassic rocks is, thus, characWa-terised by a ratio of 1 with high concentrations in calcium and sulfate. A ratio smaller than 0.1 corresponds to the glacial deposit types, which was only observed in the Rosone slope.
3.2.2 Dependent on stable/unstable zones
In the Tin´ee valley, the ”La Clapi`ere” (S15, S5, S6), “Noyere”, “Pra” and “Saubieras” springs drain from cur-rently unstable areas (displacements of >1 mm/year, gray shaded in Fig. 1). The three Rosone slope springs, 14, Berto-dasco 5 and Perrebella 4, are known to be located in the mov-ing zone (Fig. 1b, (Amatruda et al., 2004)). The SO4/Ca concentration ratios of all these waters from unstable slopes are higher than 0.5 (big circles in Fig. 1), contrary to all wa-ter from stable zones (Fig. 3). This single paramewa-ter allows the discrimination of moving versus non-moving zones. This means that the ground movements correlates with excess sul-fate concentrations in the water compared to calcium. 3.2.3 Dependent on landslide motion
Table 3. Temporal variability of water quality recorded on the S15 springs draining the la Clapi`ere landslide. Calculated values of the saturation index (SI) and inversed values of the amount of dissolved minerals (positive values means dissolution, negative values means precipitation, inversed O2values exceed the saturation limit, this means that the system is open for oxygen).
Spring S15
Sample ID S15(0) S15(1) S15(2) S15(3) S15(4) S15(5) S15(6) S15(7) S15(8) S15(9)
Sampling date 04.96 12.98 05.99 07.00 02.01 04.01 11.01 06.02 09.03 04.04
Aquifer type Moving zone: La Clapi`ere landslide
Measured values
Velocity (mm/mo) 1500 36 23 66 1437 1241 35 8 22 21
Rain (mm/mo) / 34 90 158 106 31 24 57 71 72
Yield (l/s) 0.20 0.15 0.10 0.10 0.10 0.10 0.10 0.10 0.10 0.12
Conductivity (µS/cm) 1496 1440 1404 1331 1518 902 1523 1508 1519 1198
Temp (◦C) 11.3 8.2 16.6 20.0 9.7 9.4 9.6 12.1 12.4 9.7
pH 7.2 8.0 7.9 74 81 7.5 8.0 7.7 7.9 8.2
Eh (mV/H2) 515 453
HCO−3 (mmol/L) 2.88 3.64 3.00 1.50 1.72 1.25 3.68 3.72 3.68 2.00
Cl− (mmol/L) 0.09 0.17 0.15 0.13 0.13 0.20 0.12 0.18 0.10 0.13
SO24− (mmol/L) 8.55 6.76 6.24 6.33 7.45 6.34 7.33 7.92 6.27 6.11
Ca2+ (mmol/L) 4.50 5.75 5.95 4.65 6.12 4.42 5.85 6.35 4.50 4.50
Mg2+ (mmol/L) 4.46 2.23 1.98 2.14 2.29 1.98 2.35 2.52 3.22 1.95
Na+ (mmol/L) 0.72 0.99 0.70 0.86 0.81 0.71 0.84 0.84 0.74 0.94
K+ (mmol/L) 0.15 0.15 0.15 0.19 0.22 0.11 0.22 0.19 0.12 0.23
NO−3 (mmol/L) 0.000 0.000 0.000 0.000 0.000 0.003 0.000 0.013 0.011 0.005
SO4/Ca 1.9 1.2 1.1 1.4 1.2 1.4 1.3 1.3 1.4 1.4
Electrical balance % 3.3 0.7 −3.3 −1.2 −3.2 1.8 2.8 2.6 0.0 1.0
Calculated values
Fe (mmol/L) 2E-6 2E-06 8E-06 2E-05 3E-06 4E-06 3E-06 4E-06 4E-06 3E-06
PCO2 (log(atm)) −3.36 −2.75 −2.58 −2.51 −3.22 −2.91 −3.13 −2.50 −3.35 −3.29
Eh (mV/H2) 550 457 552 562 542 566 479 513 525 412
SI pyrite −181 −184 −192 −185 −168 −188 −176 −179 −179 −161
SI gypsum −0.50 −0.49 −0.59 −0.61 −0.49 −0.64 −0.52 −0.48 −0.84 −0.65
SI calcite 0.30 0.77 0.82 −0.10 0.57 −0.55 0.44 0.58 0.53 0.55
Inversed values
Pyrite (mmol/L) 1.57 0.66 1.28 1.27 1.23 1.66 1.80 1.73 1.53 1.50
Gypsum (mmol/L) 4.27 5.73 3.97 3.93 5.33 3.05 3.33 4.03 3.17 2.95
Plagioclase = An70. (mmol/L) 2.10 2.69 1.83 2.43 2.27 1.7 2.4 2.2 2.13 2.7
Phlogopite + Kmica (mmol/L) 0.13 0.13 0.13 0.17 0.2 0.72 0.2 0.17 0.1 0.21
Dolomite (mmol/L) 4.00 1.7 1.57 1.62 1.67 0.13 1.73 1.99 2.91 1.31
Calcite (mmol/L) −0.9 −2.96 −1.15 −2.66 −2.69 0 −0.81 −1.16 −3.13 −1.7
Gibbsite (mmol/L) −3.72 −4.69 −3.25 −4.31 −4.05 −3.84 −4.28 −3.91 −3.73 −4.8
Fe(OH)3(a) (mmol/L) −1.51 −1.83 −1.28 −1.27 −1.23 −1.66 −1.8 −1.73 −1.53 −1.49
O2(g) (mmol/L) 5.62 2.49 4.78 4.77 4.62 6.23 6.75 6.5 5.74 5.62
CO2(g) (mmol/L) 0 0 0 0 0 0 0 0 0 0
Gneiss =6Pla. + Phlo. (mmol/L) 2.13 2.82 1.96 2.6 2.47 2.39 2.6 2.37 2.23 2.91
2 4 6 8
2 4 6
Calcium Sulfate S15 (1-10) S5 (1-6) S6 S7
Luicetta, L(1); L(2) Noyéré
Saubieras
Gallery G(1) Linear correlation LEGEND
Stable zone Moving zone > 1 mm/ year
Water from gneissic rock Water from glacial deposits Water from triassic limestones
11 Perrebella 4 Bertodasco, 5 14 13 9 18 6 3 2 12 Geological context
0 0.4 0.8 1.2 1.6 2.0
Calcium (mmol/L) 0
0.6 1.0
Sulfate (mmol/L)
0 0.1 0.2 0.3 0.4
0 0.04 0.08 0.2 Calcium (mmol/L) Sulfate (mmol/L) 0.4 0.8 0.02 0.06 0.1
(b) DATA FROM ROSONE SLOPE (a) DATA FROM TINEE VALLEY
21 Water from soil
Gallery G(2) 0 S=1 Mounier 20 S= 0.1
S = 0,3
S = 1
[image:8.595.50.283.61.337.2]S= 0.3
Fig. 3. Spatial variability of solute concentration measured in the springs of gneiss rock aquifers: (a) in the Tin´ee valley ( S15 is in an insert) and (b) in the Rosone slope. The symbol form is related to the geological context, the black symbols are related to spring draining a unstable slope.
4 Modelling of water rock interaction 4.1 Modelling working assumptions
Speciation modelling of the rock-water interactions were per-formed with the PHREEQC code and the integrated wateq4f database (Parkust and Appelo, 2004). The model gneiss rock compositions is based on referenced analysis (see previ-ous section), except that Biotite was replaced by Phlogopite, i.e. the end member of the Phlogopite – Siderophillite solid-solution system, as solubility data for the latter compound was not available.
The soil water is considered representing the initial chemi-cal composition of the flowing groundwater (Guglielmi et al., 2002). The mean bicarbonate concentrations of the four sam-ples is 0.1 mmol/L±0.1 (analysis Soil in Table 2) , the pH is 5.5±0,5. In these steep slopes, the soil is poorly developed and soil water represents the initial chemical composition of the flowing groundwater (Guglielmi et al., 2002). Once infil-trated into the deeper fractures, the organic matter is consid-ered entirely degraded and/or outfiltconsid-ered and not being fur-ther supplied. This modelling hypothesis is supported by the oxygenated conditions found in all spring waters (Table 2, Eh data).
Landslide motion
(mm/d)
Motion of the landslide (mm/d)
Sulfate for recession stages (mmol/L)
0 50 100 150 200 250
1995 1996 1997 1998 1999 2000 2001 2002
SO4 (mmol/L) S15(1) S15(4) S15(5) S15(6) S15(7) Landslide acceleration S15(3) S15(2) S15(0) 5 6 7 8 9 Legend : 2003 2004 Sulfate (mmol/L)
Fig. 4. Temporal evolution of the sulfate concentration measured in a spring draining from an active unstable area (La Clapi`ere land-slide). The circles present the whole measurement. The squares present the measurements realized when nitrate concentration is null (recession stage). The sulfates, changed during the recession stage, are related with the landslide velocity (strong accelerations are grey shaded). Sulfate concentration of year 1998 are not ex-ploitable. The S15(1, 2, ...) annotations, refer to complete analysis of the S15 trough time, presented in the Table 3.
In such a system, the gneiss rock dissolution becomes the dominant process. The pH will gradually increase when the primary minerals consume H+ions. The increasing pH leads finally to precipitation of insoluble mineral phases, and espe-cially the precipitation of Al(OH)3 and Fe(OH)3. It can be deduced from Table 1 that seven, two, or respectively one H+ moles are consumed when dissolving one molecular unit of phlogopite, anorthite and albite or Kmica (in considering that Silica is released as silicic acid Si(OH)4, and Al as Al(OH)3). This basis of the hypothesis is inferred from the experi-mental data set, as all spring water have higher pH and higher ion concentrations than the soil water. In concordance to field observations (Fig. 2), Fe-oxide and Al-oxyde precipi-tation will occur. To note that the few OH−ions bound to dissolved Al(OH)−4 and Fe(OH)−4 species are not significant compared to the mass of dissolved OH−ions.
The increase in pH will also lead to a decrease of the PCO2 through the transformation of dissolved CO2 into HCO−3. This mechanism, associated with Ca from the dissolution of primary minerals, may lead to calcite precipitation. Table 2 shows that 2 of the 13 reported springs have calcite satura-tion index≥0.5. The observed calcite in fractures and the other study on hydrochemistry of gneiss rock (Appello and Postma, 1996) indicates that calcite precipitation occurs in these systems and calcite was added as an equilibrium phase in the model.
The presence of pyrite, attested from field observations, is considered to be a source of Fe ions. The oxidation to sulfate and Fe+3, with the associated precipitation of Fe(OH)3is a strongly proton-producing process (Eq. 1)
[image:8.595.310.548.65.165.2]increases the saturation index of calcite, i.e. promotes its precipitation. Concerning pH, the dissolution of the pri-mary minerals increases pH, whereas precipitation of calcite (through deprotonation of HCO−3 ions), Oxidation of pyrite and precipitation of iron oxides decreases the pH. Dissolu-tion of gypsum has no direct effect on pH.
The source and sink terms of individual ions can be out-lined as follows: SO−42is provided from pyrite and gypsum. silica, Al and OH−are finally released from all primary min-erals. On the side of precipitation, calcite binds excess Ca and alkalinity, Fe precipitates as Fe(OH)3, and Al precipi-tates as Al(OH)3. As silica gel and amorphous phases satu-ration index are negatives, and as quartz and phlogopite have low kinetics of precipitation, these minerals can be oversatu-rated.
4.2 Inverse modelling
Dissolved ions in spring water are considered originating from rocks and gazes. The necessary quantities of miner-als and gases to be dissolved in the soil water to obtain the spring water composition, were obtained from inverse mod-elling with PHREEQC, by specifying the measured concen-tration of major ions (Ca, Mg, K, Na, SO4, Cl, NO3, alkalin-ity), pH, temperature (fixed to 8◦C for all conditions) of both, the soil and the target spring water. The minerals considered for dissolution in the water are halite (for Cl), quartz, pla-gioclase, phlogopite, Kmica and pyrite. Minerals considered potentially precipitating dependent on the calculated satura-tion index were calcite, dolomite, ferrihydrite, gibbsite. The model considers CO2and O2as two dissolved phases. The calculated amount of consumed gas will open the discussion about open/close reservoir conditions. The proton balances are involved in these calculations. The calculations are ap-plied to the 6 major springs (13 samples) draining gneiss fractures from the two study valleys (Table 2). The uncer-tainty on the calculated ionic balance, is fixed to 15% be-cause the model is a simplification using only 5 minerals to describe the gneiss rock.
For the S15 spring (10 samples; approximately one per year) the same minerals list are considered, adding dolomite, and gypsum. The modelled amounts of gas and mineral dis-solved needed to reproduce the spring water compositions are reported in Table 3.
The system is considered at the equilibrium, however, the spring water composition is controlled by a continuous dis-solution process. The equilibrium model results represents a momentum analysis of kinetically driven reaction during the transfer of water in the subsurface, which did not arrive at its end.
(a) 5 6 7 8
0.0 0.2 0.4 0.6 0.8
Gneiss 0.4 mmol
Gneiss 0.2 mmol
Gneiss 0.8 mmol
+ 0.1 Pyrite + 0.2 Gyspum
pH
Ca (mmol/L)
Soil water
A/
pH
7.0 7.5 8.0 8.5
2 4 6 8 10 12 14 Pyrite 0.5 mmol Pyrite 1mmol Pyrite 0 mmol Gypsum: 10 mmol
Gypsum: 5 mmol
Gypsum: 0.2 mmol HCO
3 1.8 mmol/L HCO
3 5 mmol/L
S5(3) S5(2) S5(6) S15(9) S15(4) S15(6) S15(1) S15(7) Ca (mmol/L) S15(2) Gneiss 0. 6 mmol
(b)
5 6 7 8
0.0 0.2 0.4 0.6 0.8
Gneiss 0.4 mmol
Gneiss 0.2 mmol
Gneiss 0.8 mmol
+ 0.1 Pyrite + 0.2 Gyspum
pH
Ca (mmol/L)
Soil water
A/
B/
pH
7.0 7.5 8.0 8.5
2 4 6 8 10 12 14 Pyrite 0.5 mmol Pyrite 1mmol Pyrite 0 mmol Gypsum: 10 mmol
Gypsum: 5 mmol
Gypsum: 0.2 mmol HCO
3 1.8 mmol/L HCO
3 5 mmol/L
S5(3) S5(2) S5(6) S15(9) S15(4) S15(6) S15(1) S15(7) Ca (mmol/L) S15(2) Gneiss 0. 6 mmol
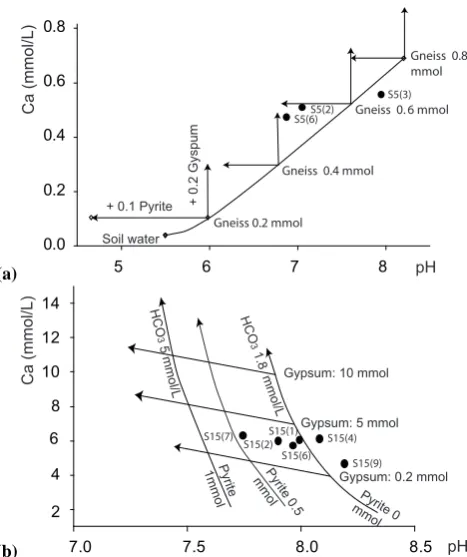
Fig. 5. Calculated evolution of pH and calcium content related to a 0.2 mmol/L sulfate increase in water flowing in gneiss rock and comparison with field measurements. (a) evolution in pH and Ca2+for dissolving gneiss rock (continuously increasing ba-sis curve starting from the soil water), with or without contri-butions from pyrite and gypsum in calcite undersaturation con-ditions. Sulfate increases are induced from either a 0.1 mmol of pyrite, either a 0.2 mmol/L of gypsum dissolution, in a Phl-ogopite + Plagioclase contents fixed to 0.2, 0.4, 0.6, 0.8 mmol/L, in an undersaturated water in respect to calcite. The model is confronted to S5 springs measurements dissolving approximately 0.6 mmol/L of gneiss rock, presented in Table 2. (b) sulfate in-creases are induced from either a 0.1 mmol of pyrite dissolution in gneiss rock, either a 2 mmol/L of gypsum dissolution in gneiss rock buffered context (fixed alkalinity = 1 mmol/L, phlogopite + K-mica + albite + anorthite content = 0.2 mmol/L) in saturated water in respect to calcite. The model is confronted with S15 spring mea-surements presented in Table 3.
4.3 Dominant processes controlling the water quality 4.3.1 Origin of sulfates in silicate system water deduced
from pH buffering processes
[image:9.595.311.545.61.340.2]or from a 0.2 mmol/L of gypsum dissolution, in a Phlo-gopite + Kmica + plagioclase contents, respectively, fixed to 0.2, 0.4, 0.6, 0.8 mmol/L. The dissolution of equivalent amounts of sulfate from pyrite or gypsum results in a de-crease of pH (in the case of pyrite) or in an inde-crease of [Ca2+] (in the case of Gypsum). These different effects al-low us to determine the origin of sulfate (pyrite versus gyp-sum) in the S5 spring. The inversed modelling suggests that S5(2), S5(3) and S5(6) dissolve 0.6 mmol/L of gneiss rock (Table 2). These data plotted in Fig. 5a shows that for fixed amounts of dissolved gneiss rock the spring water pH de-creases with time but not [Ca2+]; more precisely between 0.1 and 0.8 mmol/L of pyrite needs to be dissolved, versus less than 0.1 mmol/L of Gypsum. The observed changes through time in sulfate concentration (S5(2), S5(3) and S5(6)) plotted in Fig. 5 indicate that the sulfate essentially changes origi-nates from pyrite.
The interference between gypsum and pyrite, in calcite saturated conditions observed in the S15 spring, are more complex (Fig. 5b). Dissolved Ca2+will partly contribute to increase [Ca2+], and partly precipitate as calcite, decreasing by the way the alkalinity and the pH (through deprotonation of precipitating HCO−3 ions). In Fig. 5b, Gypsum dissolu-tion curves are thus no longer vertical. Concerning pyrite, the protons released (Eq. 1) will (as for Gypsum) displace the saturation pH of calcite to lower pH values, which means dissolution of calcite. In this case, both [Ca2+] and
alkalin-ity increase, different to Gypsum dissolution. Parts of the protons contribute to lower the pH, and parts contribute to protonate the CO−32ions released to the solution from cal-cite. Thus, pyrite dissolution curves in Fig. 5b have also a negative slope. The S15 spring, saturated with respect to cal-cite, flows through gypsum and calcite. The sulfate content is very high (8 mmol/L). The pH versus Ca plot of the S15 time series (Fig. 5b) shows that 2 to 5 mmol of Gypsum and 0 to 0.5 mmol/L of pyrite contributed to the sulfate measured in the spring. This shows that Gypsum dominantly contributed to the sulfate composition in this case, but pyrite is necessary to explain the recorded time evolution.
4.3.2 O2and CO2conditions, and implications for open/closed model assumption
In the model, the introduced pyrite is entirely oxidized, as an excess oxygen concentration is introduced. This ensures that oxygenated conditions prevail at the spring outlet as ex-perimentally determined (Table 2 and 3). A priori this intro-duced “reactive pyrite” represents only a minor fraction of the FeS minerals existing in the field. Potentially, much more pyrite may be really present, but associated with an insuffi-cient contact time with water and/or surface area. The very low saturation index of the pyrite (from−160 to−200) for a redox reaction confirm that pyrite is controlled by kinetics processes (Stefansson et al., 2005).
Following the pyrite oxidation (Eq. 1), 3.75 oxygen atoms are needed to oxidise two sulphur atoms to sulfate. O2 satu-rated water at 5◦C (Saturation [O
2]aq= 0.4 mmol/L) may thus produce a maximum of 0.21 mmol/L sulfate from pyrite in a closed system. Most of the inversed O2values presented in Table 2 exceed this theoretical value by a factor of one or two. This means that the system is open for oxygen. Some surface oxygen supposedly diffuses into the groundwater, thus, con-tributing to enhance the dissolved oxygen content needed for the oxidation of pyrite. Here, the groundwater flows mainly in the unsaturated zone in contact with gases (Binet et al., 2007b). Hydrogeological context is coherent with an open system. Note that the regular decrease of sulfate (Fig. 4) be-tween 2002 and 2003 may discard a seasonal evolution of O2or CO2pressures or of the temperature that controlled the pyrite oxidation. In other areas, the dissolution of pyrite is insensitive to seasonal changes (Domenech et al., 2002).
PCO2values at the spring outlet (Table 2 and 3) range be-tween−3.32 and−2.7 and are superior to the atmospheric PCO2 pressure (PCO2=10−3.5atm.). In the given system of open fractures, we consider that the system is opened to the atmosphere. This means that CO2(together with oxy-gen) diffuses continuously to the groundwater providing the necessary acid for the neutralization of the base generated through the dissolution of the gneiss rock. This generates the alkalinity (i.e. the HCO−3 concentration) measured at the spring outlet. The Inversed modelling indicates that low CO2 exchanges with the atmosphere occurred. Realized a model without CO2(g), to simulate a closed system do not modify
the calculated solutions presented in Table 2. The soil alka-linity input (0.1 mmol/L) is sufficient to explain the bicarbon-ates evolution with the pH increase, but errors range caused by the alkalinity measurements (±0.1) do not enable to ex-clude possible CO2exchanges with the atmosphere.
More importantly, this shows that respiration processes observed in soil, did not occur in the open fractures as these processes are known to disturb the groundwater PCO2 val-ues compared to the atmospheric pressure. This indicates that the organic matter of soil water was effectively outfil-tered and/or entirely respirated into the soil before flowing through the fractures.
4.4 Pyrite availability in unstable areas
The dissolved amount of pyrite normed to the gneiss rock amount (Py/Gn) is an indicator of the relative pyrite weath-ering rate. (Table 2 and 3). The Py/Gn ratio range from 0.04 to 0.13 in a stable aquifer and from 0.16 to 0.74 in unstable aquifers. The significant difference in the relative Py/Gn ra-tio suggests that the relative weathering rate of the pyrite is higher in the active fractures.
5 Discussion
5.1 Relationship between physical erosion and chemical weathering
SO4time evolution could originate from a mix process, with water from a pyrite rich reservoir. However, the other ions in the water are not correlated with the accelerations. When the sulfate concentrations decrease, the Mg, Cl, Ca and HCO3 concentrations can increase (for example see S15(7) and S15(8) in Table 3) or can decrease (see S15(0) and S15(1)). Thus, the mix process between water from the landslide and a sulfate-rich water can be reasonably discarded.
To discuss the origin of SO4time evolution requires tak-ing into account an internal modification of the dissolution rate of the pyrite correlated with landslide velocity. Within the fractures, the crystalline rock materials were found to be covered by iron oxide coatings (Fig. 2c) inferred weathered. Sulfate anomalies were observed in all the water flowing through active landslides in the two study valleys (Fig. 3). These sulfate increases were observed after 5 landslide ac-celerations, and indicate that a mechanical deformation can (re) activate sulfate production. Thus, a mechanical effect can refresh the surfaces, reinitialize the dissolution or create new fresh fractures (Fig. 2b). This mechanical effect can be linked to mechanical deformation of the slope, characterised in these valleys by complex progressive failure propagation (Barla and Chiriotti, 1996).
During laboratory experiments of pyrite leaching, it appears that the dissolution rate decreases with time (Williamson and Rimstidt, 1994; Igarashi et al., 2003; Weisener et al., 2003). With time, the aging of mineral decreases the contact surface and the original behaviour of pyrite dissolution cannot be re-established (Jerz and Rim-stidt, 2004). For instance, with a 10 year observation scale, modifications of the groundwater chemistry in an acid moor-land in the Welsh Upmoor-lands is attributed to a decrease in the weathering rate of pyrite (Forti et al., 1996). On the other side, at the continental scale, a theoretical model cou-pling chemical weathering and physical erosion in landslide-dominated landscapes is proposed to explain the refreshment of the weathering rate (Gabet, 2007). Here, long-term de-crease of the weathering rate and the theoretical refreshment are suggested at the landslide scale.
5.2 Implication for landslide management
A comparison of the weathering rates shows the possibility to localize current unstable areas with instantaneous measure-ments. This method enables us to demonstrate the presence of a current unstable zones in the catchment. In these un-stable mountainous contexts, the catchments of subsurface flows are localized. The water infiltrates in the upper part of open fractures and a part of it discharges downhill from the bottom of these fractures (Binet et al., 2007). By perform-ing samplperform-ing very close to the potential unstable area, it is possible to deduce if the sampled zone is moving or not.
If a potentially unstable slope is monitored, water chem-istry is like a syn-deformation signal that can be used to recorded the fracture growing or the sliding evolution. With time, the fracture growing can lead to a catastrophic rupture (Scavia, 1995) and water chemistry can be a help to the pre-diction of this catastrophic rupture.
Stable zones record a 0.13 to 0.4 Py/Gn ratio. In the mov-ing zones, Py/Gn ratio ranges between 0.16 to 0.74. Consid-ering error range in the weathConsid-ering rate values, a 0.15 value can be considered as a threshold value to discriminate be-tween stable and unstable area. This ratio is establish from two different alpine valleys (Tin´ee and Rosone). Extrapolate this ratio for other slopes means that the water/rock interac-tion surfaces and the weathering state in the stable areas are similar. Such hypothesis can be tested using a well-know stable aquifer before testing the potentially unstable zones.
In the toppled area of the S5 spring, the two high ratios of the relative weathering rates of pyrite (0.4 for 1998 and 2004) suggest that the two last accelerations of the La Clapi`ere landslide (1997 and 2000) have affected the entire hillslope. In this area, mm/year displacements are estimated by stabil-ity calculations (Guglielmi et al., 2005). The hydrochemi-cal signature is produced even from slow (mm/year) and low magnitude (toppling) deformations.
The accelerations and the ruptures in the rock deformation have a very short time scale (form a second to a day).The changes in chemical signature of groundwater are related to transport of water (from a day to months in these subsurface context). If the dissolution rate is changed, it will take some time for sulfate to reach a new steady state concentration. No experimental data is available about the refreshed rates of pyrite. Figure 4 suggests that the changes in transport delay and in the dissolution rates take from 1 to 6 month to reach the spring.
6 Conclusions
Wet chemical analysis, from the Orco and the Tin´ee val-leys (Western Italy and Southern France) were performed. Some of these springs drain currently active gravitational slope deformations. The groundwater sulfate concentrations increased from 0.1 to 1 mmol/L in the weeks following ma-jor displacement periods of a landslide. This study shows that unstable areas may potentially be detected by associating major ions analysis to inverse modelling of chemical equilib-ria: the calculation of the dissolved pyrite to dissolved gneiss rock ratio allows an unambiguous determination of the wa-ter flowing through unstable zones. Here, gneiss rock and gypsum are the principal dissolving compound, and pyrite is the minor compound, which is rapidly dissolved, and con-sequently increasingly present in case its reactive surface is “refreshed” through the movement of rock masses. The discrimination of stable and unstable areas is possible even in the case of slow (mm/year) and low magnitude defor-mations. This result opens an interesting perspective for a cost-effective follow-up of sliding or friction dynamics in the landslides or in the seismic and aseismic faults.
Acknowledgements. This work was supported by the RETINA project, the French INSU SAMOA project and the Franco Italian University. We sincerely thank the CETE of Nice and the Arpa of Torino for their collaborations. A part of this work was realized in the Mercantour National Parc, under authorization of the direction. The authors sincerely thank Pr Olivier Fabbri and the anonymous referees for their constructive comments. This work could not have been achieved without the technical support of Maguerite Goetghebeur and Bruno Regent. Grazie mille!
Edited by: A. Guadagnini
The publication of this article is financed by CNRS-INSU.
References
Appelo, C. A. J. and Postma, D.: Geochemistry, groundwater and pollution, Book A. A. Balkema, Rotterdam, 1996.
Agliardi, F., Crosta, G., and Zanchi, A.: Structural constraints on deep-seated slope deformation kinematics, Eng. Geol., 59, 83– 102, 1996.
Amatruda, G., Campus, S., Castelli, M., Piane, L., Forlatti, F., Morelli, M., Paro, L., Piana, F., Pirulli, M., Ramasco, M., and Scavia, C.: Identification And Mitigation Of Large Landslide Risks In Europe: Advances In Risk Assessment, edited by: Bon-nard, Ch., Forlati, F., and Scavia, C., A. A. Balkema, Imiriland project, Torino, 2004
Binet, S., Mudry, J., Scavia, C., Campus, S., Bertrand, C., and Guglielmi, Y.: In situ characterization of flows in a fractured un-stable slope, Geomorphology, 86, 193–203, 2007a.
Binet, S., Guglielmi, Y., Bertrand, C., and Mudry, J.: Unstable rock slope hydrogeology: insights from the large-scale study of the western Argentera-Mercantour hillslopes (South-Eastern France), B. Soc. Geol. Fr., 178, 159–168, 2007b.
Binet, S., Jomard, H., Lebourg, T., Guglielmi, Y., Tric, E., Bertrand, C., and Mudry, J.: Experimental analysis of groundwater flow through a landslide slip surface using natural and artificial water chemical tracers, Hydrol. Process., 21, 3463–3672, 2007c. Barla, G. and Chiriotti, E.: Insights into the behaviour of the Large
Deep Seat Gravitational Slope Deformation of Rosone, in the Piemont Region (Italy), Int. J. Rock Mech. Min., 33, 242–242, 1996.
Bonzanigo, L., Eberhart, E., and Loew, S.: Hydromechanical fac-tors controlling the crfeeping Campo Vallemaggia, in: Sympo-sium of landslides, causes, impacts and countermeasures, edited by: UEF, Davos, 13–22, 2001.
Cappa, F., Guglielmi, Y., Soukatchoff, V. M., Mudry, J., Bertrand, C., and Charmoille, A.: Hydromechanical modelling of a large moving rock slope inferred from slope levelling coupled to spring long-term hydrochemical monitoring: example of the La Clapiere landslide (Southern Alps, France), J. Hydrol., 291, 67– 90, 2004.
Casson, B., Delacourt, C., Baratoux, D., and Allemand, P.: Sev-enteen years of the “La Clapiere” landslide evolution analyzed from ortho-rectified aerial photographs, Eng. Geol., 68, 123–139, 2003.
Domenech, C., De Pablo, J., and Ayora, C.: Oxidative dissolution of pyritic sludge from the Aznalcollar mine (SW Spain), Chem. Geol., 190, 339–353, 2002.
Faure-Muret, A.: Etude g´eologique sur le massif de l’Argentera Mercantour et ses enveloppes s´edimentaires: M´emoire `a l’explication de la carte g´eologique d´etaill´ee, Thesis Paris, Mem.serv. Carte geol, France (ed), 336, 1955.
F´eraud, J., Picot, P., Pierrot R., and Vernet, J.: M´etallog´enie: sur la d´ecouverte de scheelite, cassit´erite, bismuthinite et molyd´enite dans les gˆıtes `a ars´enopyrite du massif de l’Argentera, Cons´equences m´etallog´en´etiques et p´etrog´en´etiques, Comptes Rendus de l’Acad´emie des sciences, Paris, 280, 2179–2182, 1975.
Follacci, J. P.: Les mouvements du versant de la Clapi`ere `a Saint Etienne de Tin´ee (Alpes Maritimes), Bulletin des Laboratoires des Ponts et Chauss´ees, 150, 107–109, 1987.
Forlati, F., Gioda G., and Scavia, C.: Finite element analysis of a deep-seated slope deformation, Rock Mech. Rock Eng., 34, 135–159, 2001.
Forti, M. C., Neal, C., and Robson, A. J.: Modelling the long-term changes in stream, soil and ground water chemistry for an acid moorland in the Welsh uplands: the influence of variations in chemical weathering, Sci. Total Environ., 180, 187–200, 1996. Gabet, E. J.: A theoretical model coupling chemical weathering
and physical erosion in landslide-dominated landscapes, Earth Planet. Sc. Lett., 264, 259–265, 2007.
France), J. Hydrol., 229, 138–148, 2000.
Guglielmi, Y., Vengeon, J., Bertrand, C., Mudry, J., Follacci, J., and Giraud, A.: Hydrogeochemistry: an investigation tool to evalu-ate infiltration into large moving rock masses (case study of the La Clapi`ere and S´echilienne alpine landslides), Bull. Eng. Geol. Env., 61, 311–324, 2002.
Guglielmi, Y., Cappa, F., and Binet, S.: Coupling between hydro-geology and deformation of mountainous rock slopes: Insights from La Clapiere area (southern Alps, France), C. R. Geosci., 337, 1154–1163, 2005.
Gunzburger, Y. and Laumonier, B.: A tectonic origin for the fold un-derlying the Clapiere landslide (NW Argentera-Mercantour mas-sif, Southern Alps, France) deduced from an analysis of frac-tures, C. R. Geosci., 334, 415–422, 2002.
Igarashi, T., Hataya, R., and Oyama, T.: Estimation of pyrite oxida-tion rate by sulfate ion discharged from a catchment, J. Geochem. Explor., 77, 151–165, 2003.
Jerz, J. K. and Rimstidt, J. D.: Pyrite oxidation in moist air, Geochim. Cosmochim. Ac., 68, 701–714, 2004.
Julian, M. and Anthony, E.: Aspects of landslide activity in the Mercantour Massif and the French Riviera, southeastern France, Geomorphology, 15, 275–289, 1996.
Keefer, D., Wilson, R. C., Mark, R. K., Brabb, E. E., Browm, W. M., Ellen, S. D., Harp, E. L., Wieczorek, G. F., Alger, C. S., and Zatkin, R. S.: Real-Time Landslide Warning During Heavy Rainfall, Science, 13, 921–925, 1987.
Mazeran, R. and F´eraud, J.: Sur la thermoluminescence des quartz filoniens `a BPGC du massif de l’Argentera, Mise en ´evidence du caract`ere polyphas´e de ces min´eralisations, Comptes Rendus de l’Acad´emie des sciences, Paris, 278, 1147–1150, 1974. Mudry, J.: Chemical mass flow vs. discharge and the functioning of
karst aquifers, J. Hydrol., 120, 283–294, 1990.
Parkust, D. L. and Appelo, C. A. J.: PhreeQC2 user’s manuel and programm. Water-Resources Investigations Report, edited by: US Geological Survey, 2004.
Scavia, C.: A method for the study of crack propagation in rock structures, G´eotechnique, 45, 447–463, 1995.
Stefansson, A., Arnorsson, S., and Sveinbjornsdottir, A. E.: Re-dox reactions and potentials in natural waters at disequilibrium, Chem. Geol., 221, 289–311, 2005.
Tullen, P.: M´ethodes d’analyses du fonctionnement hy-drog´eologique des versant instables, PhD Thesis, ed. EPFL, Lausanne, 2002.
Vengeon, J. M.: D´eformation et rupture des versants en terrain metamorphique anisotrope, Apport de l’´etude des ruines de S´echilienne, PhD Thesis, ed. University of Grenoble 1, Greno-ble, 1998.
Weisener, C. G., Smart, R. S. T. C., and Gerson, A. R.: Kinetics and mechanisms of the leaching of low Fe sphalerite, Geochim. Cosmochim. Ac., 67, 823–830, 2003.