Abstract— This paper proposes a support vector machine
(SVM)-based technique for data classification and estimation. The correlation between insulator leakage current and weather conditions was used to establish classifier models for estimating insulator leakage current. This study adopted a remote monitoring system installed in two transmission towers, Tower 51 (161 kV) on Sihu First Road and Tower 4 (69kV) at Lunbei Line, Qiao Cun, which are located on the key lines in the heavily salt-fog-polluted regions of Yunlin, Taiwan. This system monitors the power lines and the damages caused by salt-fog pollution, and combines meteorological data with insulator leakage current data and spark discharge images collected through automatic monitoring. These data were employed in a multivariate linear regression analysis to identify the correlation between leakage current and weather conditions. Various meteorological parameters were used to construct regression models for determining the parameters imposing the greatest influence on leakage current. Subsequently, the proposed SVM classifiers were employed to combine various meteorological parameters with leakage current parameters generated by insulators of dissimilar specifications. Finally, the optimal parameter combination for classifying leakage current was determined, thus verifying the applicability and effectiveness of the leakage current classifier models proposed in this study.
Index Term— Insulator leakage current, multivariate linear regression analysis, salt fog damage, support vector machine (SVM)
I. INTRODUCTION
In humid environments, salt-fog pollution moistens the surface of insulators, which produces ionized salt pollutants that reduce insulation capabilities, thereby increasing the amount of leakage current and ultimately causing ground discharge event, a phenomenon known as pollution flashover [1]–[4]. The leakage current of insulators is the byproduct of voltage, climate, and pollutants (salt deposit density) and can objectively reflect the entire process of surface contamination on insulators to the generation of a flashover.
To prevent flashovers caused by the presence of salt pollutants on overhead power lines, power companies must periodically clean insulators during power line maintenance to restore the insulation capabilities of insulators and thereby
This work was supported in part by the Taiwan Power Company , Taiwan, R.O.C. under project with TPC-546-4835-9901.
M.Y. Cho and P.S. Lin are with the Department of Electrical Engineering, National Kaohsiung University of Applied Sciences, Kaohsiung 807 Taiwan, R.O.C. (e-mail:[email protected] and [email protected]).
reducing leakage current. The most commonly adopted technique for assessing contamination on insulator surfaces is the equivalent salt deposit density (ESDD) [5]–[7], after which maintenance workers must be dispatched to transmission towers at night to observe, record, and analyze patterns and sounds of electrostatic discharge on the surface of insulators. The data are then used to establish maintenance mechanisms for both live-line and offline insulator cleaning. Generally, in times of infrequent salt-fog pollution, power companies measure the ESDD of transmission tower insulators once a month; by contrast, in the event of salt-fog pollution, such measurement is conducted once a week. However, the data collected during monthly or weekly ESDD tests are scarce compared with those collected during hourly leakage current measurements. Consequently, accurate correlation between ESDD and the leakage current of tower insulators cannot be determined easily [8].
Jahromi et al. [9] manually conducted an iterative voltage increment test in a laboratory to acquire various leakage current data. Subsequently, they established the correlation between leakage current and ESDD by using an artificial neural network (ANN) algorithm, which was then applied to estimate and monitor the conditions of transformer substations. Du and Zhu [10] manually sprayed salts and insoluble substances on an insulator surface in a laboratory and increased the voltage of the insulator to generate leakage current. Next, they used a support vector machine (SVM) multiclassification method to estimate the level of leakage current and verified the applicability of SVM models to estimating and classifying leakage current. Shuai and Gong [11] analyzed meteorological information (temperature, relative humidity, wind speed, atmospheric pressure, and precipitation) and ESDD data, using a least squares support vector machine (LS-SVM) to train prediction models. Their results verified that the LS-SVM is applicable to estimating the ESDD values of an insulator through meteorological parameters.
Previous studies on insulator leakage current have mostly involved a laboratory setting in which the correlation between leakage current and ESDD is manually tested and analyzed. Various methods have been applied to estimate leakage current and ESDD, such as the SVM method, online measurements associated with magnetic interference problems, or systems with no remote monitoring feature. No studies have verified the correlation of leakage current with ESDD and meteorological data, and few studies have used meteorological data for classifying leakage current. Previously, the authors of the
Using Support Vector Machine for Classifying
Insulator Leakage Current
present study [8] designed and developed a remote system for monitoring power transmission lines and salt-fog pollution. This system was installed in two transmission towers, Tower 51 (161 kV) on Sihu First Road, Beigang and Tower 4 (69kV) at Lunbei Line, Qiao Cun, which are located on the key lines in the heavily salt-fog-polluted regions of Yunlin, Taiwan. This online measurement system is based on an embedded system and enables collecting and integrating meteorological data, measuring insulator leakage current online, and establishing leakage current and meteorological parameters (Fig. 1). In the current study, meteorological (temperature, humidity, wind direction, wind speed, sunshine, precipitation, and dew point) and leakage current data collected using the remote monitoring system were used in a multivariate regression model to analyze the correlation between the meteorological parameters and leakage current. Furthermore, an SVM classification and identification technique was applied to construct models for classifying insulator leakage current. The results of this study can serve as references for determining whether insulators require cleaning and thereby increasing maintenance efficiency.
Tower #1
Telecommunications base stations
Overhead line towers
Tower #2
Tower #3 HSDPA
(3.5 G) Internet
TCP / IP Monitoring center
DAQ station
DAQ station
DAQ station
Fig. 1. System architecture diagram
II. REMOTESYSTEMFORMONITORINGSALT-FOG
POLLUTION
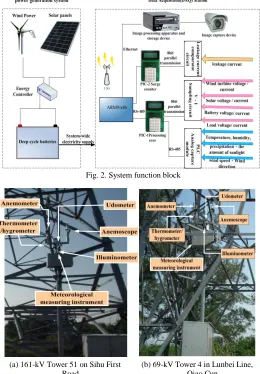
As shown in Fig. 2 [8], the data acquisition (DAQ) station installed in each tower comprises an integrated wind/solar power generation system, meteorological parameter measuring device (temperature, humidity, precipitation, sunshine, wind speed and direction, and dew point), image capturing device, 3.5 G wireless communication system, and insulator leakage current measuring unit. Furthermore, the core of the monitoring system comprises a high-grade ARM9 embedded system for linking each hardware component and the wind/solar power generation system. The captured videos and data (such as leakage current measurement) are transmitted to a back-end monitoring center through the general packet radio service (3.5 G) wireless communication device of the high-grade ARM9 micro processing embedded system.
A. Installation of On-site Tower Measuring Devices
Figs. 3 (a) and (b) illustrate the meteorological parameter measuring devices installed in the two transmission towers, Tower 51 (161 kV) on Sihu First Road, Beigang, and Tower 4 (69kV) at Lunbei Line, Qiao Cun. These two devices have been operational since 2013. Fig. 4 illustrates an insulator leakage current measuring device equipped with ceramic current
closure rings coated with B25-silicon grease. To analyze the characteristics of the leakage current produced from various types of insulators, four types of insulators commonly installed in transmission towers were employed in this study: ceramic insulators coated with a permanent room temperature vulcanized coating (PRTV-B25), ceramic insulators coated with a high-voltage insulator coating (HVIC-B25), ceramic insulators coated with silicon grease (SI-B25), and polymeric insulators.
Fig. 2. System function block
Fig. 3. Weather measuring devices installed on the tower.
Fig. 4. Installation of SI-B52 closure rings. (a) 161-kV Tower 51 on Sihu First
Road
(b) 69-kV Tower 4 in Lunbei Line, Qiao Cun
B. Measurement of Meteorological Parameters
The meteorological data (temperature, humidity, dew point, precipitation, sunshine, wind direction, and wind speed) collected using the meteorological measuring devices over a 5-month period were used in statistical analyses. Meteorological data collected in 1-min intervals were employed to calculate the arithmetic mean of each meteorological parameter, which was then compared with that reported by the Taiwan Central Weather Bureau. The result revealed that the difference between the collected data and those of the Central Weather Bureau was less than 5%, verifying the accuracy of the meteorological measuring devices. The definition and calculation of dew point are described below.
Dew point, or dew-point temperature, is defined as the temperature at which ambient water vapor condenses at a constant atmospheric pressure.
Dew point is correlated with relative humidity, a common humidity index. Under high relative humidity conditions, dew point approximates temperature. When relative humidity reaches 100%, dew point equals temperature. Relative humidity and temperature are inversely correlated. Therefore, when the relative humidity and actual temperature are known, dew point can be estimated as follows:
T RH
RH T b Td
, ,
(1)
where γ is obtained as shown in (2):
100 ln
, RH
T b
aT RH T
(2)
where temperature T and dew point Td are expressed in Celsius, relative humidity RH is expressed in percentage, ln represents natural logarithm, and a =17.27 and b = 237.7 °C
This equation is based on the Magnus-Tetens approximation, in which the saturation vapor pressure is a function of temperature. This method is applicable to only the following conditions: of 0 °C < T < 60 °C, 1% < RH < 100% and 0 °C <
Td <50 °C.
C. Insulator Leakage Current Measurement
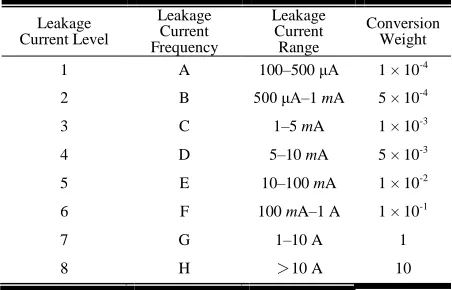
The closure rings used in this study were composed of stainless steel. After a leakage current signal is obtained, a voltage divider circuit converts the signal into a voltage signal, which is then categorized by a comparator circuit into one of eight levels (Level 1: 100–500 μA; Level 2: 500 μA–1 mA; Level 3: 1–5 mA; Level 4: 5–10 mA; Level 5: 10–100 mA; Level 6: 100 mA–1 A; Level 7: 1–10 A; and Level 8: >10 A). Next, an RS-485 communication interface in the ARM9 embedded system was used to transmit the data of the measured leakage current.
III. CORRELATIONBETWEENINSULATORLEAKAGE
CURRENTANDRELATEDFACTORS
Leakage current data were analyzed using SPSS statistical software to identify factors influencing leakage current and the correlations among these factors. The factors analyzed were the variations in the meteorological parameters measured at the transmission tower sites. Because various factors (temperature, humidity, wind direction, wind speed, sunshine, precipitation,
and dew point) were involved, multivariate statistical analysis was employed to establish parameter regression lines. The meteorological parameters were considered independent variables and the leakage current values were used as the dependent variable. The leakage current values were calculated according to the eight leakage current levels by summing the amount of leakage current in each level during each period based on different weights. The calculated numerical value is a characteristic of the leakage current within a period. Overall, applying the aforementioned data and methods yield regression lines representing leakage current and meteorological parameters; the analytical architecture is illustrated in Fig. 5. After the correlation between the meteorological parameters and leakage current was established, the most highly correlated meteorological parameters were incorporated into the SVM models to construct an insulator leakage current classifier model.
Fig. 5. Flowchart of data analysis.
To facilitate analyzing the relationship between the changes in the leakage current and meteorological parameters, the leakage current values were converted into eigenvalues (TABLE
I). The leakage current values collected through the remote monitoring system were recorded as surges, and each surge was assigned into one of the eight levels. Consequently, the converted eigenvalues can be viewed as the total current per unit time. The conversion equation is described in (4).
TABLEI
WEIGHTSFORCONVERTINGLEAKAGECURRENT Leakage
Current Level
Leakage Current Frequency
Leakage Current Range
Conversion Weight 1 A 100–500 μA 1 × 10⁻⁴ 2 B 500 μA–1 mA 5 × 10⁻⁴
3 C 1–5 mA 1 × 10⁻³
4 D 5–10 mA 5 × 10⁻³
5 E 10–100 mA 1 × 10⁻²
1 10 1 10 1 1010 5 10 1 10 5 10 1 1 2 3 3 4 4 H G F E D C B A
(4)
Because seven independent variables were examined in this study, multiple linear regression analysis was applied to investigate the effect of the meteorological factors on insulator leakage current. As shown in (5), this regression method is suitable for exploring the relationship between a dependent variable and numerous independent variables.
k
kX
X
Y 1 1... (5)
First, regression analyses were conducted separately by using pairs of meteorological parameters as the independent variables, and the two parameters with the highest coefficient of determination (R2) value were coupled with another meteorological parameter, forming a combination comprising three parameters. Through this method, the number of
meteorological parameters in the regression model was gradually increased, yielding multiple regression models. According to TABLE II showing the results of the regression analyses conducted by pairing the various parameters, the combination comprising humidity and precipitation has the highest R2 value (0.456).
Next, humidity and precipitation were used as the main parameters and were each coupled with other meteorological parameters, forming a group of three parameters (TABLES III and IV). The results revealed that the combination of humidity, precipitation, and wind speed exhibited the highest R2 value (0.485).
Finally, the combination of humidity, precipitation, and wind speed was coupled with each remaining parameter to conduct regression analyses involving four independent variables. The results (TABLE V)showed that the combination including either temperature or dew point has the highest R2 value (0.489).
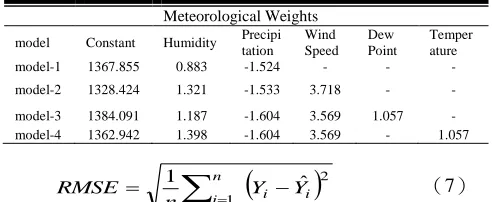
Table VI shows a summary of the four regression models constructed according to the mentioned method. The root mean square error (RMSE) (7) and Theil's U inequality coefficient (8) were used to assess the effectiveness of the regression models. The RMSE is typically used to measure the residual distribution of a model, and a low RMSE value indicates favorable prediction performance. The Theil’s U method evaluates the effectiveness of a model in predicting dependent variables. A Theil’s U value less than 0.55 indicates an effective model. However, this method can be used to determine only the applicability of a model.
2 1 ˆ 1 i i ni Y Y
n
RMSE
(7)
TABLEII
METEOROLOGICAL PARAMETER FIT
Temper ature Humidi ty Wind Direct ion Wind Speed Sun Shine Precipit-ation Dew Point Tempe
rature - 0.051 0.051 0.065 0.058 0.384 0.051 Humid
ity 0.051 - 0.022 0.032 0.009 *0.456 0.051 Wind
Directi on
0.051 0.022 - 0.022 0.015 0.383 0.023
Wind
Speed 0.065 0.032 0.022 - 0.008 0.384 0.017 Sunshi
ne 0.058 0.009 0.015 0.008 - 0.384 0.017 Precip
itation 0.384 *0.456 0.383 0.384 0.384 - 0.423 Dew
Point 0.051 0.051 0.023 0.017 0.017 0.423 -
TABLEIII
METEOROLOGICALPARAMETERFITWITHPRECIPITATIONASTHE MAINPARAMETER Tempera ture/Prec ipitation Humidit y/Precipi tation Wind Directio n/Precipi tation Wind Speed/Pr ecipitati on Sunshine /Precipit ation Dew Point/Pr ecipitati on Tempe
rature - 0.463 0.384 0.384 0.384 0.463 Humid
ity 0.463 - 0.457 *0.485 0.468 0.463 Wind
Directi on
0.384 0.457 - 0.384 0.384 0.427
Wind
Speed 0.384 *0.485 0.384 - 0.384 0.423 Sunshi
ne 0.384 0.468 0.384 0.384 - 0.426 Dew
Point 0.463 0.463 0.427 0.423 0.426 -
TABLEIV
METEOROLOGICALPARAMETERFITWITHHUMIDITYASTHEMAIN PARAMETER Tempera ture/Hu midity Wind Directio n/Humid ify Wind Speed/H umidity Sunshine /Humidif y Precipita tion/Hu midity Dew Point/Hu midify Tempe
rature - 0.052 0.082 0.063 0.463 0.051 Wind
Directi on
0.052 - 0.054 0.023 0.457 0.052
Wind
Speed 0.082 0.054 - 0.033 *0.485 0.082 Sunshi
ne 0.063 0.023 0.033 - 0.468 0.063 Precipi
tation 0.463 0.457 *0.485 0.468 - 0.463 Dew
Point 0.051 0.052 0.082 0.063 0.463 -
TABLE V
METEOROLOGICAL PARAMETER FIT WITH
HUMIDITY/PRECIPITATION/WIND SPEED AS THE MAIN PARAMETERS
Temperature Direction Wind Sunshine Dew Point Humidity/Precipitation
/Wind Speed *0.489 0.485 0.488 *0.489
TABLE VI
FOUR TYPES OF LEAKAGE CURRENT AND METEOROLOGICAL PARAMETER REGRESSION MODELS
Meteorological Weights
model Constant Humidity Precipi tation Wind Speed Dew Point Temper ature model-1 1367.855 0.883 -1.524 - - - model-2 1328.424 1.321 -1.533 3.718 - - model-3 1384.091 1.187 -1.604 3.569 1.057 - model-4 1362.942 1.398 -1.604 3.569 - 1.057
n
i i
n
i i
n
i i i
Y n Y n
Y Y n sU
Theil
1 2 1
2 1
2
1 1
ˆ 1
' (8)
where n is the number of samples, Yi is the actual leakage current eigenvalue, Yˆiis the value predicted by the regression model
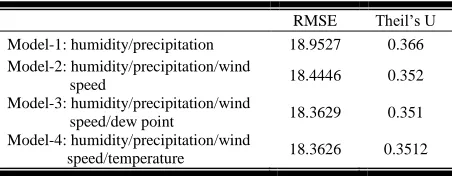
Table VII shows a summary of the four combination models. The results revealed that the Theil’s U values were less than 0.55, indicating that the models are applicable to estimating the leakage current values. The RMSE value of Model-1 was higher than those of the other models, implying that the data points of the model were widely spread from its regression line. Model-2 exhibited the second-highest RMSE value, whereas the RMSE of Model-3 and Model-4 differed slightly by 0.01 and converged. However, this result cannot confirm that Model-3 is the primary factor affecting insulator leakage current. Therefore, in addition to the four parameter combinations developed in the multiple regression analysis test, additional parameter combinations were formulated to construct classifier models for determining the optimal combination associated with the highest classification accuracy.
IV. USINGSVMFORCONSTRUCTINGANINSULATOR
LEKAGECURRENTCLASSIFIER
A. Principles of SVM
SVM model was developed by Vapnik and Chervonkis [13] according to the Vapnik Chervonenks dimension theory and structural risk minimization inductive principle. This model is widely applied to various domains including facial recognition, data mining, bioinformatics, and grapheme classification [12], [13].
SVMs are developed from optimal classification planes under a linearly separable condition. An SVM classifier identifies a hyperplane between two classes of data and separates the data. The distance between the point at which a hyperplane is nearest to a data point is called a margin. A large margin is preferable because the training data in an SVM can be separated distinctly. When additional unclassified data are input into an SVM, the optimal hyperplane of the SVM can be used to characterize the attributes of these data. Therefore, identifying the optimal hyperplane is essential for constructing an SVM. The data point closest to the optimal hyperplane is called a support vector.
The on-site meteorological data and leakage current level
data were used as the samples for training the SVM classifiers. Because these two sets of data were nonlinearly correlated, a nonlinear regression approach was applied. The theoretical concept of the approach is described as follows [14]–[16]:
A set of data points is defined as
G
{[ , ( )]}
x f x
i in
i
,where xi is the input vector, f(xi) represents the target value, and
n denotes the number of sample data. The fundamental concept of a support vector regression method is to map a datum x to a high-dimensional feature space, in which a linear regression is conducted:
(9)
where w is the weight vector representing the flatness of f(x)
in the high-dimensional feature space. The Euclidean norm
2
w
can be used to assess the flatness of f(x). Hence,w
2can be regarded as the complexity of a model. In addition, b is the bias value, and
is the high-dimensional feature space, in which x is nonlinearly mapped to the target value. Because
is constant, the minimumw
2value must be determined to obtain a flat f(x). Equation (10) represents the regularized risk function. Minimizing (10) yields the estimated coefficients ofw and b.
(10)
where ξi and ξi* are slack variables, ε is an insensitive loss function,
i,
i are Lagrangian multipliers, and( ,
i j)
( )
i( )
jK x x
x
x
is the kernel function. The constraints are defined as follows:(11)
where C is the regularized constant (i.e., the margin parameter). This equation can be simplified to (12):
1
(
) ( )
l
i i i
i
w
x
(12)Finally, the optimal hyperplane can be obtained as follows:
(13)
where SV is the support vector. Next, the following nonlinear classifier function can be obtained:
( )
( )
f x
w
x
b
:
R
nF w
,
F
(
, )
0
i i i
SV
y K x x
b
1
(
)
0
0
,
,
1, 2,
,
l
i i
i
i i
C
i
l
TABLE VII
EFFECTIVENESS OF THE REGRESSION MODELS RMSE Theil’s U Model-1: humidity/precipitation 18.9527 0.366 Model-2: humidity/precipitation/wind
speed 18.4446 0.352 Model-3: humidity/precipitation/wind
speed/dew point 18.3629 0.351 Model-4: humidity/precipitation/wind
speed/temperature 18.3626 0.3512 , , ,
1 1
1 1
1
max ( ,
)
(
)(
) ( , )
2
(
)
(
)
l l
i i j j i j
w b
i j
l l
i i i i i
i i
w
K x x
y
(14)
Equation (14) represents the SVM function, where xi represents the input vector,
idenotes the SV, andy
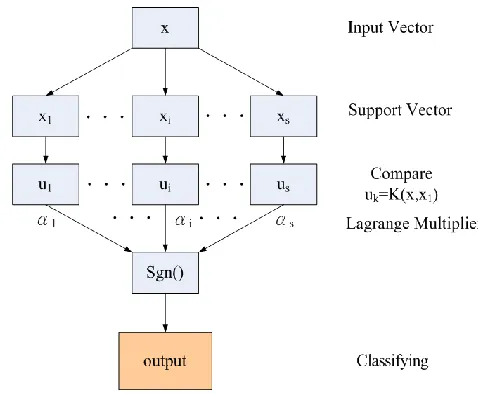
iis the output target vector (1 or –1).B. Construction of Insulator Leakage Current Classifier
Fig. 6. Architecture of an SVM classifier.
Fig. 6 illustrates the architecture of the SVM classifiers developed in this study. The local meteorological data and leakage current data acquired from the remote monitoring systems installed in the two transmission towers were used as the training data set.
1)Input vectors: humidity, temperature, precipitation, wind speed, dew point
2)Support vector: composed of hourly leakage current levels 3)Kernel function: Gaussian function, which is used for the
support vector regression
a) The Gaussian kernel function is a radial basis function:
,
exp
2
,
0
i j
j
i
x
x
x
x
K
(15)b) The equations of the optimal hyperplane and nonlinear classifier are shown in (13) and (14), respectively. Equations (13), (14), and (15) can be used to solve w (weight value), b (bias value), and
i(SV). Next, these values can be entered into the classifier to acquire the output target vector yi, which is the classification result for the leakage current level.The classifiers were trained using a one-against-rest method. If the leakage current is divided into n levels, n
classifiers must be trained accordingly. The training method involves classifying Level 1 leakage current into one category and the remaining levels into another category. Subsequently, the Level 2 leakage current was classified into one category and
the remaining levels into another category. These procedures were repeated until all eight classifiers were trained; the data collected were screened before employing them as the training samples and as test data in the SVM classification system for determining which leakage current levels occur under which weather conditions. The training process is detailed as follows:
1)The data were screened before applying them as training sample sets.
2)The screened data were normalized ([0,1] or [-1,1]). 3)The normalized data were entered into the SVMs for the
model training.
4)Step 3 was repeated until n classifiers were trained. 5)Approximately 20 data sets were selected for the
one-against-rest classification training. This step is referred to as cross-validation, which can prevent overtraining the models.
6)Step 5 was repeated until n classifiers underwent the cross-validation, and the trained classifier model was saved.
Next, the trained classifier models were used to classify the leakage current data. Fig. 7 illustrates the flowchart of the classification process, in which eight classifiers were used (SVM-1–SVM-8). After a datum is inputted into a classifier (e.g., SVM-1), the classifier assigns either a +1, indicating that the datum belongs to the Level 1 leakage current, or –1, indicating that the datum belongs to another level. When a datum is classified as –1, the classification using SVM-2 commences. Similarly, if the datum is classified as –1, classification using SVM-3 proceeds; this process continues until the datum is assigned to a level.
Fig. 7. Flowchart for classifying leakage current.
sgn
i i( , )
iSV
y
y K x x
b
V. TESTRESULTSANDANALYSIS A. Data Collection and Analysis
The leakage current and meteorological parameter data collected from the installation sites of the 69-kV and 161-kV towers were analyzed. The insulators installed on the towers had identical specifications (Table VIII). Hourly leakage current and meteorological data were continually collected from April to June 2013. Because a large amount of data were collected, only the hourly data obtained on April 1 are presented in this paper as an example (Table IX). Table IX indicates that the levels of leakage current measured on April 1 mostly range between Levels 1 and 2 and that several leakage current measurements did not reach Level 1. This is because salt-fog pollution is not intense in April and because it rains often during April, thus cleaning the insulators’ surfaces. Therefore, leakage current of Level 3 or higher rarely occurred during this period.
TABLE VIII TYPES OF INSULATOR
Types of Insulator
Abbreviations Used in this
Paper
Code
PRTV-coated insulator-B25 PRTV-B25 A
HVIC-coated insulator-B25 HVIC-B25 B
Silicon-greased-coated insulator-B25 SI-B25 C
Polymeric insulator Polymer D
TABLE IX
HOURLY LEAKAGE CURRENT AND METEOROLOGICAL INFORMATION OF THE 69-KV TOWER ON APRIL 1, 2013
- Insulator Type Meteorological Parameter
A B C D
Humidity Temperature Wind Speed Precipitation Dew Point Time Leakage Current Level
0 0 1 1 1 94.847 20.6 1.62 2.302 19.569 1 1 1 1 1 95.799 16.3 0 1.459 15.459 2 1 1 1 1 95.171 16.5 0 0.761 15.534 3 1 1 1 0 96.582 16.5 1.3 0.439 15.816 4 1 1 1 0 94.618 20.3 1.825 0.834 19.248 5 1 1 1 0 93.290 20.3 1.5 0.3 19.016 6 1 1 1 0 90.416 20 0 0.2 18.351 7 1 1 1 0 88.644 20.4 0.8083 0.2 18.128 8 1 1 1 0 85.960 20.8 1.0667 0.3 18.017 9 1 1 1 0 83.953 21.4 1.4833 0.2 18.198 10 1 1 1 0 79.051 21.9 1.0833 0.2 17.743 11 0 0 0 0 81.506 23.5 1.0833 0.2 18.484 12 0 0 0 0 79.081 23.2 0.8083 0.1 17.782 13 0 0 0 0 76.151 22.6 1 0.2 17.896 14 1 1 1 0 77.573 22.3 1.5917 0.2 19.072 15 0 0 0 0 78.676 22.1 1.7917 0.2 19.951 16 0 1 0 0 81.488 22.1 2.4083 0.2 20.264 17 1 1 0 0 82.327 21.2 2.1417 0 19.715 18 1 1 0 0 84.898 20.9 1.1083 0.2 19.671 19 1 2 1 1 86.407 20.6 0 0 19.631 20 1 3 1 1 89.629 16.3 0 0 20.100 21 1 2 1 1 90.914 16.5 1.2833 0.1 20.307 22 1 2 1 1 91.775 16.5 0.9917 0 19.638 23 1 2 1 1 93.814 20.3 1.4833 0.1 19.754
B. Test Results of the Leakage Current and Meteorological Classifier
Four insulator types were installed on each of the two
transmission towers. Hence, the data collected from each type of insulator were used to train four separate SVM classifiers. Because the data were collected during a salt-fog-pollution-free period when frequent rainfall occurs, several insulators did not produce leakage current. Therefore, only the insulators that had generated leakage current were analyzed using the classifier models. The number of meteorological parameters entered into the models ranged from 2 to 4, and dissimilar parameter combinations were used to construct the models. The cost (C) and γ (gamma) values obtained from the parameter combinations were evaluated, and the accuracy of the model in terms of training and classification was examined. Table X shows the meteorological parameter combinations used to construct the models.
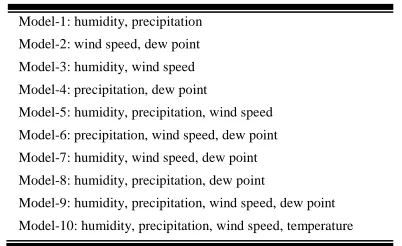
TABLE X
METEOROLOGICAL PARAMETER COMBINATIONS OF THE CLASSIFIER MODELS
Model-1: humidity, precipitation Model-2: wind speed, dew point Model-3: humidity, wind speed Model-4: precipitation, dew point Model-5: humidity, precipitation, wind speed Model-6: precipitation, wind speed, dew point Model-7: humidity, wind speed, dew point Model-8: humidity, precipitation, dew point
Model-9: humidity, precipitation, wind speed, dew point Model-10: humidity, precipitation, wind speed, temperature
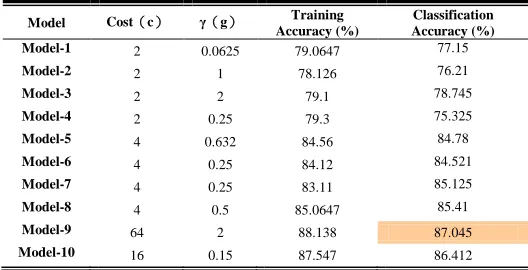
Table XI shows the effectiveness of the SVM classifiers trained using the data of the PRTV-B25 insulators. Model-1 to Model-4 included two meteorological parameters and each of these models exhibited low training accuracy (approximately 79%), suggesting that using two meteorological parameters is insufficient for categorizing leakage current. Model-5 to Model-8 comprised an additional parameter and distinct parameter combinations and each model demonstrated a training accuracy of approximately 84%. Finally, incorporating four meteorological parameters into Model-9 and Model-10 yielded high training accuracy in the range 87%–88%, with Model-9 being more accurate than Model-10.
TABLE XI
SVM CLASSIFIER MODELS TRAINED UNDER DISTINCT METEOROLOGICAL CONDITIONS AND PRTV-B25 LEAKAGE
CURRENT DATA
Model Cost(c) γ(g) Training Accuracy (%)
Classification Accuracy (%) Model-1 2 0.0625 79.0647 77.15
Model-2 2 1 78.126 76.21
Model-3 2 2 79.1 78.745
Model-4 2 0.25 79.3 75.325
Model-5 4 0.632 84.56 84.78
Model-6 4 0.25 84.12 84.521
Model-7 4 0.25 83.11 85.125
Model-8 4 0.5 85.0647 85.41
Model-9 64 2 88.138 87.045
Model-10 16 0.15 87.547 86.412
accuracy levels of Model-1 to Model-4 were similar to those of the corresponding classifier models trained using the PRTV-B25 data. Adding an additional parameter increased the accuracy of the HVIC-B25 classifier models to approximately 84%. For Model-9, the training accuracy was 87%. Subsequently, Model-9 and Model-10 were employed for classification estimation; in reality, classification error is produced but at a low frequency because similar weather conditions occur when Levels 1 and 2 leakage current is generated. Nevertheless, the classification of Model-9 was more accurate than was Model-10.
TABLE XII
SVM CLASSIFIER MODELS TRAINED UNDER DISSIMILAR METEOROLOGICAL CONDITIONS AND HVIC-B25 LEAKAGE
CURRENT DATA
Model Cost(c) γ(g) Training Accuracy (%)
Classification Accuracy (%) Model-1 2 0.313 81.32 79.51
Model-2 2 0.5 79.872 78.413
Model-3 2.65 2 80.22 79.01
Model-4 4 16 79.21 77.26
Model-5 16 12.235 84.3418 85.774
Model-6 16 5 85.874 84.21
Model-7 16.54 5.12 84.55 84.685
Model-8 18.35 625 84.2911 85.16
Model-9 128.6 0.0016 87.6544 87.078 Model-10 125 0.15 87.158 85.854
TABLE XIII
SVM CLASSIFIER MODELS TRAINED UNDER DISSIMILAR METEOROLOGICAL CONDITIONS AND SI-B25 LEAKAGE CURRENT DATA
Model Cost(c) γ(g) Training Accuracy (%)
Classification Accuracy (%) Model-1 2 0.0625 79.0647 77.15
Model-2 2 1 78.126 76.21
Model-3 2 2 79.1 78.745
Model-4 2 0.25 79.3 75.325
Model-5 4 0.632 84.56 84.78
Model-6 4 0.25 84.12 84.521
Model-7 4 0.25 83.11 85.125
Model-8 4 0.5 85.0647 85.41
Model-9 64 2 88.138 87.045 Model-10 16 0.15 87.547 86.412
Table XIII shows the effectiveness of the SVM classifiers trained using the data of the SI-B25 insulators. The leakage current produced by these insulators during April–June were mainly Level 1 or Level 2. When two meteorological parameters were applied, the training accuracy of the models was approximately 74%. When four meteorological parameters were incorporated, the training accuracy of Model-9 and Model-10 increased and approximated one another.
Table XIV shows the performance of the SVM classifiers trained using the data of the polymeric insulators. The surface of polymeric insulators is generally clean because of their water-repellent property. Examining the leakage current data shows that the polymeric insulators generated Levels 1 and 2 leakage current. The training accuracy levels of Model-1 to Model-4 were similar to those of the SI-B25 classifier models
(mean of approximately 75%). Incorporating three meteorological parameters into the models increased the training accuracy to 80%. Finally, Model-9 and Model-10 incorporating four meteorological parameters demonstrated an increase in training accuracy and their classification accuracy was 85%.
TABLE XIV
SVM CLASSIFIERS MODELS TRAINED UNDER VARIOUS METEOROLOGICAL CONDITIONS AND POLYMERIC INSULATOR
LEAKAGE CURRENT DATA
Model Cost(c) γ(g) Training Accuracy (%)
Classification Accuracy (%) Model-1 3.2 0.0313 76.83 72.26
Model-2 2.36 1 74.218 73.48
Model-3 4 2 75.51 75.284
Model-4 2.125 2.3 74.31 72.87
Model-5 2 16 80.2185 80.54
Model-6 2.55 4.14 79.63 80.413
Model-7 2.65 8.3 80.452 78.38
Model-8 3.21 4.38 81.383 83.15
Model-9 0.125 0.0156 86.872 85.62 Model-10 1.265 2.874 85.158 85.36
VI. CONCLUSION
This study examined the effects of seven meteorological parameters on the leakage current of insulators installed in two transmission towers. The four insulator types commonly used by the Taiwan Power Company were selected for this study: PRTV-B25, HVIC-B25, SI-B25, and polymeric insulators. Statistical analyses including RMSE and Theil’s U confirmed that humidity, precipitation, temperature, dew point, and wind speed were the essential factors affecting insulator leakage current.
When four meteorological parameters were applied to classify insulator leakage current, the training accuracy of the classifier models ranged between 85% and 87%. Compared with other models, Model-9 (in which humidity, precipitation, wind speed, and dew point were inputted) classified the levels of leakage current more accurately. The results verified the meteorological factors influencing insulator leakage current as well as the effectiveness and applicability of the proposed leakage current classifiers. In future, meteorological data provided by the Taiwan Central Weather Bureau can be used to classify and predict the levels of leakage current in insulators. By using the classifier proposed in this study, maintenance personnel could simply classify the level of one of the series of insulators installed in the transmission tower, and determine which insulator requires particular attention and whether insulator cleaning should be administered.
VII. ACKNOWLEDGMENT
REFERENCES
[1] De La, A.; Gorur, R.S. Flashover of contaminated non-ceramic out-door insulators in a wet atmosphere. IEEE Trans. Dielectr. Electr. Insul., 5, pp. 814–823, 1998.
[2] R. J. Van Brunt, ―Physics and chemistry of partial discharge and corona—recent advances and future challenges,‖ IEEE Trans. Dielectr. Electr. Insul., vol. 1, no. 5, pp. 761–784, Oct. 1994.
[3] D. L. Williams et al., ―Formation and characterization of dry bands in clean fog on polluted insulators,‖ IEEE Trans. Dielectr. Electr. Insul., vol. 6, no. 5, pp. 724–731, Oct. 1999.
[4] G. Montoya, I. Ramirez, and J. I. Montoya, ―Correlation among ESDD, NSDD and leakage current in distribution insulators,‖ Proc. Inst. Elect. Eng., Gen., Transm. Distrib., vol. 151, no. 3, pp. 334–340, May 2004. [5] An, L.; Jiang, X.; Han, Z. Measurements of equivalent salt deposit density
(ESDD) on a suspension insulator. IEEE Trans. Dielectr. Electr. Insul., 9, pp. 562–568, 2002.
[6] G. Montoya, I. Ramirez, and J. I. Montoya, ―Correlation among ESDD,NSDD and leakage current in distribution insulators,‖ in Proc. Inst.Elect. Eng., Gen., Transm. Distrib., vol. 151, no. 3, pp.334–340, May 2004.
[7] H. Matsuo, T. Fujishima, and T. Yamashita, ―Relation between leakage impedance and equivalent salt deposit density on an insulator under a saltwater spray,‖ IEEE Trans. Dielectr. Electr. Insul., vol. 6, no. 1, pp.117–121, Feb. 1999.
[8] M. Y. Cho, T, F, Lee, W.Y. Chang, T. T. Liau, J.J. Liang, System establish and research of remote monitoring technology of transmission line in the polluted salt fogand climate, Final report, Taipower, 2013. [9] Ail Naderian Jahromi, Ayman H. EI-Han, Shesha H. Jayaram, Edward A.
Cherney, M. Sanaye-Pasand, Hosein Mohseni,―A Neural Network Based Method for Leakage Current Prediction of Polymeric Insulators,‖IEEE Trans. on Power Delivery, vol. 21, no. 1, pp.506-507, JANUARY 2006. [10] Nian Du, Yongli Zhu,―Neighborhood based SVM multi-classification method for Condition Assessment of Insulator,‖IEEE Computational Intelligence and Design, pp.310-313, OCTOBER 2011.
[11] Haiyan Shuai, Qingwu Gong,―Insulator ESDD Forecasting under Complex Climate Conditions on the Basis of LSSVM,‖IEEE Intelligent Data Acquisition and Advanced Computing Systems: Technology and Applications, pp.313-317, SEPTERBER 2009.
[12] V. Vapnik and A. Lerner, ―Pattern recognition using generalized portrain method,‖ Automation and Remote Control, 24, pp.709-715, 1963. [13] Vapnik and A. Chervonkis, ―A note on one class of perceptrons,‖
Automation and Remote Control, 25, pp.838-845, 1964.
[14] Yuanping.Ni, ―One Intelligent Method for Fault Diagnosis and Its Application,‖ IEEE Trans. Power Deliv, pp755-758,2000.
[15] J.R.Huang,‖Using Support Vector Machine to Category Images Variation for the Image Query,‖20,July 2004(Thesis for the Degree of Master). [16] Kuan-yu,Chen, ―Application of Support Vector Regression in
Forecasting International Tourism Demand,‖ Tourism Management Research Vol.4 No.1, pp.81~97,Jine 2004.
Ming-Yuan Cho is with the Department of Electrical Engineering, National Kaohsiung University of Applied Sciences (KUAS), where he is currently a distinguished professor associated with the Dean of College of Electrical Engineering and Computer Science at KUAS. He has also served as the chairman of Department of Electrical Engineering at KUAS from August, 2000 to July, 2003. His research interests are smart grid, energy saving technologies and artificial intelligent algorithm for power system applications.
Pou-Sz Lin was born in Yunlin, Taiwan, on June 10, 1970. He obtained the M.S. degree in electrical engineering from National Taiwan University of Science and Tecnology in 1997. He is currently pursuing the Ph.D. degree at National Kaohsiung University of Applied Sciences in Taiwan. His research interests are artificial intelligent algorithm and digital image processing tecnology for power system applications.