R E S E A R C H
Open Access
Adaptive swarm cluster-based dynamic
multi-objective synthetic minority
oversampling technique algorithm for
tackling binary imbalanced datasets in
biomedical data classification
Jinyan Li
1†, Simon Fong
1†, Yunsick Sung
2, Kyungeun Cho
3, Raymond Wong
4and Kelvin K. L. Wong
5,6** Correspondence:
[email protected] †Equal contributors
5
Centre for Biomedical Engineering, School of Electrical & Electronic Engineering, University of Adelaide, Adelaide, Australia
6
School of Medicine, Western Sydney University, Campbelltown, Sydney, Australia
Full list of author information is available at the end of the article
Abstract
Background:An imbalanced dataset is defined as a training dataset that has imbalanced proportions of data in both interesting and uninteresting classes. Often in biomedical applications, samples from the stimulating class are rare in a population, such as medical anomalies, positive clinical tests, and particular diseases. Although the target samples in the primitive dataset are small in number, the induction of a classification model over such training data leads to poor prediction performance due to insufficient training from the minority class.
Results: In this paper, we use a novel class-balancing method named adaptive swarm cluster-based dynamic multi-objective synthetic minority oversampling technique (ASCB_DmSMOTE) to solve this imbalanced dataset problem, which is common in biomedical applications. The proposed method combines under-sampling and over-under-sampling into a swarm optimisation algorithm. It adaptively selects suitable parameters for the rebalancing algorithm to find the best solution. Compared with the other versions of the SMOTE algorithm, significant improvements, which include higher accuracy and credibility, are observed with ASCB_DmSMOTE.
Conclusions: Our proposed method tactfully combines two rebalancing techniques together. It reasonably re-allocates the majority class in the details and dynamically optimises the two parameters of SMOTE to synthesise a
reasonable scale of minority class for each clustered sub-imbalanced dataset. The proposed methods ultimately overcome other conventional methods and attains higher credibility with even greater accuracy of the classification model.
Keywords: Imbalanced dataset, Swarm optimisation, Under-sampling, SMOTE, Dynamic Multi-objective, Classification, Biomedical data
Background
Machine learning plays an important role in knowledge discovery and automatic recognition in biomedical applications. Specifically, classification is a machine learning technique that integrates the complex relationships between the input var-iables and the target classes of some biomedical data. Automatic pattern recogni-tion and predicrecogni-tion are then possible with the learnt model when unseen data are tested. Machine learning from biomedical data encounters several difficulties, mainly because these datasets are characterised by incompleteness (missing values), incorrectness (collection error or noise in the data), inexactness (data retrieved from incorrect sources) and sparseness (too few records available). Another subtle problem that transcends the integrity of the data is an imbalanced class distribu-tion; that is, there are too few target data that the users are interested in amongst too much ordinary data collected. For instance, some decision support systems in health care applications deal with patient data that include very few positive re-cords in a large population, especially for new diseases. Other examples are cancer genes in microarrays [1], abnormal sub-sequences in biosignal patterns [2], tiny cysts in mammograms of the biological imaging field [3] and the colony distribu-tion and mutadistribu-tion of E. coli or yeast [4, 5], in addition to classification in the bio-medical engineering field [6], etc.
The imbalanced dataset problem is known to cause pseudo-accuracy – a spuri-ously good prediction rate with low credibility. A classification model that is learnt from a majority of mediocre data becomes biased towards the majority class and less sensitive to recognition of the minority class samples [7]. Testing this classifier with the same training dataset shows a high prediction accuracy on the surface. However, when the model is tested with new unseen samples of the minority class, the accuracy rate plummets, which indicates that the falsely high accuracy of the training model is futile and unreliable.
The current approach of rebalancing the imbalanced dataset is to simply inflate the population of the minority class by randomly copying its data or shrinking the amount of majority class data until they match the population of the other class. This approach works by matching the populations of the classes merely in quantity. And when it comes to repeated experiment for more than ten times, this approach ignores the subtle underlying mappings between the input variables and the target classes, which can be highly nonlinear. In a nutshell, adjusting the quantity of data from each class to the same level does not guarantee generation of the most effective classifier. The methods used to attain a balanced dataset such as the aforementioned over-sampling [8] and under-over-sampling [9], both of which change the numbers of two clas-ses’samples. These methods are at the data level. Furthermore, there also exist some techniques at the algorithm level to overcome the imbalanced problem in classifica-tion. Cost-sensitive learning [10] is a commonly used method in which distinct weights are dispatched to the two classes to pressurise the classifier to the minority class. Boosting methods [11, 12] include many weak classifiers to obtain a strong clas-sifier to avoid the imbalance problem. All combinations of class distributions were attempted with a support vector machine (SVM) as a performance measure [13].
effective method to rebalance the original dataset and conquer the imbalance prob-lem. Its basic idea is to allow the algorithm to fabricate extra minority data into the dataset by observing and assessing the characteristics of the minority class sample’s spatial structure. We assume an over-sampling rate of N (equation (1) synthesises N times new minority class samples) and each minority class sample xi ∈Sminority. The other parameter k is used by the algorithm to examine k neighbours of xi in the minority class samples, and then to randomly select xt from the k neighbours by using equation (1) to generate the synthetic data xnew [15]:
xnew¼xiþðxt−xiÞ vrand; ð1Þ
where vrandis a random number between 0 and 1, and Nandkare the two important
parameters of this algorithm that are used to generate the suitable number and charac-teristic samples of the minority class.
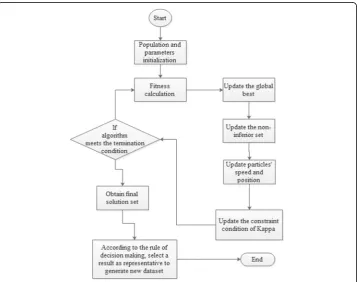
We adopt particle swarm optimization (PSO) [16] to search for optimal values for the pair of parameters for SMOTE. PSO is a widely used meta-heuristic algorithm that imitates the feeding process of birds. Assuming a population X= (X1, X2,…, Xn) that is grouped by nparticles in a Ddimensional search space, theithparticle in this space is expressed as a vectorXiwithDdimension,Xi= (xi1,xi2,…,xiD)T, and the pos-ition of theithparticle in the search space represents a potential solution that is coded as a combination of the parameters values of Kand S for SMOTE. As an objective function, the program can calculate the corresponding fitness of position Xi of each particle, where the speed of the ith particle is Vi= (Vi1,Vi2, …,ViD)T, the extremum value of each agent isPi= (Pi1,Pi2,…,PiD)Tand the extremum of the population isPg = (Pg1, Pg2, …, PgD)T. During the process of iteration, the extremum values of each agent and the population will update their positions and speeds. Equations (2) and (3) show the mathematical process as follows:
Vidtþ1¼ ωVt
idþ c1r1 Ptid−Xtid
þ c2r2 Ptgd−Xtid
; ð2Þ
Xidtþ1¼Xt
idþ Vidtþ1: ð3Þ
In Equation (2), ω is the inertial weight; d= 1, 2, …, D; i= 1, 2, …, n; t is the current iteration time; c1 and c2 are non-negative constants as the velocity factor, r1 andr2 are random values between 0 to 1 and Vid is the particle speed.
Methods
In classification, especially classification of a flawed dataset, the only indicator of accuracy is not persuasive. Even though it may be sharp, the results will still lead to misleading judgments and testing. The supplementary parameters used to meas-ure and distinguish the classification model of imbalanced datasets are receiver operating characteristic area [17], F-measure (abbreviated as F-1) [18] and G-mean [19]. In this paper, we collect the F-measure and G-mean as our reference parame-ters. The Kappa statistic [20] is another favourable assessment index used to effect-ively estimate the credibility of the classification model. In the imbalanced dataset’s classification, the low Kappa value accompanied a high level of accuracy because most classification algorithms neglected the minority class samples and misclassi-fied them in the majority class. The target class commonly takes a very small percentage in quantity; thus the number of misclassified minority class samples produces a low error rate. As a result, the precision of the trained model will encounter a serious crisis of confidence when it meets multiple target class sam-ples in a testing dataset. However, the low Kappa statistic will directly present the credibility of the classification.
For this reason, the second objective of Kappa is implemented in our experiment to intuitively and objectively represent the consistency of the results and the reli-ability of classification. The theoretical range of Kappa is between −1 and 1. There are six intervals or degrees of interpretation of a Kappa outcome from −1 to 1 [21]: Kappa < 0, less than chance agreement; 0.01≤Kappa≤0.20, slight agreement; 0.21≤Kappa≤0.40, fair agreement; 0.41≤Kappa≤0.60, moderate agreement; 0.61≤ Kappa≤0.80, substantial agreement; 0.81≤Kappa≤1.00, almost perfect agreement. In our previous papers [22, 23], we adopted the other interpretation for Kappa to split the area into four parts with values of 0, 0.4 and 0.75, which respectively pre-sented the meaning of meaningless, low credibility, general credibility and strong credibility. In our experiment, we have mentioned that in order to guarantee the precision and credibility of the classification mode, both accuracy and the Kappa value were our targets, which caused dynamic changes in the values. The optimisa-tion algorithm is Swarm, the intelligence algorithm is PSO, and the assistant verifi-cation algorithm is Neural Network, which will cooperate with each other to find two suitable and best parameters (N of over-sampling rate and k neighbours) of SMOTE to synthesise the minority samples and the variation in the class distribu-tion to remit the imbalance problem. Equadistribu-tions (4) and (5) are our fitness functions, which are calculated from the confusion matrix.
Accuracy ¼T PþT N
PþN ; ð4Þ
Kappa¼Po−Pc
1−Pc ; ð5Þ
Po¼Accuracy¼
T PþT N
Pc¼
T PþFP
ð Þ ðT PþFNÞ þðFNþT NÞ ðFPþT NÞ PþN
ð Þ2 : ð7Þ
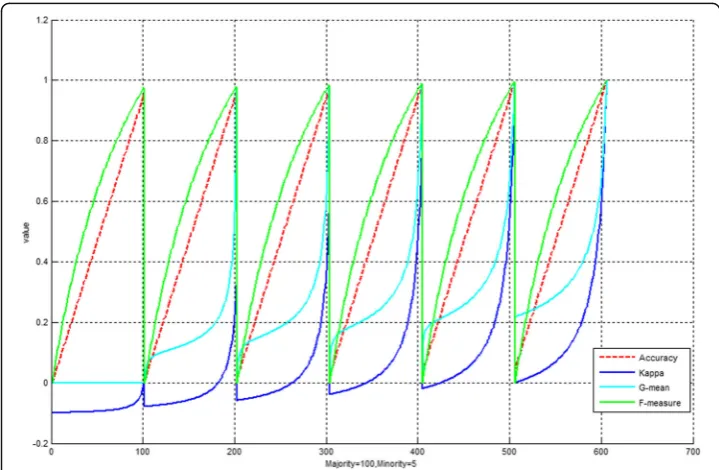
Note that TP, TN, FP, and FN, respectively represent true positive, true negative, false positive and false negative. P stands for positive and N for negative. Po and Pc are the measures of the percentage of agreement and the chance of agreement respectively. Neural Network is used to estimate and verify the fitness of each iter-ation of the PSO. Figure 3 presents a snapshot of the fluctuiter-ation patterns of accur-acy and kappa as the transformation progress (from TP = 0, TN = 0, FP = 100, FN = 5 to TP = 100, TN = 5, FP = 0, FN = 0) of a confusion matrix in an imbalanced data-set classification model, G-mean and F-measure as the auxiliary metrics. In this example, there are 100 majority class samples and 5 minority class samples. At the 606th cycle of iterations, accuracy and Kappa both have reached a very high value of approximately 1. Since the two objectives are not opposing each other, a special type of optimization called the non-inferior set tactics [24] is adopted here and customized for this specific rebalancing task. Furthermore, it shows Kappa is more sensitive than the commonly used metrics of G-mean and F-measure to judge the bias of the imbalanced classification model from the confusion matrix.
The classification results are evaluated by different training and testing parts. We perform a tenfold cross validation [25, 26] to test the corresponding performance of the current dataset classification model. That means the dataset randomly is divided into ten parts averagely, and each part will take turns being the testing dataset with the other nine parts as training datasets in the repeated ten times’classifications. The Kappa, Accuracy, G-mean and other performances of this cross-validation process are averaged from these ten classifications. Moreover, to keep the fairness of the experi-ment, each dataset tested Random SMOTE, SRA and proposed methods separately ten times, and the final results pertain to the mean value of the experiments.
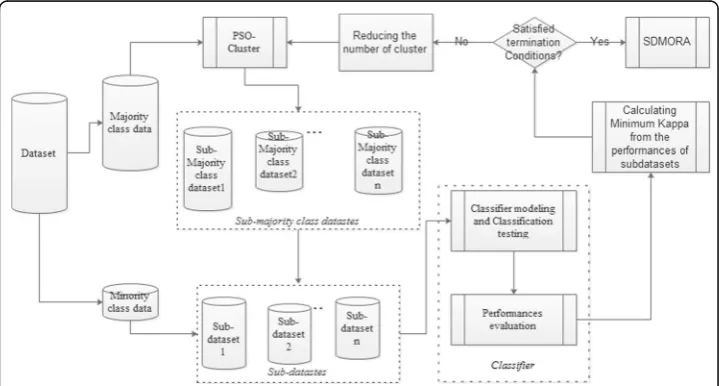
The reason for combining cluster under-sampling and over-sampling lies in the detailed grouping of the majority dataset. For instance, if the intelligent medical
diagnostic system only records and divides the collected data into two classes -gastric cancer data and other data, then there is no doubt that non-cancer cases comprise the vast majority of the whole. These samples contain many different situations, such as gastritis, gastric ulcer, gastric peroration and healthy. Hence, the cluster of non-cancer data can include more detailed illness diagnoses and narrow the imbalance ratio of the original dataset. As under-sampling and over-sampling, the proposed algorithm can be divided into two parts. Figure 1 shows the principle diagram of this algorithm, and this paper also provides the pseudo code in the below to describe the operation process.
In the first part, the dataset is divided into majority class data and minority class data, which will be processed respectively. PSO optimized k-means clusters algo-rithm [27] the majority class into several categories as a strategy, and each sub-majority class dataset is combined with the minority class dataset to establish the corresponding sub-dataset, which will be reprocessed by the second part to perform over-sampling separately. The k-means algorithm is a widely used algo-rithm for cluster in data mining [28]. It randomly select k instances as the center of k classes, and according to the Euclidean distance, the rest instances will be re-spectively assigned to the closest class. Then this process will be repeated until the sum of squared error of the centre converge. Thus the initial defended value of k and the center of classes for k-means directly impact the cluster effect. PSO has strong global searching ability which helps k-means to avoid falling local-best. Since internal information sharing between particles in the population in each
iteration, the results converge rapidly and steadily. The fitness function of PSO op-timized k-means cluster algorithm adopts the Euclidean distance as its fitness func-tion to find out the appropriate center of the classes. Moreover, compared with the previous methods [29, 30], in order to find the global best solution in this step, there are two termination conditions assisting PSO to obtain a reasonable k value of k-means (where k is the number of clusters). The first condition is that the number of clusters must be greater than one, and the second is that the minimum value of Kappa in all of the classification results of the numerous sub-datasets must be greater than 0.2. Here, the classifier still implements the Neural Network. Therefore, PSO can assist k-means adaptively find out the proper centre of classes and the value of K to overcome weakness of the traditional k-means algorithm. Furthermore, in a new sub-dataset, if the original minority class samples overcome the other class samples in quantity, Neural Network will directly classify this sub-dataset. Otherwise this dataset will perform the over-sampling operation.
The second part is the evolutionary version of the Swarm Rebalancing Algorithm (SRA) [17, 22], which is called the Swarm Dynamic Multi-objective Rebalancing Algorithm (SDMRA) or DMSMOTE. This algorithm is used instead of SRA to fix a credible value of Kappa to promote accuracy. The final result is the average value of all sub-datasets, as shown in Equation (8).
final result¼ Xc 1ð Þpn
=c: ð8Þ
Direct Neural Network, SMOTE + Neural Network, Random-SMOTE [31], and our forgoing version of SRA (PSO SMOTE) + Neural Network constitute the com-parison benchmark. We generate the completely balanced dataset with SMOTE. Random-SMOTE is used to randomly pick out parameters for SMOTE to generate a new dataset, using the average of ten times of Random-SMOTE as the ultimate result of each dataset. PSO SMOTE (SRA) has two update conditions, based on the requirements that Kappa will be greater than the fixed Kappa threshold (0.4), and that the accuracy must be greater than that of the previous position. In the experiments, the populations of the PSO and the maximum iteration are 20 and 100, respectively. Note that Matlab (version 2014) has been utilized to code and compile the whole program, and the operating and computing environment for all experiments is in the workstation with CPU: CPU: E5-1650 V2 @ 3.50 GHz, RAM: 32 GB.
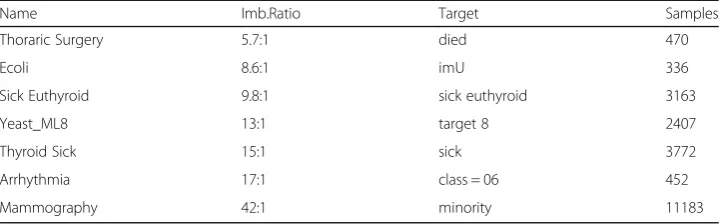
The target of our experiment is the binary classification problem. We obtained our seven biomedical or bioinformatics datasets from Ding [32] and UCI [33]. Some multi-class datasets were also modified by Ding to be binary multi-classes as the target is needed or to take the tiny proportion. Table 1 presents information on the datasets. The
Table 1Information of our biomedical datasets
Name Imb.Ratio Target Samples
Thoraric Surgery 5.7:1 died 470
Ecoli 8.6:1 imU 336
Sick Euthyroid 9.8:1 sick euthyroid 3163
Yeast_ML8 13:1 target 8 2407
Thyroid Sick 15:1 sick 3772
Arrhythmia 17:1 class = 06 452
Imb.Ratio is the ratio between the majority class and the minority class, ranging from 5.7:1 to 42:1. The target indicates the minority class in the dataset. The selected dataset contains the clinic dataset of thoracic surgery, disease datasets of thyroid sick and Arrhythmia; the biological image dataset of mammography; and the microbiological dataset of E. coli and yeast. Thus it can be seen that the imbalanced dataset appeared in different orientations of the biologic domain.
Results and discussion
The average performance in terms of Kappa, accuracy, G-mean, F-measure, and Imbalanced ratio as well as their respective offsets are shown in Tables 2, 3, 4, 5 and 6, respectively. The bold values significantly indicate the best value for each dataset and method. Meanwhile, the averages of these indicators are visualized in Figs. 3, 4, 5, 6 and 7 for comparison of the capabilities and variations of the differ-ent approaches. All figures and tables include NN, SMOTE-NN, R-SMOTE-NN, SRA-NN and ASCB-DMSMOTE-NN on behalf of Neural Network, SMOTE with Neural Network, Random-SMOTE with Neural Network, PSO-SMOTE with Neural Network and the proposed Adaptive Swarm Clustered Based Dynamic Multi-objective SMOTE.
Figure 4 illuminates the results of our two targets, Kappa and accuracy, and the left 5 boxes stand for Kappa value with the symbol ‘-K’and the right 5 boxes indicate accur-acy with the symbol ‘-A‘. These two box plots are homologous to Tables 7 and 2. We can observe that the average Kappa of NN of the original dataset is lower than 0.4 and
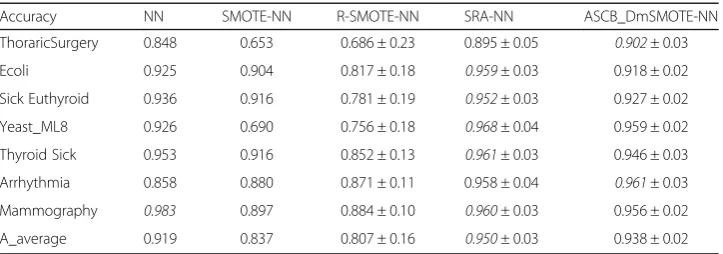
Table 3Average Accuracy of different algorithms with different datasets
Accuracy NN SMOTE-NN R-SMOTE-NN SRA-NN ASCB_DmSMOTE-NN
ThoraricSurgery 0.848 0.653 0.686 ± 0.23 0.895 ± 0.05 0.902± 0.03
Ecoli 0.925 0.904 0.817 ± 0.18 0.959± 0.03 0.918 ± 0.02
Sick Euthyroid 0.936 0.916 0.781 ± 0.19 0.952± 0.03 0.927 ± 0.02
Yeast_ML8 0.926 0.690 0.756 ± 0.18 0.968± 0.04 0.959 ± 0.02
Thyroid Sick 0.953 0.916 0.852 ± 0.13 0.961± 0.03 0.946 ± 0.03
Arrhythmia 0.858 0.880 0.871 ± 0.11 0.958 ± 0.04 0.961± 0.03
Mammography 0.983 0.897 0.884 ± 0.10 0.960± 0.03 0.956 ± 0.02
A_average 0.919 0.837 0.807 ± 0.16 0.950± 0.03 0.938 ± 0.02
The italicized entries represent the best performance
Table 2Average Kappa of different algorithms with different datasets
Kappa NN SMOTE-NN R-SMOTE-NN SRA-NN ASCB_DmSMOTE-NN
Thoraric Surgery 0.049 0.305 0.312 ± 0.48 0.670 ± 0.21 0.813± 0.11
Ecoli 0.502 0.807 0.723 ± 0.12 0.850 ± 0.05 0.848± 0.06
Sick Euthyroid 0.497 0.831 0.688 ± 0.13 0.824 ± 0.07 0.874± 0.05
Yeast_ML8 0.000 0.381 0.578 ± 0.23 0.968± 0.02 0.927 ± 0.04
Thyroid Sick 0.360 0.833 0.762 ± 0.12 0.906± 0.06 0.829 ± 0.11
Arrhythmia 0.068 0.761 0.826 ± 0.13 0.937 ± 0.04 0.966± 0.02
Mammography 0.436 0.794 0.729 ± 0.14 0.673 ± 0.16 0.932± 0.02
K_average 0.273 0.673 0.660 ± 0.22 0.833 ± 0.09 0.884± 0.06
that the length of the box is great. Especially in the Yeast_ML8 dataset, the minimum Kappa value is zero but its accuracy is greater than 0.9–a typical pseudo-high accuracy as mentioned above which has no credibility. The original SMOTE totally rebalances the imbalanced dataset. The second boxes of Kappa show great increases in the average and the height of the body. However, SMOTE sacrifices accuracy to obtain credibility. In contrast, the performances of Random-SMOTE are more stable than those of SMOTE, even though its median Kappa value is less than that of SMOTE. PSO-SMOTE has the highest accuracy and a higher Kappa value than the previous three. Moreover, it is the most significant because it improves the Kappa value and promotes the accuracy of the best value of 1. The accuracy of the proposed algorithm is slightly lower than that of PSO-SMOTE, but the Kappa is higher; furthermore, the length of the boxes shows that the proposed approach is more settled than our previous version and that there is no discrete point on the whole.
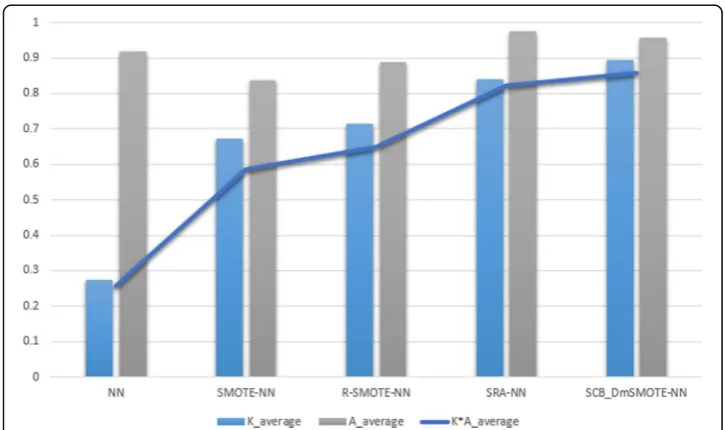
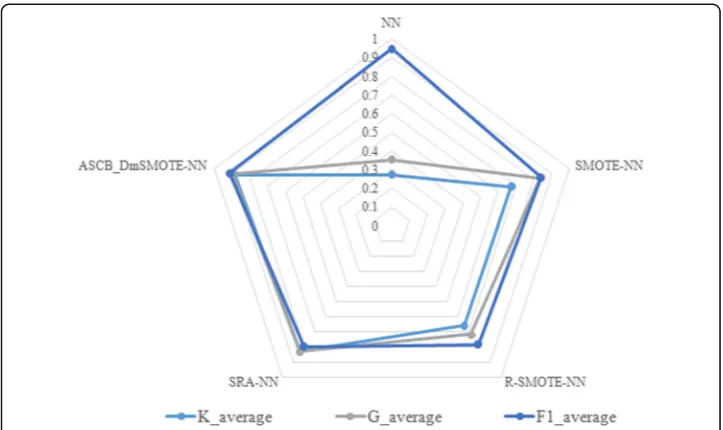
As mentioned above, we created and introduced an index called reliable accuracy which was the product of Kappa and accuracy. Kappa represents the degree of the clas-sification model’s agreement, reliability and credibility; thus we can connect these two indicators to assess the accuracy in truth. In addition, this is also a strategy of decision making to select a suitable pair of solutions from the non-inferior set. Figure 5 presents the average kappa, accuracy and reliable accuracy of each method. The results of the line diagram agree with those of the above discussions about the two box plots. Through the radar chart of Fig. 6, we compare the three commonly used auxiliary evaluation fingers. In our experiment, F-measure (F1) almost lost its effect. We note
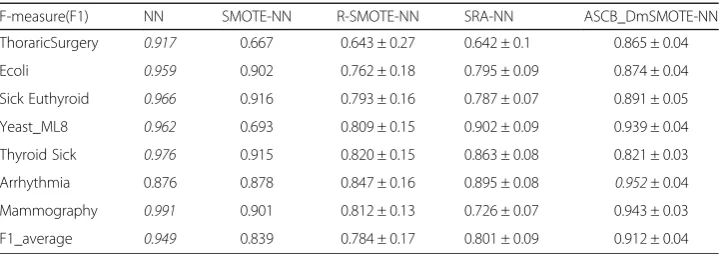
Table 5Average F-measure of different algorithms with different datasets
F-measure(F1) NN SMOTE-NN R-SMOTE-NN SRA-NN ASCB_DmSMOTE-NN
ThoraricSurgery 0.917 0.667 0.643 ± 0.27 0.642 ± 0.1 0.865 ± 0.04
Ecoli 0.959 0.902 0.762 ± 0.18 0.795 ± 0.09 0.874 ± 0.04
Sick Euthyroid 0.966 0.916 0.793 ± 0.16 0.787 ± 0.07 0.891 ± 0.05
Yeast_ML8 0.962 0.693 0.809 ± 0.15 0.902 ± 0.09 0.939 ± 0.04
Thyroid Sick 0.976 0.915 0.820 ± 0.15 0.863 ± 0.08 0.821 ± 0.03
Arrhythmia 0.876 0.878 0.847 ± 0.16 0.895 ± 0.08 0.952± 0.04
Mammography 0.991 0.901 0.812 ± 0.13 0.726 ± 0.07 0.943 ± 0.03
F1_average 0.949 0.839 0.784 ± 0.17 0.801 ± 0.09 0.912 ± 0.04
The italicized entries represent the best performance
Table 4Average G-mean value of different algorithms with different dataset
G-mean NN SMOTE-NN R-SMOTE-NN SRA-NN ASCB_DmSMOTE-NN
ThoraricSurgery 0.179 0.651 0.479 ± 0.22 0.715 ± 0.12 0.843± 0.05
Ecoli 0.630 0.904 0.768 ± 0.18 0.813 ± 0.12 0.875± 0.04
Sick Euthyroid 0.613 0.916 0.750 ± 0.15 0.832 ± 0.10 0.916± 0.04
Yeast_ML8 0.000 0.690 0.641 ± 0.14 0.926 ± 0.07 0.928± 0.05
Thyroid Sick 0.453 0.916 0.811 ± 0.14 0.898± 0.05 0.836 ± 0.6
Arrhythmia 0.091 0.880 0.802 ± 0.13 0.904 ± 0.06 0.951± 0.4
Mammography 0.520 0.896 0.795 ± 0.12 0.746 ± 0.06 0.926± 0.5
G_average 0.355 0.836 0.721 ± 0.14 0.833 ± 0.10 0.896± 0.05
that G-mean and Kappa have nearly the same consistent variation even though Kappa is more sensitive and cautious.
The last bar diagram of Fig. 7 reveals the variations of the minority class data from the majority class data. With reference from Table 6, we find that our methods synthe-sise many minority class samples, even the number of minority class is more than the number of majority class in the new dataset, which renders our methods to require more time for processing, as shown in Fig. 6. However, their performance is better, and this also illustrate that the absolute equilibrium distribution of classes does not pertain to the best results.
Conclusions
In this paper, our proposed approach, ASCB_DmSMOTE, can overcome the imbal-anced dataset problems in biomedical classification. It reasonably re-allocates the
Fig. 3Snapshot of fluctuating values of accuracy and Kappa (an example of imbalanced dataset with 100 majority class samples and 5 minority class samples)
Table 6Average Imbalanced ratio (majority: minority) value of different algorithms with different datasets
Imb.Ratio (ma/mi) NN SMOTE-NN R-SMOTE-NN SRA-NN ASCB_DmSMOTE-NN
ThoraricSurgery 5.7:1 1:1 1.2 ± 0.7:1 0.7 ± 0.4:1 0.5 ± 0.3:1
Ecoli 8.6:1 1:1 1.3 ± 0.5:1 0.6 ± 0.2:1 0.4 ± 0.3:1
Sick Euthyroid 9.8: 1:1 1.8 ± 0.5:1 1.1 ± 0.3:1 0.7 ± 0.4:1
Yeast_ML8 12.6: 1:1 1.9 ± 0.6:1 0.6 ± 0.2:1 0.7 ± 0.2:1
Thyroid Sick 15.3:1 1:1 1.6 ± 0.4:1 0.8 ± 0.3:1 0.9 ± 0.1:1
Arrhythmia 17.1:1 1:1 1.3 ± 0.7:1 0.7 ± 0.3:1 0.5 ± 0.2:1
Mammography 42.0:1 1:1 1.5 ± 0.5:1 0.9 ± 0.2:1 0.8 ± 0.3:1
majority class in the details and dynamically optimises the two parameters of SMOTE to synthesise a reasonable scale of minority class for each sub-dataset and ultimately attains higher credibility of the classification model and even greater ac-curacy. This algorithm is a new version of SMOTE, and through the swarm intelligence algorithm, our swarm rebalancing series of algorithm can effectively combine the over-sampling, under-sampling and ensemble techniques. In addition to such a combination of methods, they can also be used with the population’s
Fig. 5Average of Kappa, Accuracy and Reliable accuracy of all experiments
path to consecutively determine the best and most reasonable global solution. The new concept of reliable accuracy not only deals with decision making but also can be more direct and valid to evaluate a classification model. Its performances are much steadier than those of the previous version of our algorithms. Furthermore, it is able to more scientifically and effectively generate better and more reasonable synthetic data than the traditional class rebalancing algorithm. This work offers in-sights to biomedical practitioners who consider the application of computational tools to subside the imbalanced dataset problem, which is typically inherently in biomedical data.
Fig. 7Size variations of datasets with different methods processed
Acknowledgments
The authors are thankful for the financial support from University of Macau, FST and RDAO.
Funding
The financial support from the research grant‘Temporal Data Stream Mining by Using Incrementally Optimised Very Fast Decision Forest (iOVFDF)’, Grant no. MYRG2015-00128-FST, which is offered by the University of Macau, FST and RDAO, is gratefully acknowledged.
Availability of data and materials
The utilized biomedical or bioinformatics datasets from Ding’s paper in reference [32] and UCI [33] are publicly available at the URL: https://archive.ics.uci.edu/ml/datasets.html.
Authors’contributions
SF and KKLW proposed the framework of this paper and gave the directions for all experiments. JL designed and implemented the methods, as well as performed the experiments. SF and KKLW analyzed and confirmed the validity of the experiments. JL, KKLW, and SF interpreted the results and drafted the manuscript. YS, KC, and RW reviewed the paper and gave reasonable comments for improvements. All authors have read and approved the manuscript.
Competing interests
The authors declare that they have no competing interests.
Consent for publication
Not applicable.
Ethics approval and consent to participate
Not applicable.
Author details
1
Department of Computer and Information Science, University of Macau, Taipa, Macau, S.A.R., China.2Computer Engineering Division, Keimyung University, Daegu, South Korea.3Department of Multimedia Engineering, College of Engineering, Dongguk University, Dongdaeipgu, South Korea.4School of Computer Science and Engineering, University of New South Wales, Sydney, NSW 2000, Australia.5Centre for Biomedical Engineering, School of Electrical & Electronic Engineering, University of Adelaide, Adelaide, Australia.6School of Medicine, Western Sydney University, Campbelltown, Sydney, Australia.
Received: 13 May 2016 Accepted: 21 November 2016
References
1. Kamal AHM, et al. The impact of gene selection on imbalanced microarray expression data, Bioinformatics and Computational Biology. Berlin Heidelberg: Springer; 2009. p. 259–69.
2. Dobrev D, Neycheva T, Mudrov N. Simple two-electrode biosignal amplifier. Med Biol Eng Comput. 2005;43(6): 725–30.
3. Reiner BI. Medical imaging data reconciliation, Part 3: Reconciliation of historical and current radiology report data. J Am Coll Radiol. 2011;8(11):768–71.
4. Mandel LR, Borek E. The nature of the RNA synthesized during conditions of unbalanced growth in E. coli K12W-6*. Biochemistry. 1963;2(3):560–6.
5. Glassner BJ, et al. Generation of a strong mutator phenotype in yeast by imbalanced base excision repair. Proc Natl Acad Sci. 1998;95(17):9997–10002.
6. Kusiak A, Kernstine KH, Kern JA, McLaughlin KA, Tseng TL. Data Mining: Medical and Engineering Case Studies. Cleveland: Industrial Engineering Research Conference; 2000. p. 1–7.
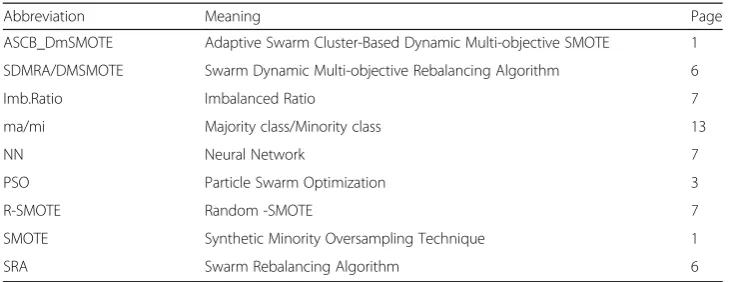
Table 7List of abbreviations
Abbreviation Meaning Page
ASCB_DmSMOTE Adaptive Swarm Cluster-Based Dynamic Multi-objective SMOTE 1
SDMRA/DMSMOTE Swarm Dynamic Multi-objective Rebalancing Algorithm 6
Imb.Ratio Imbalanced Ratio 7
ma/mi Majority class/Minority class 13
NN Neural Network 7
PSO Particle Swarm Optimization 3
R-SMOTE Random -SMOTE 7
SMOTE Synthetic Minority Oversampling Technique 1
7. Fernández-Navarro F, Hervás-Martínez C, Gutiérrez PA. A dynamic over-sampling procedure based on sensitivity for multi-class problems. Pattern Recogn. 2011;44(8):1821–33.
8. Fawcett T, Provost FJ. Combining Data Mining and Machine Learning for Effective User Profiling. KDD. 1996. 9. He H, Garcia EA. Learning from imbalanced data. Knowledge Data Eng, IEEE Trans. 2009;21.9:1263–84. 10. Thai-Nghe, Nguyen, Zeno Gantner, and Lars Schmidt-Thieme. Cost-sensitive learning methods for imbalanced
data. Neural Networks (IJCNN), The 2010 International Joint Conference on. IEEE, 2010.
11. Joshi MV, Kumar V, Agarwal RC. Evaluating boosting algorithms to classify rare classes: Comparison and improvements. In Data Mining, 2001. ICDM 2001, Proceedings IEEE International Conference on. IEEE, 2001. pp. 257–264.
12. Guo H, Viktor HL. Learning from imbalanced data sets with boosting and data generation: the DataBoost-IM approach. ACM SIGKDD Explorations Newsletter. 2004;6.1:30–9.
13. Akbani R, Kwek S, Japkowicz N. Applying support vector machines to imbalanced datasets, Machine Learning: ECML 2004. Berlin Heidelberg: Springer; 2004. p. 39–50.
14. Chawla NV, et al. SMOTE: synthetic minority over-sampling technique. J Artificial Intelligence Res. 2002:321–357. 15. Li J, Fong S, Zhuang Y. Optimizing SMOTE by Metaheuristics with Neural Network and Decision Tree.
Computational and Business Intelligence (ISCBI), 2015 3rd International Symposium on. IEEE, 2015.
16. Kennedy J. Particle swarm optimization. In Encyclopedia of Machine Learning, Springer US; 2010. pp. 760–766. 17. Marzban C. The ROC curve and the area under it as performance measures. Weather Forecast. 2004;19(6):1106–14. 18. Mani I, Zhang I. KNN approach to unbalanced data distributions: a case study involving information extraction,
Proceedings of Workshop on Learning from Imbalanced Datasets. 2003.
19. Tang Y, et al. SVMs modeling for highly imbalanced classification. Systems, Man, and Cybernetics, Part B: Cybernetics, IEEE Transactions on 39.1 (2009): 281–288.
20. Viera AJ, Garrett JM. Understanding interobserver agreement: the Kappa statistic. Fam Med. 2005;37.5:360–3. 21. Landis JR, Koch GG. The measurement of observer agreement for categorical data. Biometrics. 1977;33(1):159–74. 22. Li J , et al. Improving the classification performance of biological imbalanced datasets by swarm optimization
algorithms. J Supercomputing. 2016,72(10):3708–28.
23. Li J, et al. Solving the under-fitting problem for decision tree algorithms by incremental swarm optimization in rare-event healthcare classification. JMed Imaging Health Inform. 2016;6(4):1102–10.
24. Fonseca CM, Fleming PJ. Genetic algorithms for multiobjective optimization: formulation discussion and generalization, ICGA, vol. 93. 1993.
25. Li J, et al. Adaptive Multi-objective Swarm Crossover Optimization for Imbalanced Data Classification. Advanced Data Mining and Applications: 12th International Conference, ADMA 2016. Gold Coast: Proceedings. Springer International Publishing, 2016.
26. van der Gaag M, et al. The five-factor model of the Positive and Negative Syndrome Scale II: a ten-fold cross-validation of a revised model. Schizophr Res. 2006;85.1:280–7.
27. van der Merwe DW, Engelbrecht AP. Data clustering using particle swarm optimization. Evolutionary Computation, 2003. CEC’03. The 2003 Congress on. Vol. 1. IEEE, 2003
28. Hartigan JA, Wong MA. Algorithm AS 136: A k-means clustering algorithm. J R Stat Soc: Ser C: Appl Stat. 1979;28.1: 100–8.
29. Jo T, Japkowicz N. Class imbalances versus small disjuncts. ACM Sigkdd Explorations Newsletter. 2004;6.1:40–9. 30. Yen SJ, Lee YS. Cluster-based under-sampling approaches for imbalanced data distributions. Expert Syst
Applications. 2009;36(3):5718–27.
31. Han H, Wang WY, Mao BH. Borderline-SMOTE: a new over-sampling method in imbalanced data sets learning, Advances in Intelligent Computing. Berlin Heidelberg: Springer; 2005. p. 878–87.
32. Ding Z. Diversified ensemble classifiers for highly imbalanced data learning and their application in bioinformatics. 2011.
33. Lichman, M. (2013). UCI Machine Learning Repository [https://archive.ics.uci.edu/ml/datasets.html]. Irvine, CA: University of California, School of Information and Computer Science. Accessed 1 Apr 2016.
• We accept pre-submission inquiries
• Our selector tool helps you to find the most relevant journal
• We provide round the clock customer support
• Convenient online submission
• Thorough peer review
• Inclusion in PubMed and all major indexing services
• Maximum visibility for your research
Submit your manuscript at www.biomedcentral.com/submit