R E S E A R C H
Open Access
Network analysis reveals stage-specific
changes in zebrafish embryo development
using time course whole transcriptome
profiling and prior biological knowledge
Yuji Zhang
1,2Correspondence:
[email protected] 1Division of Biostatistics and Bioinformatics, University of Maryland Greenebaum Cancer Center, Baltimore, USA
2Department of Epidemiology and Public Health, University of Maryland School of Medicine, Baltimore, USA
Abstract
Background:Molecular networks act as the backbone of molecular activities within cells, offering a unique opportunity to better understand the mechanism of diseases. While network data usually constitute only static network maps, integrating them with time course gene expression information can provide clues to the dynamic features of these networks and unravel the mechanistic driver genes characterizing cellular responses. Time course gene expression data allow us to broadly“watch”the dynamics of the system. However, one challenge in the analysis of such data is to establish and characterize the interplay among genes that are altered at different time points in the context of a biological process or functional category. Integrative analysis of these data sources will lead us a more complete understanding of how biological entities (e.g., genes and proteins) coordinately perform their biological functions in biological systems.
Results:In this paper, we introduced a novel network-based approach to extract functional knowledge from time-dependent biological processes at a system level using time course mRNA sequencing data in zebrafish embryo development. The proposed method was applied to investigate 1α, 25(OH)2D3-altered mechanisms in
zebrafish embryo development. We applied the proposed method to a public zebrafish time course mRNA-Seq dataset, containing two different treatments along four time points. We constructed networks between gene ontology biological process categories, which were enriched in differential expressed genes between consecutive time points and different conditions. The temporal propagation of 1α, 25-Dihydroxyvitamin D3-altered transcriptional changes started from a few genes
that were altered initially at earlier stage, to large groups of biological coherent genes at later stages. The most notable biological processes included neuronal and retinal development and generalized stress response. In addition, we also investigated the relationship among biological processes enriched in co-expressed genes under different conditions. The enriched biological processes include translation elongation, nucleosome assembly, and retina development. These network dynamics provide new insights into the impact of 1α, 25-Dihydroxyvitamin D3treatment in bone and cartilage
development. (Continued on next page)
(Continued from previous page)
Conclusion:We developed a network-based approach to analyzing the DEGs at different time points by integrating molecular interactions and gene ontology
information. These results demonstrate that the proposed approach can provide insight on the molecular mechanisms taking place in vertebrate embryo development upon treatment with 1α, 25(OH)2D3. Our approach enables the monitoring of biological
processes that can serve as a basis for generating new testable hypotheses. Such network-based integration approach can be easily extended to any temporal- or condition-dependent genomic data analyses.
Background
The active form of Vitamin D3 - 1α,25-dihydroxyvitamin D3 [1α,25(OH)2D3] – have
demonstrated playing a critical role in calcium and phosphorus homeostasis by in-creasing intestinal calcium and phosphorus transport, thereby maintaining normal serum calcium and phosphorus concentrations and allowing bone mineralization to proceed [1, 2]. In previous works, we have shown that 1α,25(OH)2D3alters expression
of hundreds to thousands of genes at different developmental stages in early zebrafish embryosin vivo[3]. However, it is challenging to digest and interpret the regulatory re-lationships among these differentially expressed genes at adjacent developmental stages. Novel informatics approaches are needed to fill in the gap how to interpret these thou-sands of differentially expressed genes at different time points in a systematic manner.
Biological systems are highly dynamic and responsive to the external environment. The gene expression in these systems is a temporal process. Different genes are required to play different functional roles under different conditions. This is highly regulated by a complex regulatory system of diverse molecular interactions, such as protein-protein interactions (PPIs), protein-DNA interactions (PDIs), and metabolic signaling pathways [4]. Taking a snapshot of the gene expression profile in a biological system (e.g., cell cycle system and development) under a certain condition can reveal some of the genes that are specially expressed under this condition. However, to inves-tigate how all the genes are regulated in the context of a biological system, and to determine the interaction relationships between these genes, it is necessary to measure the gene expression profile in a time series manner [5]. This can also provide the dis-tinct possibility of unraveling the mechanistic drivers characterizing cellular responses [6]. Time series gene expression data have been widely applied to study a wide range of biological systems, including cell cycle [7], genetic interaction and knockouts [8, 9], and development [10]. Despite their unique features, many computational challenges still remain in analyzing such gene expression profiles. For instance, it is difficult to study the relationships among differentially expressed genes (DEGs) at each time point in a case–control time series experiment, due to large number of DEGs and limited time points available. To address such challenges, algorithms are required that are speci-fically designed to improve the interpretability of these data by integrating multi-source prior biological evidence.
biological system. The molecular interaction maps have been built in model organisms (e.g., S.cerevisiae [11], D.melanogaster [12] and C.elegans [13]), as well as in higher vertebrate organisms (e.g., zebrafish [14], mouse [15] and human [16]). Evidently, the generated interaction maps offer us a rich resource for systematic studies of molecular networks and complement other types of biological data. However, current interaction databases include a large amount of false positive and false negative interactions due to the unreliability of interaction mapping technologies available. In addition, these molecular interactions are static. There is little direct information available on the temporal dynamics of these molecular interactions. To understand time-dependent biological processes at network level, molecular networks need to be considered as temporal and spatial rather than static information flow between molecules [17]. Recently, attempts have been made in integrating different types of biological data with molecular network interactions to reveal the dynamics of molecular networks [18]. However, only a few studies have investigated the dynamics of the molecular network interactions in time course gene expression data with limited success. For instance, Tang et al. [19] proposed to reconstruct time course protein interaction networks (TC-PINs) by incorporating time series gene expression into PPI networks. The func-tional modules from TC-PINs were enriched in related gene ontology (GO) biological processes than those from static PPI networks. However, the causal relationship between TC-PINs across time points could not be inferred. Such causal relationships are crucial to understand the underlying regulated biological processes in a time-dependent and context-specific manner. A propagation of such interactions from gene level to biological process/pathway level (e.g., gene ontology information) will help us identify the altered biological processes during the time in which these gene expres-sions are examined.
The gene ontology (GO) Consortium [20] has developed three separate ontologies-molecular function (MF), biological process (BP) and cellular component (CC) - to describe the attributes of gene products. Several studies have demonstrated that the molecular interactions and GO provide substantially congruent yet subtle different view of biological systems [21]. The hypothesis is that the interaction between any two proteins/genes indicates a general likelihood that these two proteins are functionally coupled or involved in the same biological process. Identifying enriched interactions between any two GO terms based on molecular interactions between genes assigned to these two GO terms are more statistically reliable: interactions reflect statistically enriched temporal connections between multiple genes of one GO term and multiple genes of another. However, this could not tell the temporal directionality in these connections. By incorporating time series gene expression data, the causal relations can be inferred in this GO network by highlighting information flow between GO biological processes enriched in DEGs at consecutive time points.
understand the biological processes at GO scale, in which relations between nodes (representing GO terms) are more statistically stable. This is more statistically signifi-cant and biologically meaningful compared to single co-expressed links. The detail of the proposed approach is presented in Fig. 1. The proposed method was applied to time series mRNA-Seq data set to determine the influence of 1α,25(OH)2D3treatment
on gene expression patterns in zebrafish embryo development and the causal relation-ship between DEGs at consecutive time points. The resulting networks suggest that well-studied as well as novel molecular mechanisms are regulated by 1α,25(OH)2D3
treatment.
Results
In this section, we present: (1) a description of generation and initial characterization of the mRNA-seq dataset obtained from zebrafish embryos altered by 1α,25(OH)2D3
treatment; (2) an overview the interactome-based analysis that we proposed; (3) a
chronologically organized analysis of the transcriptome changes and interactome dynamics altered by 1α,25(OH)2D3 treatment during early zebrafish development.
Figure 1 illustrates the overview of the proposed analysis workflow.
Characterization of mRNA-seq dataset during zebrafish embryo development
Genome-wide transcriptional profiling were performed using Illumina HiSeq sequencing technique for four replicate cDNA libraries of 1α,25(OH)2D3- or vehicle-treated zebrafish,
48, 96, 144, and 168 hours post fertilization (hpf) as described in our previous publication [3]. Overall, the RNA-seq data obtained from 32 independent zebrafish RNA libraries had comparable number of total reads [3]. These reads were mapped to the latest zebrafish genome assembly (zv9) from the UCSC website (http://genome.ucsc.edu/). The refFlat annotation file from the University of California Santa Clara (UCSC) Table Browser was used to generate raw reads mapped to each annotated gene in the annotation file. The genes altered by 1α,25(OH)2D3treatment at each time point were identified using the
negative binomial model as describe in [22]. A list of altered genes identified along with the days on which they were differentially expressed is presented in Additional file 1: Table S1. We also carried out the gene ontology (GO) enrichment analysis using the GOMiner tool [23]. However, due to the limited number of DEGs identified at each time point and the limitation associated with the Fisher’s Exact Test, the results of these ana-lyses could not provide much indication of the biological processes being modulated in response to 1α, 25(OH)2D3treatment. To more efficiently derive biological insights from
the genome-wide transcriptomic response to the treatment, we proposed a network-based analysis in the following sections.
Interactome-based analysis of differentially expressed genes during zebrafish development
We overlaid the DEGs onto the zebrafish functional interactome from the FunCoup database [14]. The DEGs were overlaid on their corresponding nodes in the interactome, and related functional interactions between genes were extracted and reconstructed the 1α,25(OH)2D3 specific interactome. Many network interactions connect the few genes
altered on day 2 and many altered on later days. We found that there was a statistically significant enrichment in links between genes that were 1α, 25(OH)2D3-altered earlier
and genes regulated later in the course of experiment. This suggested that treatment affected signals were propagated along network routes from the initially affected genes (on day 2) towards network regions that were perturbed later.
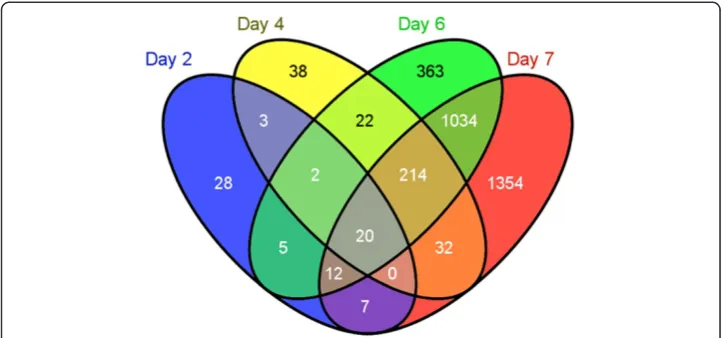
Specifically, 3134 genes were up- or down-regulated by 1α,25(OH)2D3on at least one
of the four days in the experiment (adjusted P value less than 0.01). On day 2, only 77 genes were changed. 331 genes on day 4, 1672 genes on day 6, and 2673 genes on day 7 differentially expressed in response to 1α,25(OH)2D3treatment (Fig. 2). The property
To gain a better perspective on what this temporal pattern in enriched connections between 1α,25(OH)2D3-altered genes might mean, we analyzed the GO categories
asso-ciated with the connected nodes in the context of interactome.
Network propagation analysis of differentially expressed genes during zebrafish development
The FunCoup network links among these genes can indicate a general likelihood how they are functionally related, but don’t highlight the temporal directionality in these connections. Causal relations can be suggested by examining temporal changes, i.e., if information associated with geneAat time pointthelps to predict the state of gene B
at time point (t+ 1), then a causal relation A- > B might be inferred [24, 25]. However, traditional network inference approaches could not identify such temporal regulatory relationship due to limited time points available. The statistical power from only four time points would be too low for robust analysis. To gain a better perspective on the temporal pattern among 1α, 25(OH)2D3-altered genes, we generalized a network of GO
terms connected by the links between these DEGs on consecutive time points. At this broader scale, relations between nodes (GO biological processes) are statistical reliable: links reflect statistically enriched temporal connections between multiple genes of one node with multiple genes of another. Thus, this GO-GO network highlights flow be-tween GO biological processes altered by 1α, 25(OH)2D3on different days.
1α, 25(OH)2D3-altered genes in individual gene-gene interactions in FunCoup
inter-actome were labeled with days when these genes were detected as differentially expressed. We were particularly interested in identifying the links in which one gene was altered earlier than the other. Thus, if there were a significant number of genes in GO categoryXaltered on daydinteracting with gene in GO categoryYaltered on day (d+ 1), we hypothesize that a causative relation X - >Y. Limiting the output to only enriched GO-GO connections allowed us to focus on the major changes of propagation of 1α, 25(OH)2D3and organismal response to it. Compared to the individual category
enrichment approach such as GOMiner, our approach yielded a much richer analysis for interpretation of time series changes unique to time series gene expression data. The Figs. 2–4 presented day-to-day enriched interactions at GO biological process level. We provided a chronological interpretation on these findings below.
Chronological analysis of the interaction network altered by 1α, 25(OH)2D3at gene
ontology level
The approach described above enabled flexible and deep monitoring of 1α, 25(OH)2D3altered changes in the transcriptome at GO level in the context of
func-tional interactome. To show time-dependent information flow in embryonic deve-lopment altered by 1α,25(OH)2D3 treatment, GO networks of enriched GO-GO
interactions were reconstructed.
Day 2 to day 4 transition
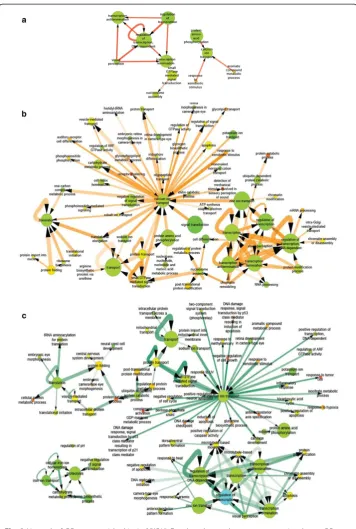
The network of GO terms between DEGs on day 2 and 4 suggested a cascade initiated by changes in xenobiotic metabolism genes and leading to genes involved in ion transport and transcription regulation (Fig. 3(a)). The“eye development”category is enriched on as early as day 2, indicating that eye development was changed by 1α, 25(OH)2D3treatment.
The eye development of zebrafish starts as early as 28 hpf [26]. The vitamin D receptor has been shown to express in various tissues and organs including retina. This confirms the finding using our proposed approach.
Day 4 to day 6 transition
Day 4 was marked by the most significant increase of linkage from transcription factors altered on day 4 towards others altered later. The most central node on day 4 is organ development, which became connected to multiple biological processes, such as cardio-vascular system development, blood vessel development, immune system process, heart development, brain development, tube development, and others. This observation sug-gests that vitamin D treatment can alter biological processes involved in the development of many organs. One network of GO terms between day 4 and 6 is presented in Fig. 3(b).
Day 6 to day 7 transition
The organ morphogenesis was identified as a central node in the GO network of day 6 - > 7, connecting to multiple biological processes, such as nervous system ment, circulatory system development, vasculature development, epithelium develop-ment, retina development in camera type eye, and many embryonic development terms including cartilage development and neuron generation. One network of GO terms between day 6 and 7 is presented in Fig. 3(c).
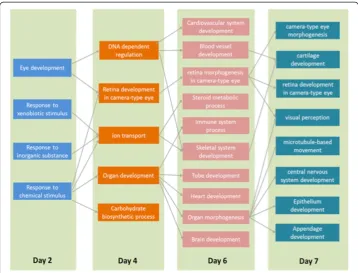
To better interpretate the causal relationships between enriched GO categories on consecutive days, we presented a GO level information flow by combining the GO-GO networks across all four days (Fig. 4). The interactome was altered in the regions scat-tered in the interactome to many biological processes that are clusscat-tered together in the interactome. This suggests that the effect of 1α, 25(OH)2D3treatment can be as early
Condition-specific GO network analysis
We also constructed the condition-specific meta-flow network based on co-expressed links identified. The statistics of three types of condition-specific links is presented in Table 1. A meta-flow network of GO terms was constructed for each condition-specific
Fig. 3Network of GO terms enriched in 1α,25(OH)2D3-altered genes between consecutive days.aGO
network of day 2 - > 4;bGO network of day 4 - > 6;cGO network of day 6 - > 7. Color represent the fraction of the gene in that node that were regulated by 1α,25(OH)2D3on any day (green is low and red is high). Edge
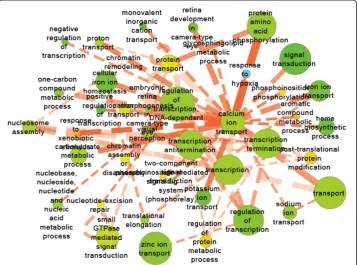
coexpression network. For instance, in 1α,25(OH)2D3-specific GO network (Fig. 5),
several calcium metabolism-related GO terms were inferred by our approach including calcium ion transport, one-carbon compound metabolic process. Specifically, the response to hypoxia has been reported to be inhibited by 1α,25(OH)2D3in human cancer cells [27].
In addition, there were quite a few developmental-related processes altered by 1α,25(OH)2D3treatment, such as translation elongation, nucleosome assembly, and retina
development. All these enriched GO terms indicated that 1α,25(OH)2D3altered several
pathways in developing eukaryotes.
Discussion
In this work, we have developed a network-based computational approach that analyzes time series mRNA-seq gene expression profiles in the context of molecular interactome and GO information to reveal temporal transcriptional changes altered by 1α,25(OH)2D3
in zebrafish embryo development. This enabled us to review the progression of 1α,25(OH)2D3-induced changes in gene expression and the network structure itself in
zebrafish embryo development. The efficiency of our analysis of 1α,25(OH)2D3-alered
Fig. 4Overview of associations among GO terms enriched in 1α,25(OH)2D3-altered genes at each time point
Table 1Statistics of co-expressed links
Link type Gene # Link # Co-expressed link
1α, 25(OH)2D3–related 4025 13945 5622
Ethanol–related 4233 14590 5321
global gene expression was enhanced by the interactome approach, as the network-based analysis approach were superior to their single-gene approach in terms of both statistical power and biological interpretability, A variety of interesting biological hypotheses were derived from our analysis. The significant biological processes include iron metabolism, neuronal and retinal development, and many organ development related pathways. Our approach is useful for discovering candidate biological processes that can serve as a basis for generating new testable hypotheses. Such network-based integration approach can be extended to any temporal- or condition-dependent genomic data analyses. Other types of interaction or ontology data can also be incorporated into this approach.
Conclusions
We have developed a network-based analysis approach that integrated mRNA-seq gene expression profiles with molecular network and GO annotation to reveal dynamic propagation of 1α,25(OH)2D3-altered transcriptional changes from a few genes that
al-tered initially, to large groups of biologically coherent genes at later times. The most notable biological processes included calcium and iron metabolism, neuronal and ret-inal development, and generalized stress response. Such network-based integration ap-proach can be extended to other condition-dependent studies. Also graph theory can be incorporated to compare condition-specific coexpression networks and meta-flow networks of GO terms can be inferred based on such information.
Fig. 5Network of GO terms enriched in 1α,25(OH)2D3-specific co-expression links. Node color represent the
fraction of the gene in that node that were regulated by 1α,25(OH)2D3on any day (green is low and red is
high). Edge thickness and opacity represent the number of gene-gene links between two GO terms and significance score (−log10(P value)), respectively. Dotted line represents enriched co-expression relationships
Material and methods
mRNA-Seq gene expression data
The mRNA-Seq profiling in four biological replicate samples of 1α,25(OH)2D3- or
ethanol-treated zebrafish, 2, 4, 6 and 7 days post-fertilization (hpf ) was obtained by the Illumina HiSEQ 2000 platform. The generated 50-bp FASTQ sequence reads were aligned to both the latest Zebrafish genome assembly (zv9) and our in-house exon junction database using BWA [28]. The aligned sequence tags were counted for each annotated genes/exons using custom scripts based on the UCSC genome binning approach [29]. A total of 14267 genes were annotated using RefSeq data-base and the raw read counts for genes were generated for further downstream analyses.
Zebrafish molecular interaction network
The zebrafish molecular interaction network was downloaded from FunCoup database (http://FunCoup.sbc.su.se/). In total, there are 1,999,529 interactions between 13033 proteins in the zebrafish interactome downloaded on January 3rd, 2012.
Gene ontology annotation in zebrafish
The gene ontology annotation was downloaded from the original website (http:// www.geneontolgy.org/) on Januray 20th, 2012. In this paper, we used the biological process terms only since our goal is to identify the 1α,25(OH)2D3-altered mechanisms.
Differential gene expression analysis
For differential gene expression analysis between conditions, we eliminated genes with-out any reads across all samples. We used DESeq package in R to test for differential expression for all the remaining genes [22]. We conservatively accounted for multiple testing, employing a Bonferroni correction, and yielding an adjusted p-value for dif-ferential expression for each gene. A strict adjusted P value cut-off of 0.01 was used to select significant DEGs.
Construction of time-dependent GO-GO networks
A network of GO terms was generalized from the network of DEGs at different devel-opmental stages in zebrafish embryos. At GO scale, relations between nodes (repre-senting GO terms) are more statistically stable. Links reflect statistically enriched temporal connections between multiple genes in one specific GO term and multiple genes in another one. Thus, this GO-GO network highlights information flow be-tween GO biological processes affected by 1α,25(OH)2D3 at different developmental
stages. If there were a significant number of genes in GO term X first altered at one time point interacting with genes in GO term Y first altered on the next time point, we hypothesize that a causative relation exists X - > Y. We limited the network to only enriched GO-GO connections, i.e. one with significant more gene-gene interactions (given both genes were 1α,25(OH)2D3-altered) than expected by chance. This allows
us to focus on the major tendencies of propagation of 1α,25(OH)2D3 treatment and
approach yielded a much richer analysis for interpretation. The detailed reconstruc-tion step is as follows:
1) For any two GO terms, a link was counted if any two DEGs in these two GO terms were connected in the original FunCoup network;
2) The GO-GO links were classified into time-dependent patterns according to the days when the gene were differentially expressed for the first time:
a. Day 2 - > Day 4: one gene was differentially expressed on Day 2, while the other on Day 4;
b. Day 4 - > Day 6: similar definition as in (a); c. Day 6 - > Day 7: similar definition as in (a).
3) The GO For each candidate GO-GO network link, its statistical significance was evaluated by the permutation test, i.e. gene names were randomized in the FunCoup network for 10,000 times. The links between GO terms with P value less than 0.01 were considered statistically significant.
4) Enriched GO-GO links were kept in the GO-GO network, i.e. ones with P value less than 0.01. The network was visualized in the Cytoscape tool [30].
Construction of condition-specific co-expressed interaction networks
To obtain the condition-specific expression information, a network called the co-expressed interaction network (CEIN) was constructed. Correlation of gene expression profiles between each pair of interacting proteins in FunCoup was evaluated by Pearson correlation coefficient (PCC). PCC of paired genes Xand Y, which encodes one pair of interacting proteins, is defined as
PCC Xð ;YÞ ¼ 1 n−1
Xn
i¼1 Xi−X
σð ÞX
Yi−Y σð ÞY
ð1Þ
where nis the number of condition-specific samples; Xi and Yi is the expression level of gene X(Y) in the sample i under a specific condition (1α, 25(OH)2D3 or ethanol
treated); X (Y) represents average expression level of geneX (Y) andσ(X)σ(Y)) repre-sents the standard deviation of expression level of gene X (Y). Large absolute value of PCC indicates higher correlation between two gene pair evaluated. Besides correlation relationship, when applied to a pair of gene expression profiles, the experimental design allowed measuring effects of factors“1α, 25(OH)2D3treatment”,“developmental stage”,
and“gene”as well as any of their combinations. The procedure was executed under the terms of the standard 3-way factorial ANOVA. By combining PCC and ANOVA ana-lyses, we defined three types of coexpression networks:
1α, 25(OH)2D3–related coexpression network with strong correlation between observed gene expression profiles only after 1α, 25(OH)2D3treatment;
Ethanol–related coexpression network with strong correlation between observed gene expression profiles only in ethanol treatment;
The first two types of coexpression links were assigned if the following conditions hold:
maxðjPCCV D3j j;PCCethanoljÞ>minPCC ð2Þ
PCCV D3−PCCethanol
j j
maxðjPCCV D3j j;PCCethanoljÞ>
dif fPCC ð3Þ
minðFTREAT;FTREATGENE;FTREATGENEDAYÞ>Fα¼0:05;1;19 ð4Þ
where PCCVD3 refers to the PCC value for the 1 α, 25(OH)2D3-treated samples, and PCCethanolrefers to the PCC value for the ethanol-treated samples. Eq. (2) insures that at the least one of the PCC values exceed the threshold minPCC, while Eq. (3) requires that the difference between two PCC values in different conditions is big enough, i.e., larger than diffPCC. Eq. (4) states that at least one of the three effects from ANOVA analysis must be significant (i.e.P<0.05).
The third type of coexpression link was assigned given all the following conditions hold:
PCCall>fullPCC ð5Þ
FDAY >Fα¼0:05;3;19 ð6Þ
FDAYGENE <Fα¼0:2;3;19 ð7Þ
where PCCallrefers to the PCC value for all samples across all conditions, and fullPCC is the minimum PCC value for a link to be considered coexpressed. In this paper, we set the cutoff values 0.9, 0.6, 0.9 for minPCC,diffPCCandfullPCC.
Construction of condition-specific GO-GO networks
To generate the condition-specific GO-GO network view, a condition-specific network of GO categories was reconstructed. It was based on the genes that were involved in condition-specific network (e.g. 1α, 25(OH)2D3-sensitive coexpression network) and
assigned to at least one GO biological process. The reconstruction step is as follows:
1) For any two GO“biological process”categories, a link was counted if any two genes in these two GO categories were connected in the condition-specific coexpression network;
2) For each potential GO-GO network link, its statistical significance was evaluated by the permutation test, i.e. gene names were randomized in the co-expression network for 10,000 times. The links between GO biological process terms with P value less than 0.01 were considered statistically significant.
Enriched GO-GO links were kept in the GO-GO network, i.e. ones withP value less than 0.01. The network was visualized in the Cytoscape tool.
GoMiner analysis
Additional file
Additional file 1:A list of altered genes identified along with the days on which they were differentially expressed.(XLS 1332 kb)
Competing interest
The author declare that he has no competing interest.
Author’s contributions
YZ designed the computational approach, wrote the code, analysed the experimental results, and wrote the manuscript.
Acknowledgements
This project was supported by the National Cancer Institute grant P30 CA 134274–04 to the University of Maryland Baltimore Greenbaum Cancer Center.
Received: 24 December 2014 Accepted: 30 July 2015
References
1. DeLuca HF. Overview of general physiologic features and functions of vitamin D. Am J Clin Nutr. 2004;80(6 Suppl):1689S–96S.
2. Kumar R. Vitamin D and calcium transport. Kidney Int. 1991;40(6):1177–89.
3. Craig TA, Zhang Y, McNulty MS, Middha S, Ketha H, Singh RJ, et al. Research resource: whole transcriptome RNA sequencing detects multiple 1alpha,25-dihydroxyvitamin D(3)-sensitive metabolic pathways in developing zebrafish. Mol Endocrinol. 2012;26(9):1630–42.
4. Chen J, Aronow BJ, Jegga AG. Disease candidate gene identification and prioritization using protein interaction networks. BMC Bioinformatics. 2009;10:73.
5. Bar-Joseph Z. Analyzing time series gene expression data. Bioinformatics. 2004;20(16):2493–503. 6. Androulakis IP, Yang E, Almon RR. Analysis of time-series gene expression data: methods, challenges, and
opportunities. Annu Rev Biomed Eng. 2007;9:205–28.
7. Simon I, Barnett J, Hannett N, Harbison CT, Rinaldi NJ, Volkert TL, et al. Serial regulation of transcriptional regulators in the yeast cell cycle. Cell. 2001;106(6):697–708.
8. Hughes TR, Marton MJ, Jones AR, Roberts CJ, Stoughton R, Armour CD, et al. Functional discovery via a compendium of expression profiles. Cell. 2000;102(1):109–26.
9. Gasch AP, Spellman PT, Kao CM, Carmel-Harel O, Eisen MB, Storz G, et al. Genomic expression programs in the response of yeast cells to environmental changes. Mol Biol Cell. 2000;11(12):4241–57.
10. Ivanova NB, Dimos JT, Schaniel C, Hackney JA, Moore KA, Lemischka IR. A stem cell molecular signature. Science. 2002;298(5593):601–4.
11. Koh JL, Ding H, Costanzo M, Baryshnikova A, Toufighi K, Bader GD, et al. DRYGIN: a database of quantitative genetic interaction networks in yeast. Nucleic acids research. 2010;38(Database issue):D502–507.
12. Nickla H. Interaction between pteridine synthesis and riboflavin accumulation in Drosophila melanogaster. Can J Genet Cytol. 1972;14(1):105–11.
13. Barrasa MI, Vaglio P, Cavasino F, Jacotot L, Walhout AJ. EDGEdb: a transcription factor-DNA interaction database for the analysis of C. elegans differential gene expression. BMC Genomics. 2007;8:21.
14. Alexeyenko A, Schmitt T, Tjarnberg A, Guala D, Frings O, Sonnhammer EL. Comparative interactomics with Funcoup 2.0. Nucleic Acids Res. 2012;40(Database issue):D821–828.
15. Shionyu M, Yamaguchi A, Shinoda K, Takahashi K, Go M. AS-ALPS: a database for analyzing the effects of alternative splicing on protein structure, interaction and network in human and mouse. Nucleic Acids Res. 2009;37(Database issue):D305–309.
16. Jamieson DG, Gerner M, Sarafraz F, Nenadic G, Robertson DL. Towards semi-automated curation: using text mining to recreate the HIV-1, human protein interaction database. Database (Oxford). 2012;2012:bas023. 17. Kohn KW. Molecular interaction map of the mammalian cell cycle control and DNA repair systems. Mol Biol Cell.
1999;10(8):2703–34.
18. Anthony Romero F, Hastings NB, Moningka R, Guo Z, Wang M, Di Salvo J, et al. The discovery of potent antagonists of NPBWR1 (GPR7). Bioorg Med Chem Lett. 2012;22(2):1014–8.
19. Tang X, Wang J, Liu B, Li M, Chen G, Pan Y. A comparison of the functional modules identified from time course and static PPI network data. BMC Bioinformatics. 2011;12:339.
20. Ashburner M, Ball CA, Blake JA, Botstein D, Butler H, Cherry JM, et al. Gene ontology: tool for the unification of biology. The Gene Ontology Consortium. Nature Genet. 2000;25(1):25–9.
21. Marco A, Marin I. Interactome and Gene Ontology provide congruent yet subtly different views of a eukaryotic cell. BMC Syst Biol. 2009;3:69.
22. Anders S, Huber W. Differential expression analysis for sequence count data. Genome Biol. 2010;11(10):R106. 23. Zeeberg BR, Qin H, Narasimhan S, Sunshine M, Cao H, Kane DW, et al. High-Throughput GoMiner, an 'industrial-strength'
integrative gene ontology tool for interpretation of multiple-microarray experiments, with application to studies of Common Variable Immune Deficiency (CVID). BMC Bioinformatics. 2005;6:168.
24. Zhang Y, Xuan J, de los Reyes BG, Clarke R, Ressom HW. Network motif-based identification of transcription factor-target gene relationships by integrating multi-source biological data. BMC Bioinformatics. 2008;9:203. 25. Zhang Y, Xuan J, de los Reyes BG, Clarke R, Ressom HW. Reconstruction of gene regulatory modules in cancer cell
cycle by multi-source data integration. PLoS One. 2010;5(4):e10268.
27. Ben-Shoshan M, Amir S, Dang DT, Dang LH, Weisman Y, Mabjeesh NJ. 1alpha,25-dihydroxyvitamin D3 (Calcitriol) inhibits hypoxia-inducible factor-1/vascular endothelial growth factor pathway in human cancer cells. Mol Cancer Ther. 2007;6(4):1433–9.
28. Li H, Durbin R. Fast and accurate short read alignment with Burrows-Wheeler transform. Bioinformatics. 2009;25(14):1754–60.
29. Kent WJ, Sugnet CW, Furey TS, Roskin KM, Pringle TH, Zahler AM, et al. The human genome browser at UCSC. Genome Res. 2002;12(6):996–1006.
30. Smoot ME, Ono K, Ruscheinski J, Wang PL, Ideker T. Cytoscape 2.8: new features for data integration and network visualization. Bioinformatics. 2011;27(3):431–2.
Submit your next manuscript to BioMed Central and take full advantage of:
• Convenient online submission
• Thorough peer review
• No space constraints or color figure charges
• Immediate publication on acceptance
• Inclusion in PubMed, CAS, Scopus and Google Scholar
• Research which is freely available for redistribution