Software Defect Prediction Using Ensemble Learning: An ANP Based
Evaluation Method
*Abdullateef O. Balogun, Amos O. Bajeh,Victor A. Orie and Ayisat W. Yusuf-Asaju Department of Computer Science, University of Ilorin, Nigeria
{balogun.ao1|bajehamos|yusuf.aaw}@unilorin.edu.ng|[email protected]
Abstract— Software defect prediction (SDP) is the process of predicting defects in software modules, it identifies the modules that are defective and require extensive testing. Classification algorithms that help to predict software defects play a major role in software engineering process. Some studies have depicted that the use of ensembles is often more accurate than using single classifiers. However, variations exist from studies, which posited that the efficiency of learning algorithms might vary using different performance measures. This is because most studies on SDP consider the accuracy of the model or classifier above other performance metrics. This paper evaluated the performance of single classifiers (SMO, MLP, kNN and Decision Tree) and ensembles (Bagging, Boosting, Stacking and Voting) in SDP considering major performance metrics using Analytic Network Process (ANP) multi-criteria decision method. The experiment was based on 11 performance metrics over 11 software defect datasets. Boosted SMO, Voting and Stacking Ensemble methods ranked highest with a priority level of 0.0493, 0.0493 and 0.0445 respectively. Decision tree ranked highest in single classifiers with 0.0410. These clearly show that ensemble methods can give better classification results in SDP and Boosting method gave the best result. In essence, it is valid to say that before deciding which model or classifier is better for software defect prediction, all performance metrics should be considered. Keywords— Data mining, Machine Learning, Multi Criteria Decision Making, Software Defect Prediction
—————————— ——————————
1 I
NTRODUCTIONoftware engineering is an engineering discipline that is concerned with all aspects of producing software from the early stages of software specification through to maintaining the system after it has gone into use (Lan, 2009). In any area of software engineering, errors are mostly inescapable and they can lead to defects in software. Usually, during the development process, software defects are discovered during software testing (Hui, 2014). A software defect is an error or flaw in a software program or system that causes the production of an unwanted result. A software defect can also be the case when the final software product does not meet the customer requirement or user expectation (Aruna, Radhika, & Swathi, 2016). Defects can increase the cost of software development and decrease the overall quality of the software product. Over the years, researchers have developed classification models for the prediction of defects in software. Some studies showed that the use of ensemble methods are better than single classifiers in software defect prediction (Yi, Gang, Guoxun, Wenshuai, & Yong, 2011; Lessman, Baesans, Meus, & Pietsch, 2008), while some other works indicated that single classifiers perform better (Bowes, Hall & Petrić, 2017; Aleem, Capretz & Ahmed, 2015). This study is aimed at evaluating the performance of ensemble and classification models using Analytic Network Process (ANP) which is a multi-criteria decision-making technique.
The rest of this paper is organized as follows: Section 2 presents a review of related works. Section 3 discusses the theoretical background of the study. Thus, it presents the classifiers, feature selection method, ensemble methods and ANP. Section 4 presents the research method used in the experiment and analyzes the results. Section 5 presents results and discussion. Section 6 concludes the paper and presents some recommendations based on the results of the study.
* Corresponding Author
2 R
ELATED WORKSA lot of work has been carried out on software defect prediction; this section highlights research work involving defect prediction, feature selection, ensemble and Multi-criteria decision-making (MCDM). Aleem, Capretz & Ahmed (2015) in their study, covered different machine learning methods that can be used for defect prediction. The performance of different algorithms on various software datasets was analyzed. SVM and MLP techniques performed well on bug’s datasets. In order to select the appropriate method for bug’s prediction domain experts have to consider various factors such as the type of datasets, problem domain, uncertainty in datasets or the nature of the project.
Feature selection has also been applied by researchers to software defect prediction. Ghotra, McIntosh, & Hassan, (2017) studied 30 feature selection techniques and 21 classification techniques when applied to 18 datasets from the NASA and PROMISE corpora. Their results showed that a correlation-based filter-subset feature selection technique with a BestFirst search method outperforms other feature selection techniques across the studied datasets and across the studied classification techniques. They recommended the application of such a selection technique when building defect classification models.
Issam, Mohammad, & Lahouari, (2014), depicted the outcome of combining feature selection and ensemble learning on the performance of defect classification. They combined selected ensemble learning models with efficient feature selection on the datasets based on defect classification performance measures, the results of their study showed that features of a software defect dataset must be carefully selected for precise classification of defective modules.
In another study, Yi et al. (2010) incorporated a set of MCDM methods to rank classification algorithms, the study used four MCDM methods to rank 38 classification algorithms based on 13 evaluation criteria
over 10 public-domain software defect datasets. In their study, Boosted CART and Boosted C4.5 decision tree was ranked as the appropriate algorithms for software defect prediction.
3 L
EARNINGM
ODELS ANDT
ECHNIQUES3.1 FEATURE SELECTION TECHNIQUE
Feature selection is one of the techniques used in data preprocessing for data mining. Mining on a reduced set of attributes offers benefits as it reduces the number of attributes appearing in the extracted patterns (Asha, Jayaram, & Manjunath, 2010). The feature selection technique used in this study is Correlation-based Feature Selection Subset Evaluator (CfsSubsetEval). CfsSubsetEval evaluates the worth of a subset of features by considering the individual predictive ability of each feature along with the degree of redundancy between them, subsets of features that are highly correlated with the class while having low inter-correlation are preferred (Witten et.al, 2005). This work adopts the Greedy Step-wise algorithm as the search method to be used with CfsSubsetEval feature selection algorithm. The greedy step-wise algorithm searches greedily through the space of attribute subsets (Witten et al, 2005).
3.2 CLASSIFICATION MODELS
This study selects four classifiers to build ensembles. These classifiers represent three categories of classifiers (that is, Functions, Rules, and Trees). For functions category, Sequential Minimal Optimization (SMO) and Multilayer Perceptron (MLP) were selected, for Rules category, k-Nearest Neighbor (kNN) was selected while for Trees category, Decision tree (J48) was selected. SMO is a simple and proficient algorithm for solving the quadratic programming (QP) problem arising in support vector machines (SVM). Dissimilar to the past strategies, SMO chooses to solve the smallest possible optimization problem at every step and at every step, SMO chooses two Lagrange multipliers to jointly optimize, finds the optimal values for these multipliers (Keerthi & Gilbert, 2002). Multi-layer Perceptron (MLP) are feed-forward artificial neural networks which are a famous model for machine learning. MLP was developed to replicate learningand generalization abilities of humans with an attempt to model the functions of biological neural networks and they have many potential applications in the areas of Artificial Intelligence (AI) and Pattern Recognition (PR) (Ahmad & Nashat, 2012).
K-Nearest Neighbor classification classifies instances based on their similarities. It is a type of Lazy learning where the function is only approximated locally and all computation is deferred until classification. An object is classified by a majority of its neighbors. k is always a positive integer and the neighbors are selected from a set of objects for which the correct classification is known (Sandeep & Sharath, 2013). Decision Tree (C4.5) is a classification algorithm that belongs to the category of
Trees. Decision tree discovers the way the attribute vectors behave for various instances (Gaganjot & Amit, 2014). It is a tree in which each internal node corresponds to a decision, with a sub tree at these nodes for each possible outcome of the decision and the possible solutions of the problem correspond to the paths from the root to the leaves of the decision tree (Sandeep & Sharath, 2013).
3.4 ENSEMBLE METHODS
Ensemble methods combine a set of learners for data analysis. Ensemble learning is also called learning multiple classifier systems (Zhi-Hau, 2012). Several machine learning algorithms generate a single model (e.g. a decision tree or neural network), ensemble methods combine multiple models. Actually, ensemble methods are appealing mainly because they are able to boost weak learners to make an accurate prediction (Zhi-Hau, 2012). Ensemble learners are machine learning methods that leverage the efficiency of multiple models to achieve better accuracy than any of the individual models could on their own. This study considers four popular ensemble methods (i.e. Boosting, Bagging, Stacking, and Voting).
3.4 ANALYTIC NETWORK PROCESS
Analytic Network Process (ANP) is a multi-criteria decision-making technique for modeling real-life problems. ANP is a new theory that extends the Analytic Hierarchy Process (AHP) to cases of dependence and feedback. AHP is another multi-criteria decision-making technique that based on a top-down hierarchy and does not incorporate dependencies and feedback whereas ANP is represented by a network that incorporates both hierarchy and network.
The four steps of ANP as summarized by Saaty and Sagir (2009) is as follows:
Step 1: Model construction and problem structuring: The
problem should be stated clearly and decomposed into a rational system like a network. (that consists of the goal node, criteria’s or factors that contribute to the solution, and the alternatives which in this case are the algorithms).
Step 2: Pairwise comparisons and priority vectors: In
ANP, like AHP, pairs of decision elements at each cluster are compared with respect to their importance towards their control criteria by using a fundamental scale.
Step 3: Supermatrix formation: in this step, the human
judgments are converted to a matrix of relative priorities.
Step 4: Synthesis of the criteria and alternatives’
priorities and selection of the best alternatives: In this step, priorities are calculated for each alternative to determine their ratings and the alternative with the highest priority is rated as the best alternative.
Fig. 1:. Analytic Network Process
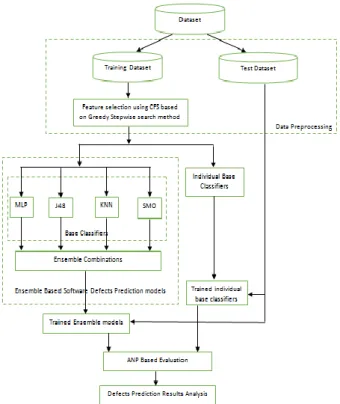
Fig. 2: Experimental Architecture
4 E
XPERIMENTALR
ESULTSThe experiment is aimed at comparing single classifiers and ensemble methods for software defect prediction using ANP for decision-making. This section presents the datasets and the experimental design.
4.1 DATA SOURCES
The datasets used in this study are 11 public-domain software defect datasets retrieved from NASA MDP repository. AR1, AR3, CM1, KC1, KC2, KC3, MC2, MW1, PC1, PC3, and PC4. Based on the experimental architecture in Figure 2, each of the data set will be analyzed based on 10-fold cross-validation; where the dataset will be divided into 10 subsets with 9 subsets
used for training the classifier and the remainder one subset for testing the model generated by the classifier. Before the training of the classifiers, the datasets will be pre-processed by CfsSubsetEval based on greedy stepwise approach.
4.2 PERFORMANCE EVALUATION METRICS
There are various measures for judging the efficiency of a classifier. For this study, 11 metrics will be considered which are as follows Accuracy, Precision, Recall, F-measure, Area Under Curve (AUC), Mean Absolute Error (MAE), TP-Rate, FP-Rate, Precision-Recall Curve (PRC), Kappa Statistics and Relative Mean Square Error (RMSE).
4.3 RESULTS AND DISCUSSION
Table 1 and Table 2 presents the average of the performance metrics of all learning models used over the 11 datasets. Table 1 presents the results of the learning models without performing Feature selection while Table 2 presents the results of the learning models with feature selection.
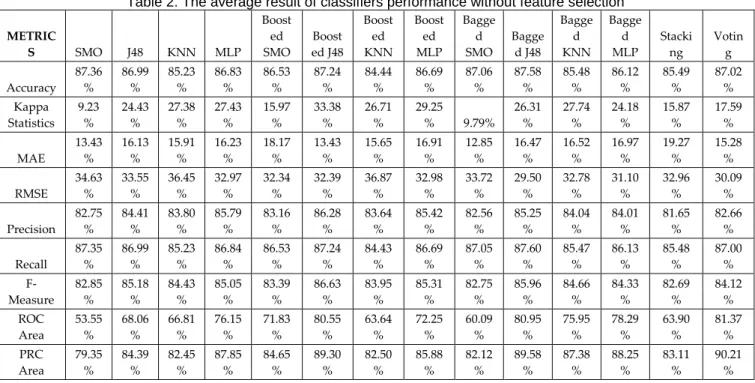
From Table 1, Bagged J48 gave the best accuracy result of 87.58% followed by SMO and Boosted J48 with 87.36% and 87.34% respectively. Based on AUC, the ensemble methods performed better than the single classifier with Voting Ensemble with 81.37% followed by Bagged J48 (80.95%) and Boosted J48(80.55%).
From Table 2, which is the result when feature selection is performed during preprocessing, Bagged J48 had the best accuracy with 89.27%, Bagged kNN had 88.37& and Bagged MLP had 88.37%. Using AUC metric, Voting had the best result of 80.09%, followed by Bagged J48 and Bagged MLP with 79.25% and 78.04% respectively. Based on these analyses and Tables (1 and 2), different performance metrics has different classifiers as the best classifier from the experiment. In order to get the best classifier considering all performance metrics, ANP will be used to rank the performance of the classifiers to get the best. Analytic network process (ANP) multi-criteria decision-making technique was applied to evaluate the performance of the models and select the best set of models. The Super Decision Tool is used for implementing ANP. Super decision is a decision-making software that implements Analytic Hierarchy Process (AHP) and Analytic Network Process (ANP). It has been used in many research and practical fields such as manufacturing, environmental management, aviation, small hydropower plants (Saracoglu & Omer, 2015).
Table 1. The average result of classifiers performance with feature selection METRI CS SMO J48 KNN MLP Booste d SMO Booste d J48 Booste d KNN Booste d MLP Bagge d SMO Bagge d J48 Bagge d KNN Bagge d MLP Stacki ng Votin g Accurac y 87.78 % 87.51 % 87.18 % 86.89 % 86.17 % 85.31 % 88.07 % 87.59 % 88.20 % 89.27 % 88.37 % 88.37 % 88.24% 87.93 % Kappa Statistics 9.99 % 20.78 % 22.14 % 21.68 % 15.58 % 25.10 % 23.10 % 24.13 % 8.43% 19.35 % 22.34 % 22.71 % 21.97% 18.54 % MAE 12.22 % 17.90 % 17.56 % 17.00 % 18.23 % 15.27 % 17.46 % 18.08 % 12.53 % 17.33 % 17.58 % 18.02 % 18.17% 16.25 % RMSE 34.23 % 32.25 % 40.25 % 31.77 % 31.24 % 34.01 % 40.32 % 33.66 % 33.75 % 31.05 % 34.54 % 31.20 % 30.95% 30.77 % Precisio n 82.29 % 85.16 % 82.91 % 83.91 % 82.41 % 85.97 % 83.08 % 84.26 % 81.33 % 84.34 % 83.55 % 84.71 % 85.54% 84.50 % Recall 87.78 % 87.43 % 82.99 % 86.88 % 87.17 % 85.87 % 83.03 % 86.44 % 87.75 % 86.65 % 83.37 % 86.80 % 88.24% 87.93 % F- Measure 83.06 % 84.08 % 82.75 % 84.52 % 83.77 % 83.81 % 82.86 % 84.62 % 83.02 % 84.37 % 82.85 % 84.67 % 85.15% 84.65 % ROC Area 53.65 % 64.14 % 66.16 % 77.12 % 73.76 % 74.16 % 62.14 % 70.61 % 57.70 % 79.25 % 73.94 % 78.04 % 62.68% 80.09 % PRC Area 79.48 % 82.54 % 82.23 % 87.81 % 86.14 % 85.68 % 80.96 % 85.55 % 81.54 % 88.16 % 86.33 % 88.53 % 83.17% 85.10 % Table 2. The average result of classifiers performance without feature selection
METRIC S SMO J48 KNN MLP Boost ed SMO Boost ed J48 Boost ed KNN Boost ed MLP Bagge d SMO Bagge d J48 Bagge d KNN Bagge d MLP Stacki ng Votin g Accuracy 87.36 % 86.99 % 85.23 % 86.83 % 86.53 % 87.24 % 84.44 % 86.69 % 87.06 % 87.58 % 85.48 % 86.12 % 85.49 % 87.02 % Kappa Statistics 9.23 % 24.43 % 27.38 % 27.43 % 15.97 % 33.38 % 26.71 % 29.25 % 9.79% 26.31 % 27.74 % 24.18 % 15.87 % 17.59 % MAE 13.43 % 16.13 % 15.91 % 16.23 % 18.17 % 13.43 % 15.65 % 16.91 % 12.85 % 16.47 % 16.52 % 16.97 % 19.27 % 15.28 % RMSE 34.63 % 33.55 % 36.45 % 32.97 % 32.34 % 32.39 % 36.87 % 32.98 % 33.72 % 29.50 % 32.78 % 31.10 % 32.96 % 30.09 % Precision 82.75 % 84.41 % 83.80 % 85.79 % 83.16 % 86.28 % 83.64 % 85.42 % 82.56 % 85.25 % 84.04 % 84.01 % 81.65 % 82.66 % Recall 87.35 % 86.99 % 85.23 % 86.84 % 86.53 % 87.24 % 84.43 % 86.69 % 87.05 % 87.60 % 85.47 % 86.13 % 85.48 % 87.00 % F- Measure 82.85 % 85.18 % 84.43 % 85.05 % 83.39 % 86.63 % 83.95 % 85.31 % 82.75 % 85.96 % 84.66 % 84.33 % 82.69 % 84.12 % ROC Area 53.55 % 68.06 % 66.81 % 76.15 % 71.83 % 80.55 % 63.64 % 72.25 % 60.09 % 80.95 % 75.95 % 78.29 % 63.90 % 81.37 % PRC Area 79.35 % 84.39 % 82.45 % 87.85 % 84.65 % 89.30 % 82.50 % 85.88 % 82.12 % 89.58 % 87.38 % 88.25 % 83.11 % 90.21 %
In this study, the decision problem is to select the best method for the task of software defect prediction. The first step of the ANP process is to construct the problem into a network structure. As shown in Figure 3, the first node is the goal node, the goal is to select an algorithm that is superior to other algorithms in software defect detection through the comparison of a set of performance measurements. The second cluster contains the criteria and they are the performance measures such as accuracy, precision and recall. The third cluster consists of the alternatives and they are the ensemble algorithms and classification algorithms described earlier. There are two links (bi-directional arrow) between the criteria cluster and alternative cluster, this means that the alternatives (algorithms) are compared with respect to each criterion (performance measure) and that the criteria are compared with respect to each
alternative (algorithm)-this indicates feedback that ANP incorporates.
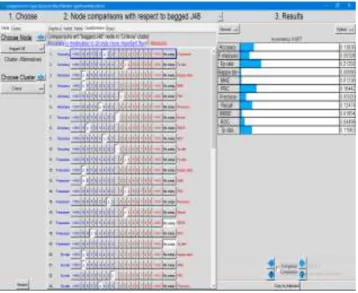
According to Figure 4, criteria are compared with each other with respect to each alternative and alternatives are compared with each other with respect to each criterion.
Fig. 4: ANP Pairwise Comparison
Studies have proven that the AUC is the most informative and objective measurement of predictive accuracy (Yi et al, 2011) and is an extremely important measure in software defect prediction. Therefore, it is assigned a number of 9. The F-measure, PRC, Mean Absolute Error, and Overall Accuracy are very important measures, but less important than the AUC so they are assigned the value of 7 (Yi et al, 2011). The true positive rate (TPR), false positive rate (FPR), precision, recall, and Kappa statistic are strongly important classification measures that are less important than the F-measure, mean absolute error, and overall accuracy (Yi
et al, 2011), so they are assigned the value of 5. Root
mean square error is assigned the value of 3.
The third step of ANP computes the supermatrix after pairwise comparisons. The supermatrix generation used the weighted supermatrix approach, which is obtained by multiplying all the elements in a component of the unweighted supermatrix by the corresponding cluster weight.
Table 3 computes the priorities of each of the alternatives and generates a ranking of all ensembles in descending order from top to bottom. From Tables 1 and 2, it was observed that application of feature selection method to datasets increases the performance of learning models. Also from the analysis, it is evident that based on the performance metrics used for this study, no particular classifier or ensemble method gave the best result across all performance metrics used. With the application of ANP, Boosted SMO and Voting ensemble methods had the highest priority (0.0493) after considering all the performance metrics, closely followed by Stacking. This is due to fact that ensemble usually considers multiple options for building a model, unlike the individual classifier. At the same time, Decision tree also has a
priority level (0.0410) which is better than Bagging ensembles. kNN was the least on the ranking.
Table 3. Priority Ranking of Classifiers and Ensembles Algorithms Priorities 1 Boosted SMO 0.0493 2 Voting 0.0493 3 Stacking 0.0445 4 J48 0.0410 5 Bagged MLP 0.0402 6 Bagged J48 0.0400 7 MLP 0.0400 8 SMO 0.0395 9 Bagged SMO 0.0385 10 Boosted MLP 0.0338 11 Boosted J48 0.0289 12 Bagged KNN 0.0230 13 KNN 0.0164
5 C
ONCLUSION ANDF
UTUREW
ORKSObserving that results using different performance measures over different datasets may vary, this study introduced the ANP method, a multi-criteria decision making approach, to derive the priorities of ensemble and single classifiers for software defect prediction. We evaluated four ensemble methods (Bagging, Boosting, Stacking and Voting) and four classification algorithms using 11 performance metrics over 11 software defect datasets. The results from this study showed that the use of feature selection for pre-processing helps generate better result though caution needs to be exercised in selecting the appropriate feature selection for a classification process. In addition, the results revealed that the percentage of accuracy only should not be used to judge the performance of a classifier or a model in software defect prediction. Other performance metrics should be considered in selecting the best or appropriate classifier or model for software defect prediction. With the clear positive effect of adopting MCMD in evaluating the results in software defect prediction, this work will be extended in the future by looking into the complexity of the MCDM techniques in other to build an adaptive MCDM for software defect prediction.
A
CKNOWLEDGMENTThe authors wish to thank the reviewers of this article for their comments and corrections.
R
EFERENCESAhmad, A. K., & Nashat, M. (2012). Metaheuristic Optimization Algorithms for Training Artificial Neural Networks. International Journal of Computer and Information Technology, 1(2) 1-6.
Aleem, S., Capretz, L. F. & Ahmed, F. (2015). Comparative Performance Analysis of Machine Learning Techniques For
Software Bug Detection‖, ITCS, CST, JSE, SIP, ARIA, DMS – 2015 pp. 71–79.
Aruna, S., Dilsha, D., Radhika, R., & Swathi, J. N. (2016). Cost Sensitive Classification and Feature Selection for Software Defect Prediction. International Journal of Advanced Research in Computer Science and Software Engineering.6(4), 1-2.
Asha, G. K., Jayaram, M. A., & Manjunath, A. S. (2010). Feature Subset Selection Problem using Wrapper Approach in Supervised Learning. International Journal of Computer Applications. 1(7), 1-2.
Bowes, D., Hall, T. & Petrić, J. (2017). Software Defect Prediction: Do Different Classifiers Find The Same Defects?. Software Quality Journal, Springer. pp 1-28.
Gaganjot, K., & Amit, C. (2014). Improved J48 Classification Algorithm for the Prediction of Diabetes. International Journal of Computer Applications. 98(22), 1-5.
Ghotra, B., McIntosh, S., Hassan, A. E. (2017). A Large-Scale Study of the Impact of Feature Selection Techniques on Defect Classification Models", Proc. of the International Conference on Mining Software Repositories (MSR), pp. 146-157, 2017.
Hui (2014). Software Defect Classification Prediction Based on Mining Software Repository, Department of Information Technology, Uppsala University, Sweden.
Issam H. L., Mohammad., & Lahouari G. (2014) Software defect prediction using ensemble learning on selected features. Information and Software Technology. Information. Vol. 58, pp. 388-402.
Keerthi, S.S.; Gilbert, E.G.; (2002). "Convergence of a Generalized SMO Algorithm for SVM Classifier Design." Machine Learning 46 (1-3): 351-360.
Lan Sommerville (2009). Software Engineering, 8th Edition, Addison-Wesley Longman Publishing Co., Inc. Boston, MA, USA, ISBN:0321313798
Lessmann S., Baesens B., Mues C., & Pietsch S. (2008). Benchmarking classification models for software defect prediction: A proposed framework and novel findings, IEEE Transactions on Software Engineering 34(4) 485–496.
Saaty, T. L. & Sagir, & M. (2009) Extending the measurement of tangibles to intangibles. International Journal of Information Technology & Decision Making, 8(1), 7–27.
Sandeep K. P., & Sharath C.S.P., (2013). A Survey of different classification techniques and their comparison using Mc Nemar’s Test. Department of Computer Science and Engineering, National Institute of Technology Rourkela, Rourkela, India.
Saracoglu, & Omer B., (2015). An AHP Application in the investment selection problem of small hydropower plants in turkey. International Journal of the Analytic Hierarchy Process 7(2).
Super decision tool (2017). https://www.superdecisions.com/ Witten I. H., & Frank E.(2005) Data Mining: Practical Machine
Learning Tools and Techniques. 2nd Edition .San Francisco: Morgan Kaufmann Publishers; 2005:560. ISBN 0-12-088407-0
Yi P., Gang K., Guoxun, Wenshuai W., & Yong S. (2011). The ensemble of Software Defect Predictors: AnAHP-Based Evaluation Method. International Journal of Information Technology and Decision Making, 10(1), 2-11.
Zhi-Hua, Z. (2012). Ensemble Algorithm: Foundations and Algorithm. Microsoft Research Limited. Cambridge, UK.