DDAG K-TIPCAC: an ensemble method for
protein subcellular localization
A. Rozza, G. Lombardi, M. Re, E. Casiraghi, and G. Valentini Dipartimento di Scienze dell’Informazione, Universit`a degli Studi di Milano,
Via Comelico 39-41, 20135 Milano, Italy [email protected], WWW home page: http://security.dico.unimi.it/∼fox721/
Abstract. Protein subcellular location prediction is one of the most difficult multiclass prediction problems in modern computational biology. Many methods have been proposed in the literature to solve this problem, but all the existing approaches are affected by some limitations. In this contribution we propose a novel method for protein subcellular location prediction that performs multiclass classification by combining kernel classifiers through DDAG. Each base classifier, calledK-TIPCAC, projects the points on a Fisher subspace estimated on the training data by means of a novel technique. Experimental results clearly indicated that DDAG K-TIPCACperforms equally, if not better, than state-of-the-art ensemble methods for protein subcellular location.
Keywords: Bioinformatics, protein subcellular location prediction, Fisher subspace, ensemble of classifiers.
1
Introduction
Since many different protein molecules are present in one or more subcellular locations, a better understanding of their distribution and function is advisable to understand the complex biological systems that regulate the biological life of each cell. To this aim, the first and fundamental problem to be solved is the sub-cellular protein localization. Since biochemical experiments aimed at this task are both costly and time-consuming, and new proteins are continuously discov-ered (increasing the gap between the newly found proteins and the knowledge about their subcellular location), an efficient and effective automatic method for protein subcellular location prediction is required.
This problem can be formulated as a multiclass classification problem as fol-lows. The training dataset,PT rain, is composed ofN protein vectors,PT rain=
{pi}Ni=1, where each protein sequence can be represented as a vector p= [Rjs],
Rj
s being the amino acid residue whose ordered position in the sequence is
s = 1,· · ·, S (S is the protein length, which differs in each protein), while the superscript j = 1, . . . ,20 indicates which native amino acid is present in thes-th position of the sequence. The proteins in PT rain are classified into M
subsets S =SM
i=1Si, where each subset, Sm (m = 1,2, . . . , M), is composed
|S|=N =N1+N2+· · ·+NM. The classifier’s aim is to learn the information
provided byPT rainto predict the subcellular location of a query proteinpq.
In the past decade many authors have tried to handle this problem, and several classification methods have been proposed [11]. Nevertheless, the problem is still open due to several difficulties that make the task of protein subcellular location prediction very challenging. At first, the protein data are usually encoded with high dimensional vectors, so that the employed classifiers should be designed in order to minimize the computational complexity. Secondly, the number of sub-cellular locations that should be discriminated is at most 22 (that is M ≤22), and some proteins, called multiplex proteins, might be present in more than one cellular component, or they might move from one location to another. Finally, the protein subcellular distribution is highly unbalanced since some cellular com-ponents contain a significantly lower number of protein molecules. To achieve satisfactory results in such (multiclass, high dimensional, and highly unbalanced) classification problem, a dataset of high cardinality is needed. Unfortunately, the training datasets have a limited number of proteins, due to the following reasons: some proteins must be discarded since they contain less than 50 amino acids, or they are annotated as ‘fragments’; to avoid homology bias proteins with≥25% sequence identity to any other in the same subcellular organelle must be elimi-nated; proteins belonging to components with less than 20 proteins are generally excluded, because of lacking statistical significance; several proteins cannot be used as robust data for training a solid predictor since they have not been exper-imentally annotated yet. Finally, further deletions might be performed by some authors focusing on proteins with a unique subcellular location, or belonging to a specific organism. These difficulties motivate the large number of research works devoted to the task of protein location prediction; these methods can be grouped according to either the data representation, or the employed algorithm. Representing a proteinpwith a vector that codes its entire amino acid sequence is unfeasible since this representation produces too long vectors of different di-mensionality. A more compact representation is provided by the amino acid composition (AAC) descriptor [6], whose elements are the normalized occurrence frequencies of the 20 native amino acids. Since theAAClacks the ability of repre-senting the sequence order effects, several alternative non sequential descriptors have been proposed in the literature. More precisely, these descriptors represent both single and evolutionarily related groups of proteins: PseAAC) encodes pro-teins by taking into account correlations between pairs of aminoacids at different sequence distance w.r.t a given chemico-physical property [7]; thek-peptide en-coding vector, which is the normalized occurrence of the k-letter pattern that appears in a window being shifted along the sequence, is another popular rep-resentation for single proteins [21]; evolutionarily related groups of proteins can be encoded through theSeqEvorepresentation, based on the normalized occur-rence of the changes in the protein sequence for each native amino acid (that is insertions, deletions, substitutions of amino acid residues) that are due to pro-teins evolution [13]. While the aforementioned protein representation schemes are all strictly based on the protein amino acid sequence, alternative encodings
are possible by considering the availability of large amount of information con-tained in public databases like the Functional Domain (FunD) [8] and the Gene Ontology (GO) [1]. According to the content of FunD it is possible to code each proteins in the form of a boolean vector indicating the presence/absence of any of the 7785 functional protein domains annotated in the database and a similar encoding scheme can be adopted by considering the annotations stored in the Cellular Component division of the Gene Ontology.
Regarding the employed predictors, they are: the Covariant Discriminant (CD) algorithm [7]; modified versions of the K-Nearest-Neighbor (KNN) technique [15, 21, 29], or its extension, called Optimized Evidence-TheoreticKNN(OET-KNN) [33, 10], Support Vector Machines (SVMs) [14, 22, 18], and the naive Bayes classifier [3]. All the aforementioned methods are depending on critical parameters, defining both the protein representation mode, the dataset dimensionality, and different settings of the learning algorithm. Recently, simple ensemble methods have been proposed: given an engine learning algorithm (e.g.OET-KNNorSVM), these tech-niques create different predictors by changing the values of their parameters, and produce the final classification result by a simple majority vote algorithm [10, 31, 13].
Although promising results have been obtained, the computational efficiency and the classification performance of all the above mentioned techniques are highly affected both by the high unbalancing of the training set, and by the low car-dinality of some classes compared to the high data dimensionality. To overcome such weaknesses, in this paper we propose our ensemble method whose engine al-gorithm, hereafter referred as Kernel Truncated Isotropic Principal Component Analysis Classifier (K-TIPCAC,see Section 2), is an evolution of theK-IPCACand theO-IPCACalgorithms [26, 28], which project the points on the Fisher subspace estimated by a novel technique on the training data (see Section 2). The ensemble method combines the results computed by differentK-TIPCACpredictors through a Decision Directed Acyclic Graph (DDAG) technique [24]. Experimental results and the comparison to existing techniques, reported in Section 4, demonstrate the effectiveness of the proposed method.
2
IPCAC, O-IPCAC, and K-TIPCAC
The first version of O-IPCAC, calledIPCAC, has been initially proposed in [26]. It is a binary classifier exploiting theoretical results presented in [4] to efficiently estimate the Fisher subspace (Fs). More precisely, in [4] it is demonstrated that, given a set ofNclustered points sampled from an isotropic Mixture of Gaussians, Fscorresponds to the span of the class means; as a consequence, when a binary classification problem is considered,Fsis spanned by unit vectorf = µA−µB
||µA−µB||,
beingA andB the two classes, andµA/B the class means.
IPCAC exploits this result by whitening the training set PT rain, computing f,
and classifying a new pointpas follows:
θ((WDTf)·p−γ) =θ(w·p−γ) ; γ= * argmax ¯ γ∈{w·pi}N i=1 Score(¯γ) + (1)
where θ(x) = A if x≥ 0,θ(x) = B if x < 0, the matrix WD represents the
whitening transformation estimated on the N training points, Score(¯γ) com-putes the number of correctly classified training points when ¯γis used as thresh-old, andh·irepresents the average operator (we may have multiple ¯γ correspond-ing to the maximum of the Scorefunction).
Unfortunately, the high computational complexity of classifiers based on the estimation of Fsprevents their application to high dimensional datasets. More-over, these techniques often fail when the training-set cardinality is equal or lower than the space dimensionality. To address these problems, O-IPCAC (On-lineIPCAC) [28] improvesIPCAC, and reduces the computational complexity, by replacing the first step of data whitening by a ‘partial whitening’ process; if the points to be classified belong to aDdimensional space, this method whitens the data in the linear subspaceπd=Spanhv1,· · ·,vdi, spanned by the firstd≪D
principal components, while maintaining unaltered the information related to the orthogonal subspace (πd)⊥=Spanhvd+1,· · ·,vDi.
More precisely, the linear transformation WD representing the partial
whiten-ing operator is estimated as follows. The Truncated Swhiten-ingular Value Decomposi-tion [19] is applied to estimate the firstd=min(log2
2N, D) principal components,
obtaining the low-rank factorizationP ≃UdQdVdT (whereP is the matrix
rep-resenting the training setPT rain since it contains the training vectors). Thed
largest singular values on the diagonal of Qd, and the associated left singular
vectors, are employed to project on the subspaceSPd, spanned by the columns
ofUd, and to perform the whitening on the points contained inP:
¯ PWd=qdQ− 1 d P⊥SPd=qdQ −1 d U T dP =WdP
where qd is the smallest singular value of the points projected in SPd. Note
that, to obtain points whose covariance matrix best resembles a multiple of the identity, we have chosen to set the value of the d largest singular values to qd instead of 1, thus avoiding the gap between the d-th and the (d+ 1)-th
singular value. The obtained matrixWd projects and whitens the points in the
linear subspace SPd; however, dimensionality reduction during the whitening
estimation might delete discriminative information, decreasing the classification performance. To avoid this information loss, we add to the partially whitened data the residualsRof the points inP with respect to their projections onSPd:
R=P −UdP⊥S Pd=P−UdU T dP ¯ PWD =UdPWd¯ +R= ` qdUdQ− 1 d U T d +I−UdUdT ´ P =WDP (2)
whereWD∈ ℜD×D represents the linear transformation that whitens the data
along the firstdprincipal components, while keeping unaltered the information along the remaining ones.
In case of binary classification problems, once the partial whitening step has been performed the two whitened class means, and the vector f representing the estimated Fs in the partially whitened space, are computed; this allows the binary predictor to compute the class labels by employing the procedure described in [27].
The described approach increases the performance and guarantees a greater sta-bility during the classification task. We note thatO-IPCAChas been implemented
to perform both batch and online training. For convenience, in this contribution, we refer to the batch method as TIPCAC(Truncated-whiteningIPCAC).
A Kernel version of TIPCAC.
To relax the linear separability constraint imposed by the IPCAC algorithm, it is possible to exploit the kernel trick as in the Kernel Principal Component Analysis [32], thus obtaining the Kernel IsotropicPCAClassifier (KIPCAC, [26]). More precisely, Rozza et al. demonstrate that a given point pcan be projected onFsin the kernel space as follows:
projF(p) =K er(p)T “
(NANB) 1
2A˜Λ˜−1A˜TNA−|1B”=K er(p)Tw (3) whereNis the cardinality of the training set,Ker(p) ={KerF unction(pi,p)}Ni=1
is the vector of the kernel values computed between the pointpand the set of the training pointspi, Λ˜are the eigenvalues obtained by the decomposition of the
kernel matrix, A˜ are the associated eigenvectors, NA, NB are the cardinalities
of the two classes, andN−1
A|B= NA−1· · · | {z } NAtimes −NB−1· · · | {z } NBtimes !T .
In this work we extend this method by exploiting the same concept at the ba-sis of the TIPCAC partial whitening step. More precisely, we select the largest eigenvalues that represent a fixed amount of variance defined a-priori, and we set the remaining part of the spectrum to 1; this process reduces the overfitting problems produced by the smallest part of the spectrum without performing any kind of dimensionality reduction.
3
Experimental setting
3.1 Dataset
We evaluated the proposed method on a publicly available dataset1 involved in
the training of theEukP-locmethod described in [12].
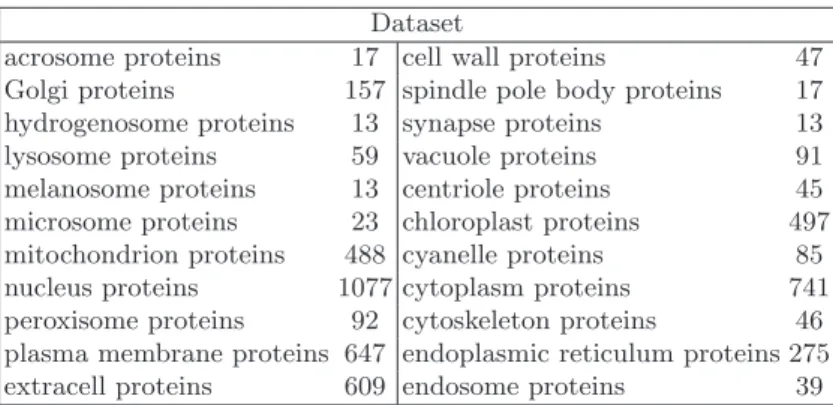
This dataset contains 5.618 different proteins, classified into 22 eukaryotic sub-cellular locations. Among the 5.618 considered proteins, 5.091 belong to one subcellular location, 495 to two locations, 28 to three locations, and 4 to four locations. None of the proteins has ≥ 25% sequence identity to any other in the same subset. The collection of sequences was then evaluated to compute the Pseudo Amino Acid compositions (PseAAC) of each protein using the PseAAC web server [30]. For each protein we produced a 495-elements vector composed by 20 numbers describing the standard amino acid composition, 400 values rep-resenting the PseAAC based on the dipeptide representation of the protein and further 75 values representing three groups of 25PseAACsvalues obtained by set-ting theλparameter to 25 and computing thePseAACsbased on three pairs of chemico-physical properties: Hydrophobicity-Hydrophilicity,pK1(alpha-COOH )-pK2 (NH3) and Mass-pI. In this preliminary investigation we focused on the location prediction of the 5091 proteins with a single experimentally annotated subcellular location. Some characteristics of this dataset are depicted in Table 1.
1
The protein sequences were downloaded in fasta format from the web site http://www.csbio.sjtu.edu.cn/bioinf/euk-multi/Supp-A.pdf.
It is worth noting that the problem is highly unbalanced, ranging the num-ber of proteins associated to a subcellular location from 13 (hydrogenosome, melanosome and synapse) to 1077 (nucleus).
Table 1. Protein subcellular localization prediction dataset (5091 proteins and 22 locations). This table reports the number of annotated proteins per location; labels are mutually exclusive, thus the problem is multiclass but not multilabel.
Dataset
acrosome proteins 17 cell wall proteins 47 Golgi proteins 157 spindle pole body proteins 17 hydrogenosome proteins 13 synapse proteins 13 lysosome proteins 59 vacuole proteins 91 melanosome proteins 13 centriole proteins 45 microsome proteins 23 chloroplast proteins 497 mitochondrion proteins 488 cyanelle proteins 85 nucleus proteins 1077 cytoplasm proteins 741 peroxisome proteins 92 cytoskeleton proteins 46 plasma membrane proteins 647 endoplasmic reticulum proteins 275 extracell proteins 609 endosome proteins 39
3.2 Methods
DecisionDAG K-TIPCAC:In Section 2 an efficient binary classifier (TIPCAC) and its kernel version (K-TIPCAC) are described, that are based on the projection of the data on the one dimensionalFsestimated in a partially whitened subspace. The ensemble classifier proposed in this paper is aC-class classifier that projects the data on aC−1 dimensionalFsestimated in a partially whitened subspace, and then combines many binary K-TIPCACs to obtain the final prediction. More precisely, the first step of this method evaluates the Fs of the overall
C classes by generalizing the approach used by TIPCAC; accordingly to what observed in the previous work [28], this step reduces the training time com-plexity. To this aim, after the partial whitening of the data, the whitened class means {µc}Cc=1 are computed: µc = WDµˆc = qdUdQ−
1
d U T
dµˆc+µˆc−UdUdTµˆc,
and the orthonormal basis,ΠC−1, composed of C−1 vectors spanning theFs,
is computed by orthonormalizing the C −1 linearly independent µc vectors
through the Gram-Schmidt procedure. The partially whitened training points
PW
D are then projected on the subspace ΠC−1, obtaining the set of points
PΠ C−1= ˘ F STp i|pi∈PWD ¯
, where F S is the matrix whose columns spanFs. Exploiting the points in PΠ
C−1, C(C−1)/2 K-TIPCAC binary classifiers are
trained, each discriminating two classes in a one-against-one fashion (1-vs-1), and their results are combined by means of the Decision Directed Acyclic Graph (DDAG) approach [24].
Support Vector Machine (SVM): SinceSVM is a binary classifier, a problem transformation is required before the application of this method to the consid-ered multiclass prediction problem. The existing approaches to cast a multiclass classification problem to a series of binary classification problems can be roughly divided into two main classes:one-against-all and 1-vs-1. We applied the latter,
and thus we trained a committee of 231 probabilisticSVMs [23]. The probabili-ties produced by each classifier were then reconciled to a multiclass prediction via pairwise coupling [20] and a simple max rule over all the class probability estimates was applied to make a final decision.
Ensemble of nested dichotomies (END): Nested dichotomies [17] is a stan-dard statistical technique applied in polytomous classification problems where logistic regression is applied by fitting binary logistic regression models to the internal nodes composing a tree. In absence of domain knowledge it is difficult to decide, among all the possible trees of nested dichotomies, the one to be adopted. A possible solution [16] is to consider all the hierarchies of nested dichotomies equally likely, and to use an ensemble of these hierarchies for prediction. In our experiments we used the END implementation provided in WEKA and we tuned acrossnd(number of dichotomies)∈ {5,10,20,40}.
Random Forest (RF):Random Forest [2] has been applied as an effective tool for biomolecular and bioinformatics research. This method grows many classifi-cation trees. Instances whose class needs to be predicted are classified using the trees composing the forest. Each tree computes its own prediction, and the forest employs a plurality voting (over all the trees in the forest) to choose the final classification. We tuned the method using a grid search overnt(number of trees of the forest)∈ {10,20,30,40,50}andnf (number of features)∈ {10,100}.
Performance evaluation:All the compared methods were evaluated according to a canonical 10 fold stratified cross-validation scheme. Given that the consid-ered problem is a multiclass prediction problem affected by severe unbalance, accuracy is not suitable for performance evaluation. Performances were thus collected in form of F-score (harmonic mean of Precision and Recall). All the experiments, apart those involving theDDAG K-TIPCAC, which is implemented in MATLAB, were performed using theWEKAmachine learning library [34].
4
Results
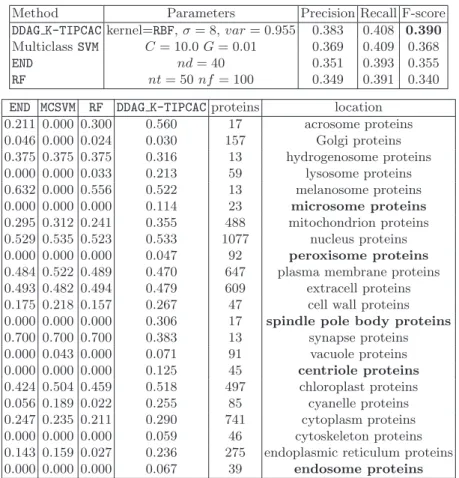
The performances achieved by the evaluated approaches averaged across all the classes are reported in Table 2 (top). The table shows, for each method, the best combination of parameters, Precision, Recall and F-measure. The F-scores obtained by the evaluated methods for each subcellular location averaged across the 10 stratified cross validation folds are reported in Table 2 (bottom). In order to investigate if the differences between the collected per class performances are statistically significant we performed a Wilcoxon signed ranks sum (U) test. Results are reported in Table 3 (direction of the comparison is row-vs-column). Considering the performances averaged across all the classes achieved by the compared ensemble methods (see Table 2 (top)) the best performing approach is DDAG K-TIPCAC(weighted F-score 0.390) immediately followed by the 1-vs-1 ensemble of SVMs (weighted F-score 0.368). A closer look to this table highlights that, while all the evaluated approaches produced comparable Recall scores, on average this comes at the cost of a reduced precision, the only exception being represented by the DDAG K-TIPCAC ensemble. We note that input space
Table 2. Estimated performances (top table) and per class performances (bottom table) obtained by 10 fold stratified cross validation.
Method Parameters Precision Recall F-score DDAG K-TIPCACkernel=RBF,σ= 8,var= 0.955 0.383 0.408 0.390 MulticlassSVM C= 10.0G= 0.01 0.369 0.409 0.368
END nd= 40 0.351 0.393 0.355
RF nt= 50nf= 100 0.349 0.391 0.340 END MCSVM RF DDAG K-TIPCACproteins location
0.211 0.000 0.300 0.560 17 acrosome proteins 0.046 0.000 0.024 0.030 157 Golgi proteins 0.375 0.375 0.375 0.316 13 hydrogenosome proteins 0.000 0.000 0.033 0.213 59 lysosome proteins 0.632 0.000 0.556 0.522 13 melanosome proteins 0.000 0.000 0.000 0.114 23 microsome proteins 0.295 0.312 0.241 0.355 488 mitochondrion proteins 0.529 0.535 0.523 0.533 1077 nucleus proteins 0.000 0.000 0.000 0.047 92 peroxisome proteins 0.484 0.522 0.489 0.470 647 plasma membrane proteins 0.493 0.482 0.494 0.479 609 extracell proteins 0.175 0.218 0.157 0.267 47 cell wall proteins 0.000 0.000 0.000 0.306 17 spindle pole body proteins 0.700 0.700 0.700 0.383 13 synapse proteins 0.000 0.043 0.000 0.071 91 vacuole proteins 0.000 0.000 0.000 0.125 45 centriole proteins 0.424 0.504 0.459 0.518 497 chloroplast proteins 0.056 0.189 0.022 0.255 85 cyanelle proteins 0.247 0.235 0.211 0.290 741 cytoplasm proteins 0.000 0.000 0.000 0.059 46 cytoskeleton proteins 0.143 0.159 0.027 0.236 275 endoplasmic reticulum proteins 0.000 0.000 0.000 0.067 39 endosome proteins
Table 3.Statistical comparison of per class performances through Wilcoxon test (al-ternative hypothesis: “greater”, direction of comparison: rows versus columns).
END MCSVM RF DDAG K-TIPCAC
END − 0.6876 0.1317 0.9970
MCSVM 0.3375 − 0.1813 0.9950
RF 0.8826 0.8348 − 0.9874
DDAG K-TIPCAC2.689E−05
3.073E−05
4.449E−05
−
reduction is present in our approach and also in other types of ensemble evaluated in this experiment, as in the case of Random Forests. Nevertheless, the space reduction computed by RF might be affected by a more relevant information loss, since the input space dimensionality is reduced by means of a random selection of subsets of features of a priori defined size. We can hypothesize that the data transformation applied by our approach is able to produce a more informative representation of the data than feature selection, thus leading to better performances also in highly unbalanced multiclass classification problems as the one involved in our experiments.
This interpretation is supported by the collected per class performances (see Ta-ble 2 (bottom)). As we can see, despite the multiclass SVM ensemble (MCSVM)
ranks second in terms of overall F-score (after a weighted averaging of the per class F-scores), its performances are often worse that those obtained by DDAG K-TIPCAC. The hypothesis that the performances, on a per class basis, of DDAG K-TIPCACare better than those produced by all the other evaluated methods is also supported by the Wilcoxon signed ranks sum test (see Table 3).
5
Conclusions
In this contribution we evaluated the performances of an ensemble of K-TIPCAC classifiers in proteins subcellular location prediction. We demonstrated that the multiclass version of K-TIPCACis competitive with state-of-the-art methods in one of the most difficult unbalanced multiclass classification problems in bioin-formatics. It is worth noting that the ability of the proposed approach to effec-tively control the precision-recall trade-off also in the prediction of small classes is of paramount importance in real applications, when we need to reduce the costs associated with the biological validation of new protein locations discov-ered through in silico methods.
Considering that F-score accounts both for precision and recall and that most of the compared methods failed completely to predict the membership of proteins to particularly difficult subcellular locations (reported in bold-face in Table 2), we conclude thatDDAG K-TIPCACis a promising line of research in this application domain and we plan both to extend the proposed approach, and to provide a deeper characterization of its performances in further investigations.
Acknowledgement
The authors would like to thank Professor Paola Campadelli for her invaluable support.
References
1. The Gene Ontology Consortium: Gene Ontology: tool for the unification of biology. Nature Genet., 25:25-29, (2000)
2. Breiman, L.: Random Forests. Machine Learning 45(1), (2001)
3. Briesemeister, S., Rahnenfuhrer, J., Kohlbacher, O.: Going from where to why -interpretable prediction of protein subcellular localization. Bioinformatics (2010) 4. Brubaker, S. C. and Vempala, S.: Isotropic PCA and Affine-Invariant Clustering.
Proceedings of IEEE Symposium on Foundations of Computer Science (2008) 5. Cai, Y.D., Chou, K.C.: Nearest Neighbour algorithm for predicting protein
sub-cellular location by combining functional domain composition and pseudo-amino acid composition. Biochemical and Biophysical Research Communications (2003) 6. Chou, K.C.: A novel approach to predicting protein structural classes in a (20-1)-D
amino acid composition space. Proteins: Structure, Function, and Genetics (1995) 7. Chou, K.C.: Prediction of protein cellular attributes using pseudo amino acid
com-position. Proteins: Structure, Function, and Genetics (2001)
8. Chou, K.C., Cai, Y.D.: Using functional domani composition and support vector machines for prediction of protein subcellular location. J. Biol. Chem.(2002) 9. Chou, K.C., Cai, Y.D.: Prediction of protein subcellular locations by
10. Chou, K.C., Shen, H.B.: Predicting eukaryotic protein subcellular locations by fus-ing optimized evidence-theoretic K-nearest neighbor classifiers. J. Prot. Res.(2006) 11. Chou, K.C., Shen, H.B.: Recent progress in protein subcellular location prediction.
Analitical Biochemistry (2007)
12. Chou, K., Shen, H.: Cell-Ploc: a package of web servers for predicting subcellular localization of proteins in various organisms. Nature protocol (2008)
13. Chou, K., Shen, H.: A new method for predicting the subcellular localization of eu-kariotic proteins with both single and multiple sites: Euk-mPLoc. Plos One (2010) 14. Cortes, C., Vapnik, V.: Support Vector Networks. Machine learning (1995) 15. Cover, T.M, Hart, P.E.: Nearest neighbour pattern classification. IEEE
Transac-tions on Information Theory (1967)
16. Frank, E., Kramer, S.: Ensembles of nested dichotomies for multi-class problems. Proceedings of the 21stICML, Banff, Canada, 2004
17. Fox, J.: Applied Regression Analysis, linear models, and related methods. Sage 18. Garg, A., Bhasin, M., Raghava, G.P.: Support vector machine-based method for
subcellular localization of human proteins using amino acid compositions, their order, and similarity search. Journal of Biological Chemistry (2005)
19. Hansen, P. C.: The truncated SVD as a method for regularization. Technical Re-port, Standford University, CA, USA, (1986)
20. Hastie, T., Tibshirani, R.: Classification by pairwise coupling. Proceedings of Adv. in Neural Information Processing Systems (1998)
21. Huang, Y., Li, Y.: Prediction of protein subcellular locations using fuzzy K-NN method. Bioinformatics (2004)
22. Lei, Z., Dai, Y.: An SVM-based system for predicting protein subnuclear localiza-tions. BMC Bioinformatics (2005)
23. Platt, J.: Probabilistic outputs for support vector machines and comparisons to regularized likelihood methods. Adv. in Large Margin Classifiers. MIT press (1999) 24. Platt, C., Cristianini, N., Shawe-taylor, J.: Large Margin DAGs for Multiclass
Classification. Proceedings of NIPS (2000)
25. Qi, Y., Bar, Z., Klein, J.: Evaluation of different biological data and computational classification methods for use in protein interaction prediction. Fun. Bioinf. (2006) 26. Rozza, A., Lombardi, G., Casiraghi, E.: Novel IPCA-Based Classifiers and Their
Application to Spam Filtering. Proceedings of ISDA. IEEE C. S. (2009)
27. Rozza, A., Lombardi, G., Casiraghi, E.: PIPCAC: a Novel Binary Classifier As-suming Mixtures of Gaussian Functions. Proceedings of AIA (2010)
28. Rozza, A., Lombardi, G., Rosa, M., Casiraghi, E.: O-IPCAC and its Application to EEG Classification.WAPA,JMLR(to appear)
29. Shen, H.B., Chou, K.C.: Virus-PLoc: a fusion classifier for predicting the subcellu-lar localization of viral proteins within host and virus-infected cells. Biopol. (2006) 30. Shen, H., Chou, K.: PseAAC: a flexible web server for generating various kinds of
protein pseudo amino acid composition. Analytical Biochemistry (2008)
31. Shen, H.B., Chou, K.C.: Hum-mPLoc: an ensemble classifier for large-scale human protein subcellular location prediction by incorporating samples with multiple sites. Biochemical and biophysical research communications (2007)
32. Sch¨olkopf, B., Smola, A., M¨uller, K.R.: Nonlinear component analysis as a kernel eigenvalue problem. Neural Computing (1998)
33. Zouhal, L.M., Denoeux, T.: An evidence theoretic K-NN rule with parameter op-timization. IEEE Transactions on System, Man, and Cybernetics (1999)
34. Hall, M., Frank, E., Holmes, G., Pfahringer, B., Reutemann, P., Witten, I.H.: The WEKA Data Mining Software: An Update. SIGKDD Explorations (2009)