Nottingham.
Access from the University of Nottingham repository: http://eprints.nottingham.ac.uk/10923/1/PHDTHESISFINAL.pdf Copyright and reuse:
The Nottingham ePrints service makes this work by researchers of the University of Nottingham available open access under the following conditions.
· Copyright and all moral rights to the version of the paper presented here belong to the individual author(s) and/or other copyright owners.
· To the extent reasonable and practicable the material made available in Nottingham ePrints has been checked for eligibility before being made available.
· Copies of full items can be used for personal research or study, educational, or not-for-profit purposes without prior permission or charge provided that the authors, title and full bibliographic details are credited, a hyperlink and/or URL is given for the original metadata page and the content is not changed in any way.
· Quotations or similar reproductions must be sufficiently acknowledged.
Please see our full end user licence at:
http://eprints.nottingham.ac.uk/end_user_agreement.pdf
A note on versions:
The version presented here may differ from the published version or from the version of record. If you wish to cite this item you are advised to consult the publisher’s version. Please see the repository url above for details on accessing the published version and note that access may require a subscription.
The Redistributive Effects of Fiscal Policies in Turkey, 2003 Thesis submitted to the University of ottingham for the degree of Doctor of
Philosophy, April, 2009 Özlem Albayrak
This thesis investigates redistributive impacts of fiscal policies at household level in a middle income developing country, Turkey, in 2003.
It utilizes the benefit and tax incidence methodologies and applies the welfare dominance analysis and summary indices of progressivity to assess the distributional impacts of the fiscal policies. The 2003 Household Income and Consumption Expenditures Survey from the Turkish Statistical Institute is used for this purpose.
. Chapter 2 reviews the theoretical and empirical literature for measuring inequality and progressivity. The aim of the chapter is to review and discuss the measures used in the thesis. This is followed by the three empirical studies that form the core of the thesis.
Chapter 3 and 4 examine redistributive impacts of publicly provided education, health, infrastructure services and social cash and in kind transfers. The key findings show that apart from primary education, none of the social services in question are well targeted to the poor, although the incidence of the services is progressive.
In Chapter 5, attention is paid to direct and indirect tax policies in Turkey. Indirect taxes dominate tax revenues in Turkey. The results of the standard tax incidence analysis show that direct taxes are progressive thanks to personal income tax and property taxes. In the context of indirect taxes, redistributive power of indirect taxes is limited. The incidence of indirect taxes is sensitive to the welfare indicator chosen. While the indirect taxes reduce
intermediate goods, which are ignored by the standard tax incidence analysis. The incidence with effective indirect taxes is less progressive in the case of expenditure as the welfare indicator and more regressive in the case of income. The net fiscal incidence indicates that the fiscal policies have a positive redistributive impact on both expenditure and income inequality, and this positive impact is mainly driven by the public benefits.
Prof. Dr. Norman Gemmell for their valuable guidance, thoughtful instructions, and continuous support and patience throughout the realization of this work. I am also thankful to the support staff of the School of Economics and I gratefully acknowledge the financial support of the University of Ankara for funding more than three years of my PhD. I am also indebted to Prof. Abuzer Pinar and Prof. Dr. Ahmet Hasim Kose for their encouragement and trust.
I must thank friends of mine to whom I am grateful for being with me for all years. I must mention Irina Dahlmann who has been not only a friend but also a person whom I have found next to me whenever I need. Without her presence in my life in Nottingham, this thesis would not have been completed. I am very grateful to Phil Durrant and Aisling Quiery for their helpful comments on the thesis.
Finally, I am greatly indebted to my parents for believing in me and for supporting me throughout all levels of my education.
Acknowledgements
Acknowledgements ... iii
List of Tables... vii
List of Appendix Tables ... viii
CHAPTER 1: I*TRODUCTIO* ... 1
CHAPTER 2: MEASURI*G PROGRESSIVITY A*D REDISTRIBUTIVE IMPACTS OF PUBLIC POLICIES ... 11
2.1 Introduction ... 11
2.2 The Measures of Inequality: Gini Index and Lorenz Curves ... 12
2.2.1 Decomposing Income by Sources of Income ... 17
2.2.2 Inequality Comparisons and Welfare Dominance Analysis ... 18
2.2.3 Welfare Dominance Analysis in the Public Finance Context ... 21
2.3 Progressivity Measures ... 22
2.4 Statistical Inference... 29
2.4.1 Extended Gini Test ... 30
2.5 Conclusions ... 31
Appendix 2 ... 33
Appendix 2.1: Principles of Good Inequality Measures ... 33
Appendix 2.2: Conditions for Global Progressivity ... 34
CHAPTER 3: THE DISTRIBUTIO*AL IMPACTS OF PUBLIC EDUCATIO* SERVICES I* TURKEY, 2003 ... 35
3.1 Introduction ... 35
3.2 Method: Benefit Incidence Analysis ... 36
3.2.1 Choosing the Welfare Indicator ... 42
3.3.1 Enrolment Rates and the Quality of the Services ... 57
3.4 Results ... 65
3.4.1 Descriptive Analysis ... 65
3.4.2 Welfare Dominance Analysis ... 68
3.4.3 Progressivity Indices and the Extended Gini Test ... 71
3.4.4 Regional Level Analysis ... 76
3.5 Conclusions ... 83
CHAPTER 4: BE*EFIT I*CIDE*CE A*ALYSIS O* PUBLIC SERVICES FOR HEALTH, I*FRASTRUCTURE A*D SOCIAL TRA*SFERS ... 100
4.1 Introduction ... 100
4.2 The General System of Public Health, Infrastructure Services and Social Transfers ... 101
4.2.1 Health System in Turkey ... 101
4.2.2 Infrastructure Services ... 114
4.2.3 Social Transfers ... 121
4.3 Results ... 133
4.3.1 Welfare Dominance Analysis ... 133
4.3.2 The Progressivity Indices and The Extended Ginis Test ... 138
4.3.3 The Overall Analysis of the Social Services ... 144
4.3.4 Regional Level Analysis ... 146
4.4 Conclusions ... 152
CHAPTER 5: TAX I*CIDE*CE A*ALYSIS I* TURKEY, 2003... 172
5.1 Introduction ... 172
5.2 Turkish Revenue System ... 175
5.3 Informal Economy and Tax Evasion ... 188
5.4 Incidence Assumptions and Estimating Tax Liabilities ... 193
5.4.1 Incidence Assumptions ... 193
5.4.2 Estimating Tax Liabilities ... 203
5.5 Results ... 208
5.5.1 The Welfare Dominance Analysis ... 215
5.5.2 S-Gini Progressivity Indices ... 225
5.6 The Incidence of Indirect Taxes by Effective Tax Rates Estimated from Input-Output Tables ... 234
5.6.1 Effective Tax Rate Estimation Using Input-Output Tables ... 234
5.6.2 Results... 236
5.7 Regional Level Analysis ... 240
5.8 Conclusions ... 246
CHAPTER 6: CO*CLUSIO* ... 299
6.1 Introduction ... 299
6.2 Summary of the Key Findings ... 300
6.2.1 Benefit Incidence Analysis ... 300
6.2.2 Tax Incidence ... 307
6.3 Policy implications ... 308
6.4 Redistributive Effects of Fiscal Policies ... 311
6.5 Scope of Further Research ... 314
Table 1.1: Some Basic Indicators of Turkish Economy over time ... 4
Table 1.2: Individual Poverty Rates, 2002+2003+2006* ... 4
Table 1.3: The Composition of the Consolidated Budget by services, Turkey, 1995+2003 ... 6
Table 3.1: MONE Expenditures by Program, 2003 ... 49
Table 3.2: Average Per Student Monthly Government Spending on Education, ... 49
Table 3.3: The Distribution of Per Capita (Per AE) Monthly Total Household Expenditure and Average Numbers of Students by quintile, Turkey, 2003... 52
Table 3.4: Education Expenditures in Turkey, in 2002 by source ... 53
Table 3.5: Monthly Household per Adult Equivalent Expenditure (AE) on Education ... 56
Table 3.6: Enrolment Rates, by quintiles ... 60
Table 3.7:Enrolment Rates with only the children who have primary (secondary) degree, by quintiles ... 60
Table 3.8:School Attendance by Parental Schooling ... 62
Table 3.9: School Attendance by Parental Schooling ... 63
Table 3.10: Enrolment Rates by Region and Gender ... 64
Table 3.11: The number of Students per teacher by education level and region, 2003 ... 65
Table 3.12: Education Service Needs and Per AE* Benefits, by decile % shares ... 67
Table 3.13: Dominance Results for Public Education Services, (Per AE Benefits) ... 71
Table 3.14: S+Gini Indices for Benefits (ρ=2) ... 73
Table 3.15: The Extended+Ginis Test Results ... 75
Table 3.16: Decomposition Analysis: Contribution of Geographical Regions to Total Expenditure* . 77 Table 3.17: Descriptive Statistics by region, (Mean Values) ... 77
Table 3.18: Education Needs and Shares of Benefits, Turkey, 2003 ... 79
Table 3.19: Education Needs and Shares of Benefits, Turkey, 2003 ... 80
Table 3.20: Redistribution Index by regions ... 82
Table 3.21: Redistributive Impacts of Education, by Region ... 83
Table 4.1: Per Capita Annual Public Spending of Health Services ... 109
Table 4.2: The Beneficiaries of public health services by deciles ... 112
Table 4.3: The Beneficiaries of Public Health Services by regions ... 112
Table 4.4: Public Health Service Needs and Benefits, by deciles, % shares ... 113
Table 4.5: Per Household Annual Public Spending of Infrastructure Services in Turkey, 2003 ... 115
Table 4.6: Mean Infra_Index by deciles ... 116
Table 4.7: The Distribution of Basic House Facilities by deciles (%) ... 119
Table 4.8: The Percentage of Users of House Facilities by decile and by facility ... 119
Table 4.9: Correlation between Infra_Index and Basic Infrastructure Facilities and Mean Infra_Index by facilities ... 120
Table 4.10: The Distribution of Public Infrastructure Services, by deciles, % shares ... 120
Table 4.11: Social Transfers as a percentage of total decile income* ... 123
Table 4.12: Percentage shares of receivers of social transfers by deciles ... 127
Table 4.13: The Distribution of Social Cash Transfers, by deciles % shares ... 128
Table 4.14: The Distribution of Social Transfers by deciles ... 130
Table 4.15: Decomposition Analysis: Contribution of Social Transfers (in cash and in kind) to Total Income* ... 132
Table 4.16: Dominance Results for Public Services, ... 137
Table 4.17: Results of Dominance Tests for Public Services ... 138
Table 4.18: S+Gini Indices for Benefits (ρ=2) ... 141
Table 4.19: Extended+Ginis Test Results, ... 142
Table 4.20: Redistribution Index for Total Benefits with different inequality aversion parameter .... 146
Table 4.21: Redistribution Index by regions ... 148
Table 4.22: Redistribution Index for Total Benefits by regions ... 149
Table 4.23: Redistributive Impacts of benefits, by Region... 151
Table 4.24: Redistributive Impacts of Total Benefits, by Region... 151
Table 5.1: Central Government Domestic Revenue, Turkey, 2003 ... 176
Table 5.2: Income Tax Schedule 1 for Employers and Self+Employed Individuals ... 178
Table 5.7: Social Security Membership by expenditure quintiles ... 185
Table 5.8: The Structure of Indirect Tax Revenue (% of Total Tax Revenue) ... 186
Table 5.9: Import by Source since 2000 ... 187
Table 5.10: Import Composition, selected years in Turkey ... 187
Table 5.11: Consumption Pattern in Turkey, 2003 ... 187
Table 5.12: Tax Evasion in Turkey ... 192
Table 5.13: The Size and Extent of Tax Evasion among Self+employed and Employer Households 200 Table 5.14: Tax Evasion among Self+employed Households ... 201
Table 5.15: Incidence and Tax Evasion Assumptions ... 202
Table 5.16: Average Rates of PIT by decile ... 210
Table 5.17: Average Rates of Payroll Tax by decile ... 212
Table 5.18: Average Rates of Payroll Tax by decile ... 213
Table 5.19: Average Tax Rates of Property Tax by decile ... 213
Table 5.20: Average Rates of Indirect Taxes by income decile ... 214
Table 5.21: Average Rates of Indirect Taxes by expenditure deciles ... 215
Table 5.22: Dominance Results for Income Tax ... 219
Table 5.23: Dominance Results for Payroll Tax ... 219
Table 5.24: Dominance Results for Property Taxes ... 219
Table 5.25: Dominance Results for Indirect Taxes ... 220
Table 5.26: Dominance Results for Indirect Taxes ... 221
Table 5.27: S+Gini Indices of TR+Progressivity for Payroll Tax ... 222
Table 5.28: Extended Gini Test for Payroll Tax ... 222
Table 5.29: Dominance Results for Total Direct and Indirect Taxes ... 224
Table 5.30: Dominance Results for Total Direct and Indirect Taxes ... 224
Table 5.31: S+Gini Indices for Taxes (ρ=2) (Income) ... 229
Table 5.32: S+Gini Indices for Taxes (ρ=2) (Expenditure) ... 230
Table 5.33: Average Effective Rates of Indirect Taxes by deciles ... 236
Table 5.34: Average Effective Rates of Indirect Taxes by decile... 237
Table 5.35: Dominance Results for Indirect Taxes with effective rates (expenditure) ... 238
Table 5.36: Dominance Results for Indirect Taxes with effective rates (income) ... 238
Table 5.37: Redistribution Index by regions (V1) (Expenditure) ... 244
Table 5.38: Redistribution Index by regions (V1) (Income) ... 245
Table 5.39: The Summary of The Results ... 249
Table 6.1: Average Enrolment Rates in Turkey, 2003 ... 306
Table 6.2: Marginal Odds of Enrolment in Turkey, 2003 ... 306
Table 6.3:The Differences of the Ordinates of the Lorenz Curves Before and After Net Taxes ... 316
Table 6.4: S+Gini Indices of Progressivity and Redistribution for Total Fiscal System (expenditure) ... 317
Table 6.5: S+Gini Indices of Progressivity and Redistribution for Total Fiscal System (income) ... 317
Table 6.6: Redistribution Index by regions (Expenditure) ... 318
Table 6.7: Redistribution Index by regions (Income) ... 318
List of Appendix Tables Table A 3.1: Income Shares by Education Level (as % of total income earned) ... 85
Table A 3.2: The Number of Students and Schools by provider in 2003+2004 Academic Year ... 85
Table A 3.3: Monthly Household per AE Expenditure on Education by region (% of total) ... 85
Table A 3.4:The Number of Public School Students by Education Level and Regions ... 85
Table A 3.5: Average Years of Schooling ... 86
Table A 3.6: The number of students as a percentage of total by deciles and level of education ... 86
Table A 3.7: The Number of School Age Individuals as a percentage of total by deciles and level of education ... 86
Table A 3.8:Percentage Shares of Number of Teachers and Students, by Region, 2003 ... 87
Benefits ... 90
Table A 3.14: Decomposition Analysis: Contribution of Geographical Regions to Total Expenditure After Primary Education Benefits* ... 91
Table A 3.15: Decomposition Analysis: Contribution of Geographical Regions to Total Expenditure After Secondary Education Benefits* ... 91
Table A 3.16: Decomposition Analysis: Contribution of Geographical Regions to Total Expenditure After Higher Education Benefits* ... 92
Table A 4.1: Organizations involved in Turkish health care classified by their function ... 155
Table A 4.2: Social Security Membership among individuals (employee/employer/self+employed) by deciles ... 155
Table A 4.3 : The Share of MoH Budget in GNP and the State Budget and the Share of Total Public Health Expenditures in GNP ... 156
Table A 4.4: The quality of different types of health services ... 156
Table A 4.5: Monthly household per adult equivalent expenditure on health, by decile, region and type of service, Turkey, 2003 ... 157
Table A 4.6: The Distribution of Public Health Expenditure and Number of Health Staff by regions in 2003 ... 158
Table A 4.7: Public and Private Health Expenditures by Regions, (%) 2000... 158
Table A 4.8: The Distribution of Private Expenditures on Health Care by Region(1) ... 158
Table A 4.9: The Distribution of Private Expenditures on Health Care by Region (2) ... 159
Table A 4.10: Public Health Service Needs and Benefits, by region % shares ... 159
Table A 4.11 : The Percentage of Users of House Facilities by rural/urban location and by facility . 159 Table A 4.12: The Distribution of Basic House Facilities by region (%), ... 160
Table A 4.13: Redistributive Impacts of Public Infrastructure Services by regions ... 161
Table A 4.14: Percentage shares of receivers of social transfers by deciles ... 161
Table A 4.15: The Distribution of Social Transfers by regions ... 161
Table A 4.16: The Distribution of Social Transfers by regions ... 162
Table A 4.17. The differences of ordinates of the Lorenz curve and Concentration Curves ... 163
Table A 4.18: TR+Progressivity Index for Benefits by different inequality weights ... 164
Table A 4.19: IR+Progressivity Index for Benefits by different inequality weights ... 164
Table A 4.20: Redistribution Index with different inequality aversion parameter ... 165
Table A 4.21: Extended Coefficients of Gini and Concentration for Household Expenditure and Benefits ... 165
Table A 4.22: Decomposition Analysis: Contribution of Geographical Regions to Total Expenditure* ... 166
Table A 4.23: Decomposition Analysis: Contribution of Geographical Regions to Total Expenditure After Health Benefits* ... 166
Table A 4.24: Decomposition Analysis: Contribution of Geographical Regions to Total Expenditure After Infrastructure Benefits* ... 167
Table A 4.25: Decomposition Analysis: Contribution of Geographical Regions to Total Expenditure Before Social Transfers(1)* ... 167
Table A 4.26: Decomposition Analysis: Contribution of Geographical Regions to Total Expenditure Before Social Transfers(2)* ... 168
Table A 4.27: Decomposition Analysis: Contribution of Geographical Regions to Total Expenditure After Total Benefits (3)* ... 168
Table A 5.1: The Trend of Direct&Indirect Taxes (% of TTR) and Tax Effort (TTR as % of GNP) 250 Table A 5.2: The Size of Informal Economy in Turkey ... 250
Table A 5.3: Calculation for Income Tax Ranges (Wage Earners) ... 251
Table A 5.4: Mean Wages by the Ownership Status of the Employer and Social Security Institution ... 251
Table A 5.5: Average Rates of PIT by expenditure decile ... 251
Table A 5.6:Average Rates of Payroll Tax by decile ... 252
Table A 5.7: Average Tax Rates of Property Tax by decile ... 252
Table A 5.8: The Definitions for Income and Expenditure Concepts for the Tax Incidence Analysis ... 253
the Concentration Curves ... 255
Table A 5.11: The differences of the Ordinates of the Lorenz curve for Household Expenditure and the Concentration Curves ... 256
Table A 5.12: The differences of Ordinates of the Lorenz curve for AE_EXP and Concentration Curves ... 257
Table A 5.13: The differences of the Ordinates of the Lorenz curve for AE_INC and the Concentration Curves ... 258
Table A 5.14: The differences of the Ordinates of the Lorenz curve for Household Expenditure and the Concentration Curves ... 259
Table A 5.15: The differences of the Ordinates of the Lorenz curve for Household Income and the Concentration Curves ... 260
Table A 5.16: The differences of the Ordinates of the Concentration Curves for the Total Taxes under V1 and V2&V4 ... 261
Table A 5.17: S+Gini Indices of Progressivity and Redistribution for Income Tax (expenditure) ... 262
Table A 5.18: S+Gini Indices of Progressivity and Redistribution for Income Tax (income) ... 262
Table A 5.19: S+Gini Indices of Progressivity and Redistribution for Payroll Tax (expenditure) ... 263
Table A 5.20: S+Gini Indices of Progressivity and Redistribution for Payroll Tax (income) ... 263
Table A 5.21: S+Gini Indices of Progressivity and Redistribution for Property Taxes (expenditure) 264 Table A 5.22: S+Gini Indices of Progressivity and Redistribution for Property Taxes (income) ... 264
Table A 5.23: S+Gini Indices of TR+Progressivity for the Indirect Taxes (expenditure) ... 265
Table A 5.24: S+Gini Indices of IR+Progressivity for the Indirect Taxes (expenditure) ... 265
Table A 5.25: S+Gini Indices of Redistribution for the Indirect Taxes (expenditure) ... 266
Table A 5.26: S+Gini Indices of TR+Progressivity for the Indirect Taxes (income) ... 266
Table A 5.27: S+Gini Indices of IR+Progressivity for the Indirect Taxes (income) ... 267
Table A 5.28: S+Gini Indices of Redistribution for the Indirect Taxes (income) ... 267
Table A 5.29:The Differences of the Ordinates of the Lorenz Curves Before and After Total Taxes 268 Table A 5.30: S+Gini Indices of Progressivity and Redistribution for Total Taxes (income) ... 269
Table A 5.31: S+Gini Indices of Progressivity and Redistribution for Total Taxes (expenditure) ... 269
Table A 5.32:The Differences of the Ordinates of the Lorenz curve for Household Expenditure and the Concentration Curves ... 270
Table A 5.33: The differences of the Ordinates of the Lorenz curve for Household Income and the Concentration Curves ... 271
Table A 5.34: S+Gini Indices of TR+Progressivity for the Indirect Taxes (household expenditure) .. 272
Table A 5.35: S+Gini Indices of TR+Progressivity for the Indirect Taxes ( household income) ... 272
Table A 5.36: S+Gini Indices of IR+Progressivity for the Indirect Taxes (household expenditure) ... 273
Table A 5.37: S+Gini Indices of IR+Progressivity for the Indirect Taxes (household income)... 273
Table A 5.38: S+Gini Indices of Redistribution for the Indirect Taxes (household expenditure) ... 274
Table A 5.39: S+Gini Indices of Redistribution for the Indirect Taxes (household income) ... 274
Table A 5.40:The differences of the Ordinates of the Lorenz Curves Before and After Total Taxes 275 Table A 5.41: S+Gini Indices of Progressivity and Redistribution for Total Taxes (expenditure) ... 276
Table A 5.42: S+Gini Indices of Progressivity and Redistribution for Total Taxes (income) ... 276
Table A 5.43:Nominal and Effective Tax Rates, 1998 Turkey IO Table ... 278
Table A 5.44: The Distribution of Social Security Membership of Employees by region (%) ... 281
CHAPTER 1: I*TRODUCTIO*
The economics literature recognizes three main functions of the public sector (Stiglitz, 2000: 20; Musgrave, 1959): allocation, stabilisation and redistribution. With the allocation function, the aim of the public sector is to allocate its economic resources efficiently to different sectors. It can be done by direct interventions to the economy such as production through public firms or indirect interventions through taxes and subsidies. The second function requires the public sector to apply macro economic policies to keep the economy stable at full employment. The final function is based on equity concerns of societies and requires redistributive policies to create more equitable distribution of welfare, depending the societies’ preferences. In the last two decades there has been an important scientific debate in the public finance literature on the role of the public sector, mainly regarding concerns that public interventions may be distortionary and inefficient with the reference to first two functions of the public sector. Economic growth has been seen as the most important dynamic in fighting against income inequality and poverty from which most developing countries suffer. For the developing countries the main aim has been to enhance growth. To achieve this, the economic policies have focussed mostly on stabilisation, adjustment and market liberalisation.
In line with these policies, there has been a huge literature discussing if growth or redistributive policies should be chosen to fight against poverty and inequality. While Alesina and Rodrik (1994) argue that redistribution slows economic growth, Aghion and Bolton (1997) see redistribution as a growth enhancing factor. Although there is no common concensus on this issue, it has been shown that inequality has a negative impact on growth by decreasing investment in human capital, increasing populist public expenditures, corruption, and political instability (Barro, 2000; World Bank, 2001). On the other hand,
empirical studies have shown that high growth rates don’t necessarily cause any reduction in poverty and income distribution. In other words, there is not any systematic (negative or positive) relationship between growth and inequality and it depends on the initial conditions of countries (Fields, 1980:181+248; Fields, 2000)1. Furthermore, the inequality literature has shown the negative relationship between inequality and social welfare theoretically under a social welfare function with high inequality aversion (Atkinson, 1970; Sen, 1997; Shorrocks, 1983).
Despite all these discussions on the role of the public sector and on determining the best policy to increase the well+being of individuals and decrease inequality and poverty, public policies have inevitable effects on inequality of income distribution and need to be examined in this respect. Since in the last three decades there has been a rising trend in inequalities all over the world (Gottschalk and Smeeding, 1997; Mitra and Yemtsov, 2007; OECD, 2008), researchers’ focus has been turned to investigate the sources of income inequality and the ways to reduce it. Reflecting these efforts, since the 1990s a huge body of empirical literature has been produced on the redistributive impacts of government revenue and expenditure policies, particularly in developing countries, to find out if government policies have been one of the sources contributing to rising inequalities (regressivity of the policies) as well as if government policies can be used as an effective instrument to mitigate inequalities and poverty (redistributive impacts, or progressivity in policies).
This thesis addresses the measurement of redistributive effects of fiscal policies in a middle income country, Turkey, where high inequality has been a persistent problem for a long time. The thesis does not attempt to investigate the causes of inequality2, neither does it discuss the role of the public sector directly. The starting point of this work is that fiscal policies have important effects on inequality and poverty in direct and indirect ways and
1
See Dollar and Kraay (2002), Bruno, Ravallion Square (1999) for the relationship between equality or poverty and growth.
2
For the sources of high inequality in Turkey, see Kose and Karahanogullari (2005), Silber and Özmucur (2000) and Baslevent and Dayioglu, (2005).
regardless of the main aims for these policies these effects should be examined, given the concerns for inequality. It is an important task to measure and discuss these impacts of fiscal policies to find out the possible obstacles against fighting inequality and poverty. In this framework, the main contribution of the thesis is empirical and it will attempt to see how the existing fiscal policies of Turkey affect redistribution and inequality in 2003.
Turkish Case
Since 1994, the Turkish economy experienced two serious financial crises (1994 and 2000/2001) accompanied by enormous public imbalances and a drastic reduction of domestic income. In the aftermath of the last crises, Turkey implemented a structural adjustment program to overcome the economic problems caused by the crises under the supervision and technical support of the International Monetary Fund and the World Bank3. It is well known that fiscal discipline, namely attaining primary fiscal surpluses, has been a major component of these types of programs (Taylor, 2004). The negative effects of these fiscal policies have been twofold: on the expenditure side, the direct result is reduction of public welfare spending such as on education, health and infrastructure. On the income side, the change in the composition of tax structure (increases in the share of indirect taxes) has also created direct and indirect redistributive effects on different household groups via price and income changes. Empirical studies concerning the effects of structural adjustment programs on growth, inequality and poverty in developing countries have different conclusions and implications and the results vary according to countries’ initial conditions (Crisp and Kelly, 1999; Sahn and Younger, 1999).
A direct effect of these two successive crises has been a drastic reduction in the real economy. As can be seen from Table 1.1, after both the 1994 and 2000/2001 crises, the Turkish economy shrank. The growth rates of 1994 and 2001 are +6.1% and –9.5 % respectively. However, after each crisis, the Turkish economy rapidly achieved very high
3
growth rates, of 8% in 1995 and 2002. Despite these high growth rates, the negative effects of the crises on already high inequality in income distribution are still felt and the unemployment rate has increased rather than declined, implying a persistent effect on income inequality (Table 1.1 and Table 1.2). The tables indicate some improvements in income inequality and poverty but the rates are still above international averages for a middle income country, which highlights a need for further attention to distributional issues.
Table 1.1: Some Basic Indicators of Turkish Economy over time
1994 1995 2001 2002 2003 2004 2005
Gini Coefficient (income) 0.49 0.46 0.44 0.42 0.4 0.38
Growth Rate (at 1987 prices) +7.8 6.1 +11.1 6.4 4.2 8.2 7.2
GDP per capita* 1768 1874 1842 1962 2049 2222 2362
Unemployment rate (Age over 15) 8.6 7.6 8.4 10.3 10.5 10.3 10.3
Unemployment rate (Age between 15?24) 16 15.5 16.2 19.2 20.5 19.7 19.3
Inflation (Consumer Price Index)** 125.5 78.9 68.5 29.7 18.5 9.3 10.5
*US Dollar, at 1987 real prices. **Base year is 1987 for 1994, 1994 for the other years Source: SPO and Turksat
Table 1.2: Individual Poverty Rates, 2002?2003?2006* Methodologies
Individual Poverty Rate (%)
Turkey Urban Rural
2002 2003 2006 2002 2003 2006 2002 2003 2006
Food poverty (famine) 1.35 1.29 0.74 0.92 0.74 0.04 2.01 2.15 1.91
Poverty (food+non?
food) 26.96 28.12 17.81 21.95 22.3 9.31 34.48 37.13 31.98
$1 per person per day
poverty 0.2 0.01 0 0.03 0.01 0 0.46 0.01 0
$2.15per person per
day poverty 3.04 2.39 1.41 2.37 1.54 0.24 4.06 3.71 3.36
$4.3 per person per
day poverty 30.3 23.75 13.33 24.62 18.31 6.13 38.82 32.18 25.35
*Headcount Rate Source: Turksat
The objectives of government expenditure policies are twofold: 1) to increase efficiency in the allocation of resources by providing goods and services that private markets fail to provide, or fail to provide at an optimal level; 2) to improve equity in the distribution of income. The second objective is achieved through social transfers and provision of goods and services that may benefit the poor in particular. It is commonly believed that redistribution through tax policies is limited and this limitation is particularly significant in
developing countries whose tax effort as a percentage of Gross National Product is especially small due to the limited tax base, arising from the size of the informal economy and tax evasion. Given this, the expenditure side of government budgets appears to be a potentially more effective tool to redistribute incomes for developing countries. The first studies in this area examined the distributional impact of the whole government budget. However, the recent empirical literature for developing countries focuses on public spending programs that have the explicit goal of improving distributional equity and confer personal benefit upon users, such as education, health, infrastructure services and social transfers. These services are important in terms of their positive impact on growth and development as well as their redistributive power and it has been shown that public expenditures on these services narrow inequalities significantly (OECD, 2008: Chapter 9).
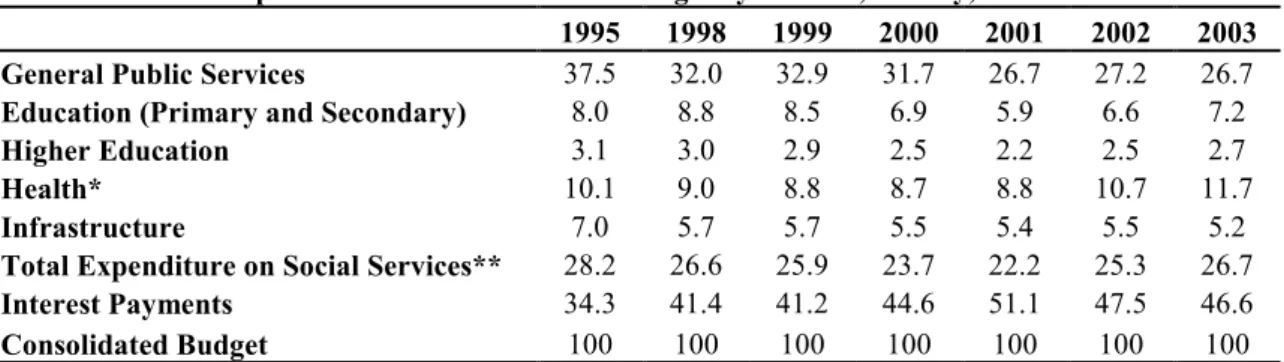
Table 1.3 provides percentage shares of public services in the consolidated budget in Turkey over time. The share of public spending on social services is negatively affected by the financial crisis in 2001, it dropped to 22%, yet there has been a rising trend since then. The total expenditures on social services (education, health, infrastructure and social transfers) account for about 27% of the total consolidated budget in 2003, whereas interest payments and the expenditures on general public services (expenditures on general administration, law and order and defence) account for 73% of the consolidated budget. The share of debt interest payments increased in time and it is around 50% for the 2000s. As these expenditures go to higher income households who have savings to lend to the government by buying government bonds, they are expected to have a widening impact on the distribution of income. This thesis concentrates on the distributional impacts of social services, which are supposed to have positive redistributive impacts, to see if those expenditures help to reduce inequality and target the poor, thus the thesis examines just over a quarter of the consolidated budget.
Table 1.3: The Composition of the Consolidated Budget by services, Turkey, 1995?2003
1995 1998 1999 2000 2001 2002 2003
General Public Services 37.5 32.0 32.9 31.7 26.7 27.2 26.7
Education (Primary and Secondary) 8.0 8.8 8.5 6.9 5.9 6.6 7.2
Higher Education 3.1 3.0 2.9 2.5 2.2 2.5 2.7
Health* 10.1 9.0 8.8 8.7 8.8 10.7 11.7
Infrastructure 7.0 5.7 5.7 5.5 5.4 5.5 5.2
Total Expenditure on Social Services** 28.2 26.6 25.9 23.7 22.2 25.3 26.7
Interest Payments 34.3 41.4 41.2 44.6 51.1 47.5 46.6
Consolidated Budget 100 100 100 100 100 100 100
otes: *Total health expenditures include social transfers to social security institutions too as pensions and other social cash transfers are paid by the social security organisations
Health, Education, Infrastructure and Social Transfers Source: SPO and Ministry of Public Finance
Despite the common belief that the role of taxes is limited as a redistributive instrument, government revenue policies are very important for both equity concerns and creating revenues for government expenditures in developing countries. Developing countries have changed their tax structure since the 1980s to increase their tax revenues. They have decreased the share of trade taxes in total tax revenues and generated more revenue from domestic indirect taxes. Value Added Tax (VAT) has been introduced by most developing countries and indirect taxes have become the most important revenue source. These structural changes in the revenue side of government budgets naturally have impacts on income distribution, given the general perception that indirect taxes generate generally disequalising impacts on income distribution (Gemmell and Morrissey, 2003). Given these developments, examining distributional impacts of changes in tax structures of governments has been an important empirical area. Tax incidence analysis has been performed for developing countries recently. These studies generally deal with the impacts of recent tax policy changes in developing countries and capture the effects of both direct and indirect taxes depending on data available.
The existing tax structure of the Turkish economy is representative of a typical developing country. As can be seen from Figure 1.1, since 1985, in which VAT was
introduced, indirect taxes have increased as a share of total tax revenues and today are the most important source for tax revenues + 70% of total tax revenues in 2005. As lower income households have higher propensity to consume, indirect taxes are perceived to increase inequalities. In order to prevent such an impact, VAT is applied with differential rates (which is the case for Turkey).
Although Turkey has been suffering from high income inequality, to date there has been only one study investigating the redistributive effects of public policies in Turkey. Pinar (2004) examined both tax and expenditure policies of Turkey for 1994 and 2002. The author applied the fiscal incidence method by comparing quintiles’ share of household incomes before and after tax and expenditure policies. However Pinar (2004) ignores the statistical robustness of the results, which may cause one to question the reliability of the results4. Pinar showed that public expenditures on education and health redistribute incomes
4
In addition to this, the data sets Pinar used have some important drawbacks. The 1994 HICES do not have any question to identify students in households. Pinar used the question to identify students,
0 20% 60% 80% 1980 1985 1990 1995 2000 2005 Years
Indirect Taxes Tax Effort
Direct Taxes
Figure 1.1: The Trend of Direct and Indirect Taxes and Tax Effort in Turkey
towards low income groups, however, the poor receive a smaller share of health services than of basic education services. Moreover, Pinar concluded that infrastructure services have a positive impact on income inequality. Pinar found that VAT has almost no impact on income inequality, but it has small negative impact on lower income groups, whereas personal income tax redistributes incomes towards lower income groups, but the poorest get the smallest share from redistribution.
The first contribution of the thesis is to investigate distributional impacts of fiscal policies for Turkey in 2003. Secondly, the thesis considers the statistical robustness of the results which was ignored by the only study for Turkey, Pinar (2004). Thirdly, both income and expenditure measures are used as welfare indicators to test the sensitivity of the results to the chosen welfare indicator, which was also ignored by Pinar (2004). Finally, in addition to the stantard tax incidence analysis for indirect taxes, we estimate effective tax rates by making use of input+output tables to include the impacts of taxation on imported and intermediate goods.
The basic data used is the Household Income and Consumption Expenditure Surveys (HICES), conducted by the Turkish Statistical Institute (Turksat) to measure households’ living standards and utilization of public services. The HICES data were collected for 1994, 2002, 2003, 2004, and 2006. The sample of HICES was designed to be representative of the population of Turkey, and two of the surveys + 1994 and 2003 + are also regionally representative. Moreover, all of them provide reliable information needed for an urban+rural breakdown and they have information at both individual and household level. In the thesis, the HICES 2003 with 25,920 households is used. The reason for utilising only 2003 survey is that the 2003 HICES is the most recent, comprehensive and regionally representative household survey. As the surveys conducted after 2003 have smaller sample size (8,640 households), they are not regionally representative and they are not as comprehensive as the which seeks to find out the reasons of unemployed individuals for not seeking job and asked to the individuals over 10 year+old in households. This gives rise to drop individuals under the age of 10 from the analysis that makes impossible to investigate the incidence of primary education.
2003 HICES, particularly in terms of consumption data. Furthermore, we need regional disaggregation to take into account variations in the quality of the public services examined, which is captured by disaggregated public spending on publicly provided services.
The Outline of The Thesis
In this framework, the thesis aims to investigate tax and expenditure policies for Turkey in 2003. The thesis comprises five more chapters. Chapter 2 reviews the theoretical and empirical literature for measuring inequality and progressivity. The aim of the chapter is to review and discuss the measures used in the thesis. This is followed by the three empirical studies that form the core of the thesis.
Chapters 3 and 4 focus on measuring the redistributive impacts of publicly provided services which are accepted to be effective instruments to mitigate inequality and poverty. The non+behavioural benefit incidence analysis is applied in both for one year of cross+ sectional micro data. It is assumed that the benefit derived by consumers can be approximated by the unit cost to the government of providing the services. Thus we estimate how average benefits are distributed across households by assuming that average benefits are equal to marginal benefits. We also focus on the direct incidence of the benefits, as it is very difficult to estimate the indirect incidence (externalities) of the services. Chapter 3 investigates if public education services decrease high inequality in Turkey and if the services go to households in need. Education has been seen as an effective instrument against poverty and, despite widening private provision of education services in developing countries, the public sector is still the main provider for these services.
Chapter 4 examines distributional impacts of public health and infrastructure services and public social transfers to compliment measuring redistributive impacts of social expenditures. This chapter suffers from lack of information on the users of health and infrastructure services. To overcome this problem indicators as approximations for the users of the services are created. The analysis of social transfers may provide more robust
estimations than the analsysis of health and infrastructure services as the data provide information on public cash and in kind transfers to individuals.
Chapter 5 focuses on the revenue side of the goverment budget and investigates progressivity and the redistributive role of direct and indirect taxes. Tax incidence analysis is conducted and both direct and indirect taxes are investigated by applying statutory tax rates to households/individuals’ expenditure and income sources to calculate tax burdens. In additon to the indirect tax incidence with statutory tax rates, the effective indirect tax rates are estimated by making use of input+output tables which allow consideration of the redistributive impacts of taxation on imported and intermediary goods. After estimating tax and benefit incidence, the results of the three empirical chapters are combined to examine the net fiscal incidence of both public tax and expenditure policies.
It has been emphasized by several empirical studies on Turkey that regional disparities are an important component of income inequality and poverty (World Bank, 2003, 2005; Başlevent and Dayıoğlu, 2005). Earlier studies showed that living in certain areas considerably affects the likelihood of being poor. Thus, regional level analysis is also conducted for all three empirical chapters to see if public policies reduce regional disparities. Finally the main findings of the thesis are summarised and some conclusions are drawn in Chapter 6.
CHAPTER 2: MEASURI*G PROGRESSIVITY A*D
REDISTRIBUTIVE IMPACTS OF PUBLIC POLICIES
2.1 Introduction
The impacts of public policies (tax and transfer policies) on income distribution are assessed by the notion of progressivity. Progressivity (regressivity) is defined as a measure of the deviation of a tax or benefit system from proportionality in favour of the poorer (richer) (Kakwani, 1986: 73)1. Also, any progressive policy instrument (tax or benefit) is supposed to improve the distribution of welfare in the society, so it is expected to have positive redistributive impacts. In other words, progressive policies are supposed to make inequality of net incomes (after tax and/or transfer incomes) lower than that of gross incomes. The reason for focusing on progressivity comes, as noted before, from the role of governments in reducing discrepancies in the well+being of individuals (equity) as well as increasing welfare (efficiency). As will be seen in this chapter, depending on the presence of inequality+averse social welfare functions, it has been shown that progressive tax policies are also welfare improving2.
There are two equity principles in the public finance and inequality literature: horizontal and vertical equity. The first + “the equal treatment of equals” + requires that people in equal positions should be treated equally. The second one is based on the principle of “the ability+to+pay” which leads to the principle of “the unequal treatment of unequals”. It necessitates that people with greater ability should pay more taxes. The empirical fiscal incidence literature generally deals with the issues of vertical equity since it seeks to
1
The notion of progressivity and measures of it have been developed in the tax context and extended to public benefits. Thus, throughout this chapter we also discuss progressivity generally in the tax context. Generally speaking, the progressivity of public benefits is defined in the opposite way to taxes, and benefits are defined as negative taxes (Duclos 2000).
2
determine whether public policies are inequality reducing or not. A public policy (tax or transfer) will be horizontally equitable if the ranking of individuals based on pre+tax or transfer welfare are not altered as a result of public intervention. However, as we will discuss later, reranking occurs for several reasons and may decrease the redistributive power of progressive policies. Because of this, horizontal equity is also relevant in examining progressivity of public policies (Kakwani, 1986:72+86; Lambert 1993:140).
Specifically, a tax is called progressive (regressive, proportional) if (average) tax rate increases (decreases, stays same) with pre+tax income and also is expected to have an equalizing impact on income distribution. The definition of progressivity for a benefit is the reverse of the tax case. A benefit (public service) is called progressive (regressive, proportional) if the utilization share of that benefit by individuals decreases (increase, stays same) with incomes of individuals (Kakwani, 1986:72+86; Lambert 1993: 139+201).
The aim of this chapter is to examine methodologies for measuring inequality and progressivity and for comparing different income distributions theoretically. Thus Section 3.2 examines the measures of inequality, the criteria for inequality comparisons and the method of welfare dominance; Section 3.3 reviews the most common progressivity indices theoretically; Section 3.4 discusses the statistical inference of comparisons of distributions and progressivity indices; and finally some conclusions are drawn in Section 3.5.
2.2 The Measures of Inequality: Gini Index and Lorenz Curves
The first necessary step to understand how public policies may affect inequality of a given income distribution (before tax or benefit distribution) is to choose a method to measure inequality. We do not go into the whole range of inequality measures here; instead we prefer to focus on the most commonly used inequality measures, namely Lorenz curves and S+Gini inequality indices, and the corresponding progressivity measures. These are the
measures commonly used in the fiscal incidence literature and we will also use them in our analysis.
The main functions and notations used in this chapter are given below, before starting with the measures of inequality and progressivity. In the inequality literature, there are three main functions to explain measures of inequality and to understand the features of a distribution. The first is the cumulative distribution function (cdf), formulated as p=F(y), where p is the proportion of individuals in the population who receive a level of income that is less than or equal to y, y is a welfare indicator which can be income or consumption, F is a non+decreasing function of y and takes values between 0 and 13. We assume that F(y) is continuously differentiable and strictly increasing in y. The second function is the density function (f(y)) that is the first derivative of the cdf and strictly positive when F(y) is assumed to be strictly increasing in y. The third useful function is the quantile function [Q(p)], which can be formulated as F(Q(P)) = p. Q(p) is the income or expenditure level of an individual whose percentile in the distribution is p. The quantile function is particularly helpful to define Lorenz curve and other Lorenz curve related measures (Duclos and Araar (2006).
The most widely used index of inequality in empirical analysis is the Gini index due to the direct relation of the index with the Lorenz curve. The Lorenz curve provides complete information on the whole distribution of incomes relative to the mean. It draws the percentages of the population arranged from the poorest to the richest on the horizontal axis against the percentages of income enjoyed by the bottom x% of the population on the vertical axis.
3
So the population size is normalised to 1, which refers also to the population or replication invariance principle. See Appendix 2.1 for the main principles of good inequality measures which have been introduced in the literature.
Thus the mathematical form of Lorenz curves for a continuous distribution can be defined as follows:
∫
∫
∫
=
=
p pdp
p
Q
dp
p
Q
dp
p
Q
p
L
0 1 0 01
(
)
)
(
)
(
)
(
∫
=
1 0)
(
p
dp
Q
where V is the mean level of y.
Analogous to the Lorenz curve, the concentration curve was introduced as a descriptive and normative tool for assessing the impact of tax and transfer policies4. Concentration curves plot households from the poorest to the richest, ranked by a chosen welfare indicator (e.g. gross incomes or expenditures), on the horizontal axis against the cumulative proportion of taxes (benefits) paid (received) by households.
Therefore, the concentration curve for a tax is defined as follows:
∫
∫
∫
=
=
p T T p TT
q
dq
dp
p
Q
dq
q
T
p
C
0 1 0 01
(
)
)
(
)
(
)
(
where T is average tax liabilities and q is the proportion of tax liabilities of the sample ranked by pre+incomes. The function T(q) represents the quantile function for tax liabilities which are ranked by y.
The Gini coefficient as a summary measure is directly computed from the Lorenz curve by measuring the extent to which the Lorenz curve departs from the perfectly equal distribution whose Lorenz curve lies along the 45+degree (perfect equality) line. Hence, the Gini index is defined as the ratio of the area between the Lorenz curve and the 45+degree line to the total area of the triangle. This relationship ensures that the value of the Gini coefficient
4
lies between “0” (for complete equality) and “1” (for extreme inequality). The Gini coefficient (G) can be defined mathematically as follows:
∫
−
=
10
(
(
))
2
p
L
p
dp
G
It is worth noting that the Lorenz curve provides partial ordering when we use it to compare different distributions, since it shows inequality along the overall income distribution. However, by providing a single summary number, the Gini index is able to present a complete ordering among different distributions. Because of this feature, and because the Gini index is Lorenz consistent, it is very popular to compare distributions in empirical analyses. The Gini index also satisfies the Pigou:Dalton principle, but it tends to be most sensitive to transfers around the middle of the distribution and least sensitive to transfers among the very rich or the very poor; in other words it does not satisfy the principle of diminishing transfers5. The Gini coefficient gives equal weight to all incomes regardless of whether they are received by the rich or the poor. As a result of this, it computes the average distance between cumulated population shares and cumulated income shares. Moreover, the Gini index satisfies principles of replication (population) invariance and scale invariance and thus the Gini index depends only on relative incomes, not on absolute values of incomes (Shorrocks, 1988).
Following Atkinson (1970), which introduced an inequality aversion parameter into the measurement of inequalities, different ethical weights have been introduced to determine to which side of a distribution researchers want to give more importance while estimating inequality. These percentile+dependent weights are used to aggregate the distance p:L(p). Using the Lorenz curve and these weights, S+Gini inequality indices (Single+Parameter Gini
5
See Allison (1978), Atkinson (1970), Creedy (1998), Jenkins (1991), Sen (1997) and Shorrocks (1988) for the assessments of different inequality measures and principles of inequality indices. The principle of diminishing transfers demands that an inequality index be more sensitive to the transfers taking place at the lower income levels. We will discuss the importance of this principle in the section on inequality comparisons.
inequality indices) can be computed. If we take the general formula below for ethical weights suggested by Yitzhaki (1983):
) 2 ( ) 1 )( 1 ( ) ; (
ρ
=ρ
ρ
− − ρ−κ
p pwhere ρ is the value of a single “ethical” parameter indicating inequality aversion. ρ must be greater than 1 to make the weights, κ(p;ρ), positive everywhere. The larger the value of
ρ
is, the larger the value ofκ
(p;ρ
) for small p, in other words for lower parts of the distribution. Using this weighting function we can define S+Gini Indices6 of inequality:∫
−
=
1 0)
;
(
))
(
(
)
(
p
L
p
p
dp
I
ρ
κ
ρ
As ρ=2 makes κ(p;ρ=2) take the value, 2, I(2) gives the Gini index, which gives equal weight to all distances, p:L(p). When ρ>2 relatively more weight is given to the distances found at lower values of p and vice versa. By using these percentile+dependent weights, higher order dominance can be tested when there is any ambiguity on ranking distributions. As put by Lambert (1993:119), therefore, S+Gini Indices of inequality provide the analyst with the opportunity to select a range of values of ρ to check the robustness of the implied inequality ranking of different distributional judgements.
As in the case of S+Gini inequality indices, the general formula for S+Gini indices of concentration can be written in the following form:
∫
−
=
1 0)
;
(
))
(
(
)
IC(
ρ
p
C
p
κ
p
ρ
dp
In the empirical fiscal incidence literature, some researchers have applied S+Gini Indices of inequality and concentration when they were not able to rank taxes or benefits in
6
S+Gini Indices of inequality were suggested by Yitzhaki (1983). They are also named the extended or generalised Gini coefficient. With this generalisation, Gini is thought to have most of the features of Atkinson (1970)’s inequality measure, which first considered including value judgements into the inequality measurement.
terms of progressivity or when they faced the problem of ranking before and after fiscal policies distributions to see the redistributive characteristics of the policies. This practice is called the extended+Gini test and will be examined later in the chapter (Sahn and Younger, 1999; Sahn, Younger and Simler, 2000).
2.2.1 Decomposing Income by Sources of Income
An S+Gini inequality index for a welfare indicator can easily be decomposed as a sum of the concentration indices of the different income sources, which add up to that welfare indicator. The decomposition method is used to assess the contributions of different sources of income or expenditure to inequality.
We can write concentration indices for different sources of income:
∫
−
=
1 0 X(
)
(
(
))
(
;
)
IC
iρ
p
C
p
κ
p
ρ
dp
where X is the total income and i denotes different sources of income (such as wages, transfers, agricultural incomes). Hence, we can define S+Gini index of inequality in the total income as a weighted sum of the concentration indices of each source of income:
∑
= i i X X IC i I 1 ) ( ) (ρ
π
ρ
X X i iπ
= / where ix illustrates average income from the ith source and, X is average total income, thus
π
i is the share of income source i in total income. We can rewrite the above definition so as to see the contributions of each income source to inequality (Duclos and Araar 2006).[
( ) ( )]
0 1= −
The decomposition comprises of two impacts: the share of the income source in the total income and the contributions of the sources of income to the inequality index. The product of the coefficient of concentration and the share of income source will give us the absolute contribution of the source of income to inequality. If the coefficient of concentration is negative, it means that the source of income contributes to the equality instead of inequality.
2.2.2 Inequality Comparisons and Welfare Dominance Analysis
If we wish to compare two different distributions which might be before and after fiscal policies, we can use measures of inequality rankings. The Lorenz curve is an important instrument not only to measure inequality but also to compare different distributions. If Lorenz curves of two distributions (say x and y) don’t intersect, it can be shown that x is more equally distributed than y if x lies entirely inside of y and then it can be said that x Lorenz dominates y. By using the normative approach, Atkinson (1970) proved Lorenz dominance which provides welfare interpretations on the distributions. Suppose that social welfare (W) is the sum of individual utility (U) functions which have strictly diminishing marginal utility; in other words utility functions are strictly concave functions of income yi:
W(y)=
∑
= n i 1U
(
y
i)
0 ) ( > ′ yU and U′′(y)<0 for all y>0
If the Lorenz curve of distribution x lies strictly inside that of y, and the mean income is the same for both distributions, we can write the following:
)
(
)
(
p
L
p
L
X≥
Y for all p,p
∈
[ ]
0
,
1
⇔∑
∑
= =≥
n i i m j jU
y
x
U
1 1)
(
)
(
Y X=
Then according to the theory of Lorenz dominance, it can be said that W(x) is greater than W(y). Concavity of utility functions guarantees inequality aversion in the sense that the Lorenz+dominating distribution is the one which has lower inequality than the other distribution, when both distributions have the same mean income and non+intersecting Lorenz curves. The value judgement behind this idea is the transfer principle of Pigou+ Dalton, which states that an income transfer from a richer to a poorer person that doesn’t change the mean income and the rank of the individuals is an improvement. Such a transfer shifts the Lorenz curve inwards towards 45+degree line which means that the criterion of first+degree Lorenz dominance is consistent with the Pigou+Dalton principle of transfers (Sen, 1997; Lambert 1993). Atkinson borrows the notion of inequality aversion from the finance literature and defines inequality aversion as equivalent to risk aversion in the theory of choice under uncertainty7.
However, Atkinson’s approach can only be used for distributions which have the same mean and where the Lorenz curves of the distributions do not cross. When they intersect, it is impossible to conclude which distribution has higher inequality and which distribution produces higher welfare. Shorrocks (1983) introduced generalized Lorenz curves which make it possible to compare distributions with different means and in some cases it also allows us to rank distributions even when their Lorenz curves intersect. In order to compare distributions with different means, the author offered the notion of the “generalized Lorenz curve” GL(y, p), which is simply the ordinary Lorenz curve times the mean of the distribution: ) , ( ) , (y p L y p GL =
Generalised Lorenz curves satisfy the scale independence principle which states that if all incomes are multiplied by the same number then the new distribution is just as unequal
7
In the finance literature, second+degree stochastic dominance refers to situations such that a portfolio, x, dominates another portfolio y, if x has less risk than y does. This requires a risk+averse utility function. Thus, Atkinson (1970) showed that Lorenz dominance and the second+degree stochastic dominance in the finance literature have the same requirements.
as the old distribution. Shorrocks also presumes that society cares about efficiency (higher real incomes) as well as equity under GL (Blackwood and Lynch, 1994). As Lambert stated (1993: 54+66), for equal+mean comparisons, the result is identical with Atkinson’s. But if the distributions have different mean incomes, the distribution with the higher mean income and dominating Lorenz curve (much closer Lorenz curve to the 45+degree line) will have higher social welfare. Thus if
L
X(
p
)
≥
L
Y(
p
)
for all p,p
∈
[ ]
0
,
1
and , X>
Y we can state that the distribution X generalized Lorenz dominates the distribution Y. However, Generalised Lorenz Curves may also cross or may cause some cases in which a distribution with higher inequality and also with a higher mean looks better (Lambert 1993: 61; Kakwani 1984).Since generalised Lorenz curves may intersect as well, in order to rank Lorenz curves intersecting unambiguously, higher order Lorenz dominance methods8 have been offered which have weaker criteria than first+degree Lorenz dominance requires. The higher degree of dominance gives more importance to movements at the bottom part of the distribution. These higher+degree dominance criteria are obtained by strengthening the Pigou+Dalton principle of transfers. Although the Pigou+Dalton principle captures inequality aversion, it is not sensitive to the position of equalising transfers in the income distribution.
The principle of diminishing transfers “ensures that more weight in the inequality assessment is attached to transfers taking place lower down in the distribution” (Shorrocks and Foster, 1987: 485)9. With the principle of diminishing transfers, Shorrocks and Foster (1987) try to prevent such regressive transfers that take place in the higher part of the distribution (from a less rich individual to a much richer individual) to increase inequality. Davies and Hoy (1995) also use the principle under the name of aversion to downside inequality (ADI) and prove that even if Lorenz curves intersect, distributions can still be ranked if we have a social utility function which holds ADI. In other words they show that in comparing two Lorenz curves intersecting once, the distribution with less downside
8
First+degree Lorenz dominance means that the higher of two non+intersecting Lorenz curves is preferred. Please see Aaberge (2008) for the definitions of different degrees of Lorenz dominance. 9
inequality dominates the other distribution. Aaberge (2008) uses more general definitions of the second degree Lorenz dominance. They define second+degree downward and upward dominance to make their point. The terms upward and downward refer to the direction of the aggregation of the Lorenz curve. When income shares are aggregated below with weights linearly decreasing with increasing rank of income unit in the distribution, then we obtain second+degree upward Lorenz dominance. With second+degree upward Lorenz dominance we have “a social decision+maker (who) pays more attention to inequality in the lower than in the upper part of the income” (Aaberge, 2008: 8). Thus, for second+degree downward dominance we have a social decision+maker who pays more attention to inequality in the upper than in the lower part of the income.
In the fiscal incidence literature, when researchers face the difficulty of ranking distributions before and after government intervention, S+Gini Indices are used for higher+ degree dominance by changing the ethical parameter. This gives the opportunity to see how the distributions can be ranked with different social welfare functions. We will discuss this issue later in the chapter under the heading of extended Gini test.
2.2.3 Welfare Dominance Analysis in the Public Finance
Context
As concentration curves draw the distribution of tax liabilities or benefits, it has been used to compare progressivity of different taxes and benefits. The welfare dominance analysis10 suggested by Yitzhaki and Slemrod (1991) has been used to rank public transfers and taxes in terms of their progressivity by using concentration curves. Following Atkinson (1970), they borrow the methodology of stochastic dominance from the finance literature, which is employed to rank portfolios. They establish that for any social welfare function that favors an equitable distribution of income, if the concentration curve of one commodity (say
10
For the full development of the methodology with different country cases, see Yitzhaki and Thirsk (1990), Mayshar and Yitzhaki (1995) and Yitzhaki and Lewis (1996). The full name of the method is ‘marginal conditional welfare dominance’.
food) is everywhere above another commodity’s (say luxury goods) concentration curve, changing the tax structure marginally by reducing taxes on food and increasing those on luxury goods by just enough to keep total revenues constant will improve social welfare when the concentration curve for food is everywhere above that of luxury goods. For the benefit case, if the concentration curve of a benefit is everywhere above another benefit’s concentration curve, marginally raising the subsidy of the first benefit while reducing that of the second will improve social welfare (Yitzhaki and Slemrod, 1991; Sahn and Younger, 2000).
By using this approach, we could rank benefits/taxes by just comparing the locations of the concentration curves of the public policies. However, concentration curves provide only partial ranking since they may intersect so that the ranking concentration curves suggest can be only partial (Kakwani, 1986: 72+85). Therefore, single summary measures for progressivity have been offered to reach complete ranking. Those measures will be studied below.
2.3 Progressivity Measures
Before we start with measures of progressivity, it would be worth showing the welfare improving role of progressivity. Jacobsson (1976) and Fellman (1976) showed that if tax liabilities are distributed more unequally than pre+tax incomes, in other words, if the tax is progressive, then the after+tax distribution is less unequal than the pre+tax distribution if there is no reranking. Lambert (1993:152+153) proves that an inequality reducing progressive tax system is also welfare improving by using Shorrocks’ theory of generalised Lorenz dominance. If income taxation is proportional, then the Lorenz curve for post+tax income coincides with the Lorenz curve for pre+tax incomes since proportional income tax does not change the distribution of incomes.
) ( )
(p L p
where Lprop indicates the Lorenz curve for post+tax incomes in the case of proportional income tax. Therefore, we can write the following, whic