189
Comparison of milk production from
clover-based and fertilizer-N-based grassland
on a clay-loam soil under moist temperate
climatic conditions
J. Humphreys1†, I.A. Casey2 and A.S. Laidlaw3
1Teagasc, Moorepark Dairy Production Research Centre, Fermoy, Co. Cork, Ireland
2Department of Chemical & Life Sciences, Waterford Institute of Technology, Cork Road, Waterford, Ireland 3Agri-Food and Biosciences Institute, AFBI-Crossnacreevy, 50 Houston Road, Crossnacreevy,
Belfast, Northern Ireland, BT6 9SH
This study, conducted over four years (2003–2006), compared herbage production, nutritive value of herbage, the length of the grazing season and milk production per cow and per hectare from grassland systems based on (i) white clover (average 219 g/kg of herbage DM) (WC) receiving on average N application of 90 kg/ha (s.d. 6.4) in spring and successive 0.2 of the area over-seeded annually with white clover seed and (ii) fertilizer N (FN) input of 226 kg/ha (s.d. 9.7). The stocking density of Holstein-Friesian dairy cows on both systems was 2.0/ha 2003 and 2.2/ha in each of the following three years. There were 22 cows per system in 2003 and 24 cows per system in each of the following three years. Cows calved within a 12 week interval in spring with mean calving date in mid-February. Milk was produced until mid-December each year. Total
annual herbage DM production was lower (P < 0.01) on WC than FN (0.92 of FN).
There were no (P > 0.05) differences in the in vitro organic matter digestibilities of pre-grazing herbage. The crude protein concentration in pre-grazing herbage DM was higher (P < 0.001) on FN than WC: 219 and 209 (s.e. 8.4.) g/kg, respectively. There were no (P > 0.05) differences in annual production of milk per cow (mean 6524 kg; s.e. 83.9 kg), live-weight or body condition score between the two systems. There were no (P < 0.05) differences in the lengths of the grazing season, which averaged 254 days (s.e. 0.9). Although there was no difference in performance per cow, the higher herbage production indicates that a higher stocking rate and milk output per hectare was
Introduction
In Ireland, grass/clover swards potentially can produce about 0.8 times the milk out-put from grass swards receiving N inout-put
of in excess of 350 kg ha−1 annum−1. Milk
produced from clover-based swards receiv-ing no fertilizer N in a trial in Co Wexford was 0.87 that from grass receiving 387 kg/ha (Ryan, 1986). Although Humphreys, O’Connell and Casey (2008) found milk production from a clover-based system with cows stocked at 1.75/ha and an annual fertilizer N input of 80 kg/ha was 0.70 that from grass receiving 353 kg/ha, herbage production from the clover-based system was proportionately 0.80 of the intensive system; the stocking density of dairy cows was not sufficiently high to fully utilize all the herbage grown in the clover-based sys-tem. These relative production levels are in line with those from New Zealand. For example a clover-based system receiving no fertilizer N produced 0.80 of the herb-age per ha (Ledgard et al., 2001) and 0.81 of the milk per ha (Ledgard, Crush and Penno, 1998) of a system receiving a fertil-izer N input of 413 kg/ha per year over 5 grazing seasons.
The annual rate of fertilizer N input to the more intensive systems in the exper-iments described above are no longer permitted under Statutory Instruments (SI) No. 101 (2009) which implements the Nitrates Directive (European Council, 1991) in Ireland. Maximum allowable fer-tilizer N input to grassland is now linked to stocking density and is currently approxi-mately 275 kg/ha for farms that have been granted a derogation from the more strin-gent limits of SI No. 101. Furthermore, the cost of fertilizer N has increased
rela-tive to milk price in recent years (CSO, 2008) and fertilizer N use in Ireland has fallen by 30% in the last decade due to a number of factors (Humphreys, 2008), the main one being the increasing cost relative to farm-gate product prices. Substantial reductions in fertilizer N use are evident in many countries in the European Union since 1990 (EFMA, 2005).
White clover-based swards have poor spring growth and poor yields of first-cut silage. Further, persistence of clo-ver is variable causing inconsistent pro-duction from year to year compared to fertilizer-N-based grassland (Frame and Newbould, 1986). As an early turnout to pasture in spring confers clear eco-nomic advantages (Sayers and Mayne, 2001; Dillon et al., 2002; Kennedy et al., 2005) the necessity to delay turnout date would be a serious impediment to the adoption of white clover-based grassland on Irish farms. To solve the first two problems outlined above, in Humphreys
et al. (2008) and in the experiment reported
here, fertilizer N was applied to the clover-based swards in spring (until mid-April) for early spring herbage production and for first-cut silage production. Fertilizer N can be applied in spring at rates of 50 to 70 kg/ha to give improved production in spring without affecting annual pro-duction of clover-based swards (Laidlaw, 1980), although it can cause a lower clover content in swards later in the growing sea-son (Frame and Boyd, 1987).
Regarding variability in clover per-sistence, as an insurance against clover die-out Humphreys et al. (2008) have successfully demonstrated in a full scale production system that clover can be intro-sible from FN than WC. Nevertheless, the WC swards supported an annual stocking density of 2.15/ha and a milk output of 14 t/ha.
duced and established by over-seeding into grass silage stubble. They have also shown that clover concentration can be main-tained by a programme of over-seeding of about one fifth of the area each year, securing consistent contribution of clover from year to year.
To evaluate the milk production poten-tial of a grass/white clover system in which the components of spring-applied nitrogen fertilizer and a routine of over-seeding with clover were incorporated, the system was compared to a fertilizer-N-based grassland system over four years. The present paper examines herbage produc-tion, nutritive value of herbage, length of the grazing season and milk production per cow and per ha from the two systems. Results from the grass/clover system are compared with data from similar experi-ments conducted in temperate regions of the world. The results of environmental measurements will be reported elsewhere.
In contrast to the study of Ryan (1986; 1989) in which cows with low genetic potential for milk production, by present day standards, were stocked at a high rate and grazed a relatively short season (mid-April to late October), in this study spring-calving cows with higher genetic potential grazed over a long grazing season (early February to late November) and produced most of their milk while at pasture.
Materials and Methods
Site Characteristics, grass growth and weather conditions
This experiment was conducted at the Teagasc Solohead Dairy Research Farm
(lat 52°51′N; 8°21′W; altitude 95 m above
sea level). The soil had clay loam soil tex-ture (Anon., 1951); 25% sand and 42% clay in the upper 20 cm of the soil. The topography of the site was relatively flat. Drainage was impeded, contributing to
waterlogged conditions under high rain-fall. Weekly grass growth data was mea-sured on plots (CF-plots) adjacent to the main experiment using the methodology described by Corrall and Fenlon (1978), with overlapping harvests at four-week intervals throughout the entire growing season replicated five times. Annual fertil-izer N input was 300 kg/ha. Meteorological data were recorded at the climatological station located on the research farm as described by Fitzgerald and Fitzgerald (2004). Soil moisture deficits (SMD) dur-ing the experimental period were calculat-ed using the model developcalculat-ed by Schulte
et al. (2005).
Experimental layout and design
There were two systems of grassland-based milk production, both stocked with spring-calving Holstein-Friesian dairy cows. The grassland area had previously been sec-tioned into five blocks depending on soil type and drainage status as described by Humphreys et al. (2008). The area used in this experiment was 22 ha: 11 ha of clover-based swards and 11 ha of predomi-nantly perennial ryegrass swards. These clover-based and grass swards were previ-ously used in the experiment described by Humphreys et al. (2008). The white clover-based swards were established between 1999 and 2002, received annual input of 80 kg/ha of fertilizer N between 2000 and 2002, and had an average clover
concen-tration of herbage DM of 240 g kg−1 in
2001 and 2002. The grass swards received approximate annual fertilizer N inputs of either 250 or 350 kg/ha between 2000 and 2002 and the clover concentration of these
swards was <50 g kg−1 DM during these
three years.
In the present experiment, average annual fertilizer N input to the clover-based system (WC) was 90 kg/ha (annual range 84–99). Approximately 0.2 of the
area of this treatment was over-seeded with white clover seed each year to main-tain the clover concentrations of swards. This involved broadcasting 5 kg/ha of clo-ver seed (equal proportions by weight of cultivars Aran and Avoca) with fertilizer (containing P at 0.07 g/g and K at 0.30 g/g) onto silage stubble after first-cut silage in late May. The fertilizer-N-based grassland system (FN) received an average annual input of 226 kg/ha of fertilizer N (annual range 219–240). In both systems fertilizer N refers to urea (N concentration 0.46 g/g) applied until the end of April each year and calcium ammonium nitrate (N concentration 0.275 g/g) applied between early May and mid-September. These were the only forms of synthetic fertilizer N used in this study.
Stocking density of dairy cows was the same on both systems: 2.0/ha in 2003 and 2.2/ha in each of the following three years. There were 22 cows per treat-ment in 2003 and 24 per treattreat-ment in each of the following three years. Each spring, cows were divided into four main groups on the basis of lactation number
(1, 2, 3 & ≥4) and then sub-divided into
sub-groups of two on the basis of calving date. From within each sub-group one cow was randomly assigned to each herd. The same procedure was followed each spring. Herds were randomly assigned to system each spring. Cows calved between late January and late April each year and the mean calving dates were 27 February in 2003, 27 February 2004, 17 February 2005 and 16 February 2006. The length of the lactation was from the commencement of calving in late January until the third week of December in each year.
Application of fertilizer N and slurry management
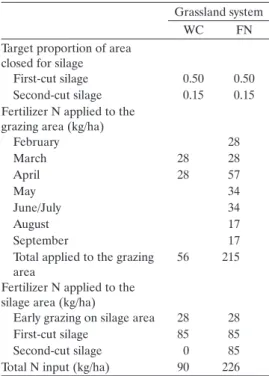
The patterns of application of fertilizer N for each system are presented in Table 1. Fertilizer N was applied for early grazing
on the silage areas during late February or early March. The entire area was grazed between turn-out and early April. Fertilizer N for the area providing first-cut silage was applied in early April in both systems. Fertilizer N for the area providing second-cut silage was applied in early June to the FN system but not the WC system. After first-cut silage in late May or early June and after second-cut silage in mid- to late-July the silage areas were subsequently used for grazing and received similar inputs of fertilizer N to that applied to the grazing areas of each system (Table 2).
Cows were housed during the winter and fed together as one group. All of the slurry produced was contained in a sin-gle storage tank. Equal volumes of slurry were applied back to each system based
Table 1. Target proportion of the area closed for silage, patterns of application of fertilizer N to the grazing and silage areas of two grassland-based systems of milk production
stocked at the same density
Grassland system
WC FN
Target proportion of area closed for silage
First-cut silage 0.50 0.50 Second-cut silage 0.15 0.15 Fertilizer N applied to the
grazing area (kg/ha)
February 28 March 28 28 April 28 57 May 34 June/July 34 August 17 September 17
Total applied to the grazing area
56 215 Fertilizer N applied to the
silage area (kg/ha)
Early grazing on silage area 28 28 First-cut silage 85 85 Second-cut silage 0 85 Total N input (kg/ha) 90 226
on calculated volumes of slurry produced per cow (DAFF, 1996). Slurry was applied in late January each year to approximately two-thirds of the area of each system. Slurry was also applied on the area for first-cut silage in late March and after har-vests of silage. Slurry was applied using a downward-facing splash-plate.
Grazing management
Pasture was allocated to cows in a rota-tional grazing system and post-grazing heights, measured with a rising plate meter (Ashgrove Pastoral Products, Palmerston North, New Zealand), were used to determine when cows moved to the next section. Target post-grazing heights were 50 mm in February and March and allowed to rise progressively during the late spring and summer to 65 mm in July and August. Target post-grazing heights were 60 mm in autumn. Rotations were approxi-mately 24 d in length during the main graz-ing season between April and September.
Milk production, live-weight and body condition score
Milk yield per cow was recorded at each milking and the composition of milk from each cow was measured for a successive morning and evening milking once per
week using a Milkoscan 203 (Foss Electric DK-3400, Hillerød, Denmark). Solids-cor-rected milk yield was calculated using the equation of Tyrell and Reid (1965). The live weight of cows was recorded each week using a weighing scales and the Winweigh software package (Tru-test Limited, Auckland, New Zealand). Body condition score (Lowman, Scott and Somerville, 1976) of each cow was record-ed once fortnightly.
Length of the grazing season, sampling of herbage, herbage analyses and herbage production
The length of the grazing season was measured in terms of days at pasture where one day was defined as when all the cows per system were out day and night and one-half day when cows were out only by day. In spring when lactating cows were outdoors and cows yet to calve remained indoors, the proportion of cows outdoors per system was recorded. Likewise, when cows were being housed as they were dried off in the early winter the proportion of cows outdoors per system was recorded.
Herbage was sampled immediately before grazing within each system to get
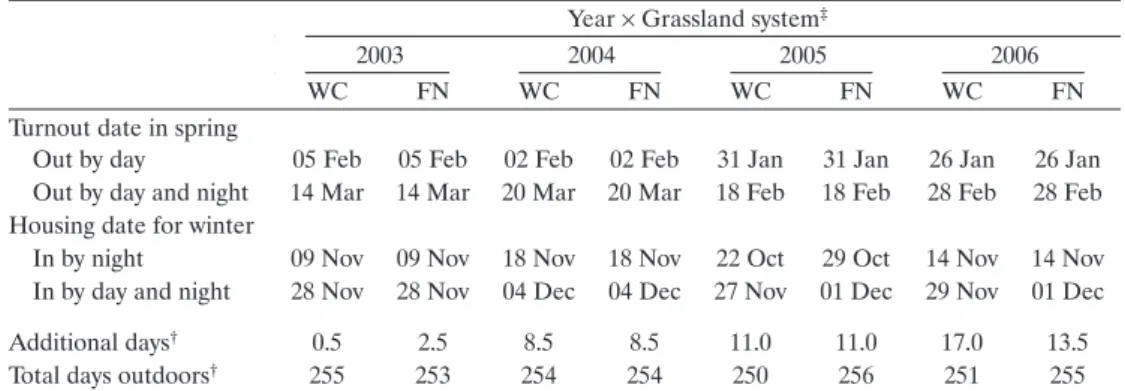
Table 2. Dates of turnout of calved cows in spring and housing for the winter, additional days housed during the main grazing season (to avoid excessive damage to the sward) and total days grazing
Year × Grassland system‡
2003 2004 2005 2006
WC FN WC FN WC FN WC FN
Turnout date in spring
Out by day 05 Feb 05 Feb 02 Feb 02 Feb 31 Jan 31 Jan 26 Jan 26 Jan Out by day and night 14 Mar 14 Mar 20 Mar 20 Mar 18 Feb 18 Feb 28 Feb 28 Feb Housing date for winter
In by night 09 Nov 09 Nov 18 Nov 18 Nov 22 Oct 29 Oct 14 Nov 14 Nov In by day and night 28 Nov 28 Nov 04 Dec 04 Dec 27 Nov 01 Dec 29 Nov 01 Dec Additional days† 0.5 2.5 8.5 8.5 11.0 11.0 17.0 13.5 Total days outdoors† 255 253 254 254 250 256 251 255 † One day = out grazing day and night and one half day = out grazing by day only on two systems of grass-land-based dairy production.
five samples of pre-grazing herbage per grazing rotation. Likewise, after each graz-ing, herbage was sampled adjacent to where the pre-grazing herbage was sam-pled. On each occasion four strips, each 5 m long and 0.55 m wide, were harvested per paddock using a Honda HRH-536 lawn-mower (Toss Bryan, Fermoy, Ireland) set at a cutting height of 40 mm above ground level. These were bulked and weighed to determine herbage mass. A sub-sample was dried for 16 h in an oven
with forced-air circulation at 100 °C to
determine DM concentration. A sec-ond sub-sample was taken and stored at
−20 °C before being freeze dried and
milled through a 0.2 mm sieve prior to chemical analyses for in vitro organic mat-ter (OM) digestibility (Morgan, Stakelum and O’Dwyer, 1989). The N concentra-tion in herbage DM was determined using a LECO 528 auto-analyser (LECO Corporation, St. Joseph, MI, USA) and multiplied by 6.25 to give the crude pro-tein (CP) concentration in herbage DM.
Prior to harvesting herbage for silage, each silage paddock was divided into three sections. Within each section four strips (5.0 m × 1.1 m) of herbage were harvested using an Agria auto-scythe (Etesia UK Ltd., Warwick, UK). The herbage har-vested within each section was bulked and weighed, and a sample taken for determi-nation of DM concentration as described above. A second sub-sample was taken and analysed for in vitro OM digestibility and N concentration in herbage DM as described above. Silage intake for the entire herd was estimated during the winter-housing period as silage provided to cows minus rejected material. The net energy (NE) values of the herbage harvested for silage were related to the in vitro OM digestibil-ity. The energy output in milk and energy required for maintenance and pregnancy were calculated using the methodology
described by Humphreys et al. (2008). The NE concentration of the concentrate was calculated using the feed unit for lactation (UFL) concentration of the ingredients (O’Mara, 1996). The NE concentration of pasture was related to its chemical com-position (Jarrige, 1989). Intake of grazed pasture DM by the cows was calculated by the difference between NE intake from silage and concentrate DM and that need-ed to meet the NE requirements for milk production, maintenance and body weight change (Jarrige, 1989).
The proportion of white clover in herbage
The proportion of white clover in the herbage of each paddock was determined during April and August each year. At twenty-five locations, randomly selected within each paddock, a strip of pasture 100 mm wide × 150 mm long was cut at a height of 50 mm above ground level using a hand shears. All of the harvested pasture was collected and bulked for each paddock. The white clover herbage in each bulked sample was separated from the remainder of the herbage which mostly consisted of perennial ryegrass and both the white clover and the remaining herb-age were dried at 100 °C for 16 h to deter-mine the clover content of swards on a DM basis.
Statistical analyses
Animal production data (milk produc-tion, milk composiproduc-tion, live-weight and body condition score) were subjected to ANOVA. Milk yields and yields of fat, protein and lactose in the third week of lactation were used as covariates for the analysis of total milk yields and yields of fat, protein and lactose. Pre-calving live weight and body condition score were used as covariates when analysing live weight and body condition score during and at the end of lactation.
Measurements of herbage from the grazing area in both systems were con-ducted on five occasions (replications) per rotation, with eight rotations per year over each of four years. Rotation was included as repeated measures effect in the ANOVA. The in vitro OM digestibil-ity and CP concentration in pre-grazing herbage were analysed as a three factor (system × sampling date × year) ANOVA examining the main effects of each factor and all interactions between factors, with five replicates.
Characteristics of the herbage harvested for silage (in vitro OM digestibility and N concentration in silage DM) were subjected to ANOVA that included system, year, paddock from which the herbage was harvested as a split-plot, with three replicates. The main effects of system and year, and their interactions were examined.
Results
The length of the grazing season, weather conditions and concentrates fed to cows
Lactating cows were turned out to pasture by day from late January or early February each year depending on pasture supply and the suitability of ground conditions for grazing (Table 2). On average, cows spent 254 days at pasture. There was no (P > 0.05) difference in the length of the grazing season between the two grassland systems (s.e. 0.9) and the differences among years were minor. Occasionally cows were housed by night during the main grazing season due to very wet weather conditions and to avoid excessive damage to the soil surface. For example, exceptionally wet conditions during May 2006 (Figure 1b,c) meant that cows had to be housed on 15 consecutive nights during that period. Although May 2006 had exceptionally high rainfall, very dry
soil conditions were experienced dur-ing late June, July and August, leaddur-ing to lower pasture production during July and August that year compared with the previous three years (Figure 1d). Average annual rainfall (mm) was 845, 1000, 885, 1120 for each of the four years (2003– 2006), respectively, compared with a 10-year average of 1005 mm at Solohead Research Farm. Despite an exceptionally dry summer, annual rainfall in 2006 (1120 mm) was above average. There was a (P < 0.05) interaction between system and year for the quantity of concentrate DM fed to cows; while there was no differences in the quantities of concentrates fed to cows in the two systems in each of the three years, 2003, 2004 and 2005, a greater (P < 0.05) quantity was fed to cows on WC than FN in 2006 (Table 3).
Milk production, body weight and body condition score
There were no differences in annual milk production per cow (mean (s.e.) 6524 (83.9) kg) between systems. Likewise, there were no differences between systems in annual production per cow for solids corrected milk (6422 (71.6) kg), milk fat (273 (3.2) kg), milk protein (233 (2.7) kg), lactose (309 (3.9) kg) or for calving date (22 February (0.83) days), lactation length (286 (1.5) days), body weight during the experiment (595 (4.4) kg), body condition score during the experiment (2.98 (0.022) units) or body condition score at the end of lactation (2.92 (0.027) units). Furthermore there were no differences between years or interactions between system and year for any of the above variables.
Herbage production and the nutritive value of herbage
Annual yields of herbage DM were higher (P < 0.01) on FN than WC (Table 3). Annual herbage production on the
CF-0 40 80 120 160 200 01/01/03 01/05/03 01/09/03 01/01/04 01/05/04 01/09/04 01/01/05 01/05/05 01/09/05 01/01/06 01/05/06 01/09/06 Rainfall (mm/month) (b) 0 5 10 15 20 25 01/01/03 02/05/03 31/08/03 30/12/03 29/04/04 28/08/04 27/12/04 27/04/05 26/08/05 25/12/05 25/04/06 24/08/06 23/12/06 Soil temperature (∞C) (a) 0 20 40 60 80 100 120 01/01/03 02/05/03 31/08/03 30/12/03 29/04/04 28/08/04 27/12/04 27/04/05 26/08/05 25/12/05 25/04/06 24/08/06 23/12/06
Daily grass growth rate (kg/ha)
(d) -15 0 15 30 45 60 75 01/01/03 02/05/03 31/08/03 30/12/03 29/04/04 28/08/04 27/12/04 27/04/05 26/08/05 25/12/05 25/04/06 24/08/06 23/12/06
Soil moisture deficit (mm/day)
(c)
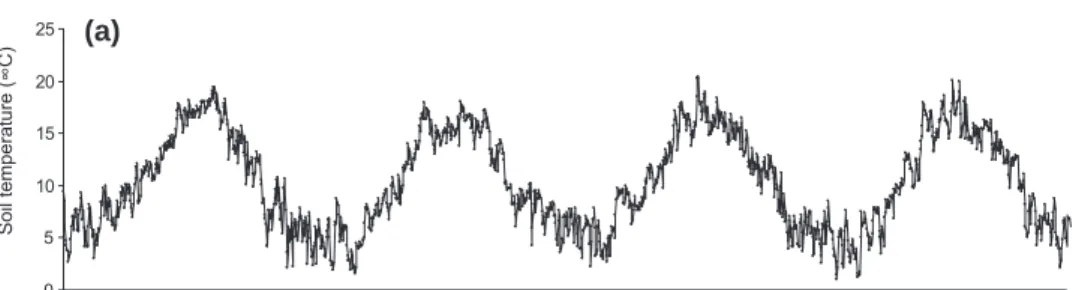
Figure 1. Soil temperature at 100 mm depth in soil (a), monthly rainfall (b), soil moisture deficits (c) and daily grass growth rates measured using the methodology of Corral and Fenlon (1978) (d) between 1 January 2003 and 31 December 2006 at the experimental site.
plots were (t/ha): 13.4, 12.9, 13.0 and 10.7 in each of the four years 2003 to 2006, respectively. Lowest yields were recorded in 2006, similar to the grassland systems experiment. Annual herbage production from FN was 0.96, 0.97, 0.99 and 1.08 of the herbage yields measured on the CF-plots in each of the four years. Annual herbage production from WC was 0.89, 0.92, 0.92 and 0.95 of the CF-plots. Annual yields of clover herbage DM were higher (P < 0.01) on WC than FN (Table 3). The average annual proportion of clover in total herbage DM was 219 g/kg on WC compared with 60 g/kg on FN.
In general, pre-grazing mass of herbage DM was higher (P < 0.001) on FG than WC (1835 versus 1646 kg/ha; s.e. 31.2 kg/ha), although this was influenced by an interaction (P < 0.05) with sampling date and year. There was little difference between systems in 2003 and the greatest difference was recorded in 2006. Pre-graz-ing herbage mass varied with samplPre-graz-ing date but followed no particular trend dur-ing the experiment. There was no differ-ence in post-grazing herbage DM mass between systems (FG, 506 and WC, 494 kg/ha; s.e. 18.6 kg/ha) and there were no interactions with sampling date, year or sampling date and year. Post-grazing mass
was influenced by a (P < 0.01) interac-tion between sampling date and year. Lowest post-grazing masses were recorded in spring and autumn and highest in late summer in line with the target post-grazing heights imposed.
The in vitro OM digestibility of pre-grazing herbage was not significantly influenced by the grassland system (Figure 2a) and there were no interactions with sampling date, year or sampling date and year. There was a (P < 0.001) inter-action between sampling date and year. Lowest digestibilities were generally recorded between July and September (s.e.m. 8.1; Figure 2). The CP concen-tration in pre-grazing herbage DM was higher (P < 0.001) on FN than WC: 219 and 209 g/kg, respectively (s.e. 8.4), and this was not influenced by interac-tions with sampling date, year or sampling date and year (Figure 2b). The CP con-centration in pre-grazing herbage DM was influenced by an interaction (P < 0.001) between sampling date and year. Highest concentrations were generally recoded in spring and autumn and lowest in summer.
Consistently greater (P < 0.01) quanti-ties of herbage were harvested for silage from FN than from WC each year (Table 3).
Table 3. Concentrates dry matter (DM) fed to cows, annual herbage and clover DM production, herbage DM harvested for silage, in vitro organic matter (OM) digestibility and crude protein
concentrations in herbage DM harvested for silage during four years in two systems of grassland-based dairy production
Year × Grassland system† s.e. Significance
WC FN
Total concentrate DM fed per cow (kg) 531 520 5.1
Total herbage DM production (kg/ha) 11507 12453 105.8 ** Clover herbage DM production (kg/ha) 2515 753 130.9 ** Herbage harvested for silage
Herbage DM harvested per cow (kg) 1875 2308 42.1 ** In vitro OM digestibility (g/kg) 788 781 3.4
Crude protein concentration (g/kg DM) 161 160 3.7 † See Table 1.
The in vitro OM digestibility of herb-age and the CP concentration in herbherb-age DM harvested for silage were not different between the systems, nor were there interactions between system and year (Table 3).
Discussion
Grass growth, weather conditions, concentrates and silage fed to cows
The CF-plots received 300 kg N ha−1
annu ally compared with 226 kg N/ha for FN. However, considerable quantities of N were recycled in excreta each year on FN either by the grazing cows or as slurry and dirty water, which explains the similar-ity in herbage yields in the FN system and the CF-plots. Highest annual DM yields on the CF-plots were recorded in 2003 and there was little difference in annual
herb-age DM yields between 2004 and 2005. Annual herbage production during 2006 in CF, FN and WC was substantially lower than these earlier years (Figure 1d) mainly due to low rainfall and high SMD between late June and late August 2006 (Figure 1b,c) and explained the higher quantity of concentrates fed in both systems and lower amounts of silage made, especially in WC, in 2006 (Table 3). Furthermore, fertilizer N input to both systems was higher in 2006 than preceding years but the length of the grazing season was no different from the other years (Table 2). This is partly due to the cows being supplemented with con-centrates at pasture during the summer and partly by above average grass growth rate during the autumn and early winter 2006 (Figure 1d), which compensated, to a certain extent, for the poor pasture production during the summer. In 2003 700 750 800 850 900 01/01/03 02/05/03 31/08/03 30/12/03 29/04/04 28/08/04 27/12/04 27/04/05 26/08/05 25/12/05 25/04/06 24/08/06 23/12/06 OM digesti b ility (g/kg) (a) 100 150 200 250 300 350 01/01/03 02/05/03 31/08/03 30/12/03 29/04/04 28/08/04 27/12/04 27/04/05 26/08/05 25/12/05 25/04/06 24/08/06 23/12/06 Crude protein (g/kg) (b)
Figure 2. The in vitro organic matter (OM) digestibility of pre-grazing herbage (a) and the crude protein concentrations in pre-grazing herbage (b) throughout four years in two systems of grassland-based dairy production (WC – clover-based system, annual fertilizer N input of 90 kg/ha [] and FN – fertilized grass-based system, annual fertilizer N input of 226 kg/ha []). Means of five replicates.
a large surplus of silage was produced on both systems (stocked at 2.0 cows per ha). It was necessary to harvest 1635 (s.d. 30.4) kg herbage DM per cow to meet silage requirements, on average, over the four years. For each of the three years, 2004 to 2006, a surplus of herbage was harvested for silage on FN. There was also more than enough on WC in 2004 and 2005 but not in 2006. On the other hand, there was sufficient silage made on the WC system averaged over the four years.
Milk production per cow and sward nutritive value
There were no detectable differences in milk production per cow or milk com-position between the grassland systems in this experiment. Most of the milk was produced while cows were at pasture. On average over the four years, grazed pas-ture accounted for 0.67, grass-silage 0.23, and concentrate 0.10 of the DM consumed by the dairy cows on both systems. This indicates that, although the swards on WC had substantially higher clover concentra-tion in herbage DM than FN, this did not result in improved cow performance in terms of milk yield, milk composition, live weight or body condition score. This is in agreement with Humphreys et al. (2008) and similar systems-scale experiments in New Zealand, Germany, the Netherlands and Scotland (Table 4). In the experi-ments described in Table 4, there were generally no differences in milk output per cow from clover-based and fertilizer-N-based grassland. An exception was the second experiment (conducted in 1980/81) of Bryant, McDonald and Clayton (1982) where the length of lactation was cur-tailed by a shorter growing season on the clover-based system, which resulted in lower milk output per cow. The approach, where lactation length was determined by pasture availability, is also evident in
the experiment described by Ledgard et
al. (1998).
It has been shown that clover herbage has higher nutritive value than peren-nial ryegrass herbage (Wilman and Riley, 1993) and that intake of clover herbage by cows and milk production are higher than for perennial ryegrass (Thomson et al., 1985). However, higher milk production from mixed white clover and perennial ryegrass swards is most evident when there is a high proportion of clover (>500
g kg−1 DM; Harris et al., 1998) or where
clover-based swards are compared with swards receiving no fertilizer N (Wilkins
et al., 1994; Phillips and James, 1998). In
the experiment of Wilkins et al. (1994) white clover constituted 10, 150 and 200 g/kg of herbage OM in each of three swards. No fertilizer N was applied dur-ing the experiment (late April to early July) and CP concentrations in herbage DM were low on the low clover treat-ment and, in early July, fell to 74 g/kg compared with 110 g/kg on the high clo-ver treatments. These CP concentrations are lower than the threshold value of 140 g/kg indicated by Peyraud et al. (2001) as being necessary to avoid negative impacts on herbage intake and milk yield of dairy cows. The higher herbage intakes and higher milk yields in the experiment of Wilkins et al. (1994) can be attributed to biological N fixation (BNF) associated with the higher clover concentrations contributing to higher CP concentrations in the herbage DM. In contrast, Ribeiro Filho, Delagarde and Peyraud (2005) described an experiment where fertilizer N was applied to perennial ryegrass and there was no difference in CP concentra-tions compared with white clover-based swards that received no fertilizer N but
contained 270 g kg−1 clover in live
herb-age DM. Herbherb-age digestibility, herbherb-age intake and milk yield were higher on the
T
able 4. The number of years that comparisons took place, stocking densities of dairy cows, annual fertilizer N input, concentr
ates fed to cows, annual herbage
production and milk production in systems-scale comparisons of milk production from clover-based and N-fertilized grassland
A uthors No. of years Stocking density (L U/ha) F
ertilizer N input (kg/ha) Clover in herbage (g/kg DM) Concentrates (kg) fed per Herbage DM production (t/ha) Milk P roduction per Cow (kg) Hectare (t) Cow Hectare Bryant 1 et al . (1982) 1 3.86 0 270 211 815 16.25 3468 13.39 3.86 86 270 211 815 16.11 3500 13.51 Bryant 1 et al . (1982) 1 4.09 0 230 245 1002 16.97 3196 13.07 4.09 137 195 245 1002 18.08 3377 13.81 W
eissbach and Ernst
2 (1994) 6n a 3 0 150 na 8.56 na 308 na na 14.20 R yan 4 (1986, 1989) 5 2.52 122 385 600 1512 na 4224 10.64 3.20 361 <50 600 1920 na 4068 13.02 L edgard 5 et al . (1998) 5 3.30 0 152 na na 16.38 3953 12.96 3.30 215 107 na na 18.45 4735 15.52 3.30 413 49 na na 20.58 4858 15.92 Schils 6 et al . (2000) 3 1.90 17 290 1847 3509 10.10 8294 15.75 2.20 208 <50 1828 4022 10.80 8095 17.80 L each 7 et al . (2000) 1 1.90 0 253 1096 2082 9.24 5719 10.87 2.40 350 9 1412 3389 10.35 5724 13.74 Humphreys 8 et al . (2008) 2 1.75 80 240 535 936 10.57 6550 11.46 2.10 180 39 535 1124 10.75 6275 13.18 2.50 248 20 535 1338 12.06 6242 15.61 2.50 353 7 535 1338 13.26 6375 15.94 P resent study 4 2.15 90 219 531 1142 11.51 6521 14.02 2.15 226 60 520 1118 12.45 6526 14.03
1 Bryant, MacDonald and Clayton (1982) Calving in late winter and cows were milked at pasture. L
actation length was largely dete
rmined by pasture supply.
2 There was no significant differences in concentrates fed per cow (4 kg cow -1 per day) or in milk production per cow (22.3 kg fat corrected milk per day).
3 Data not available. 4 Calving in late winter; grazing season from 9 April to 20 October. No fertilizer N was applied to the clover-based swards used
for grazing; fertilizer N was applied
to a non-clover silage area on the low fertilizer N input system. Clover concentration refers to the clover concentration of th
e clover-based swards in late summer
only. 5 L edgard et al ., 1998; L edgard et al ., 1999; L edgard et al
., 2001; Calving in late winter and cows were milked for 250 to 290 days at pasture. Minimal amounts of
concentrate supplementation were fed to cows. 6 Schils
et al
. (2000a), Schils
et al
. (2000b) Calving from October to April; grazing season from first week of April to last week of October.
7 L
each
et al.
, 2000; Bax and Thomas, 1992. R
esults from final year of a three year experiment. A
utumn calving; cows dry during much of the g
razing season, which
extended from late spring to mid-October. Nine days later turnout in spring on the clover-based swards. 8 Spring calving dairy cows managed in much the same way as the present experiment.
(T
ab
le 4 Continued
)
N-fertilized perennial ryegrass than on the clover-based swards. In an earlier experiment, Ribeiro Filho, Delagarde and Peyraud (2003) found that white clover-based swards with clover
concen-trations of, on average, 420 g kg−1 of live
herbage DM increased herbage intake and milk yield of grazing dairy cows com-pared with N-fertilized perennial ryegrass swards. In the present experiment and in all the systems-scale experiments pre-sented in Table 4, the clover concentra-tion of herbage was not sufficiently high to show improved milk production from grazing dairy cows.
There were no differences in the in vitro OM digestibility of grazed swards between the systems, which partly accounts for the absence of a difference in cow perfor-mance in the present experiment. Cool temperatures in late spring and summer, which avoids high rates of lignification, and evenly distributed rainfall (Figure 1a,b) both support high digestibility of perennial ryegrass once there is adequate supply of nutrients, particularly N, in the soil (Deinum and Dirven, 1974). In the present experiment, lowest digestibilities (Figure 2a) tended to coincide with high-est soil moisture deficits, most evident in the summer 2006 (Figure 1c). The CP concentration in pasture DM was lower on WC than FN; 209 versus 219 g/kg DM, which is a relatively small difference, and was lowest in June, July and August each year (Figure 2b). However, these lowest CP concentrations were not so low as to limit intake of pasture or milk yield of the grazing dairy cows (Peyraud et al., 2001; NRC, 2001).
There were no differences in the in
vitro OM digestibility and N
concentra-tion in herbage DM harvested for silage; both systems received the same inputs of fertilizer N for first-cut silage (Table 1), which accounted for 0.72 of silage
production on FN and 0.78 of silage pro-duction on WC (overall s.d. 0.155). There were also no differences in the N concen-tration in the concentrates fed to cows, which were common to both treatments. The main feed in winter was silage, sup-plemented in early and late lactation by concentrates. The N concentration of the winter diet was the same regardless of system and the same applies to the excre-ta produced during the indoor period. For these reasons, allocating the slurry to the two systems from a common pool was unlikely to have had important con-sequences for the quantities of N recycled back to each system.
Herbage production and soil N supply
Although there were substantial differ-ences in fertilizer N inputs between the two systems, particularly in the seven month period between May and the end of the grazing season in late November, it is evident that BNF in the WC system was sufficient to support relatively high pasture production and N concentration in herbage DM during a large proportion of the grazing season. Most BNF takes place during the summer and autumn (Crush, 1987). In the present experiment milk production per cow on WC was the same as on FN but herbage production was proportionately 0.92 of FN, indicat-ing that a higher stockindicat-ing rate and milk output per hectare was possible from FN than WC. Schils et al. (2000a,b) in the Netherlands found that clover-based grassland receiving fertilizer N input of 17 kg/ha in spring produced 0.95 of the herbage of a perennial ryegrass sward receiving annual fertilizer N input of 208 kg/ha. Similar results were also found in New Zealand where clover-based swards receiving no fertilizer N produced herb-age yields of 0.89 of swards receiving input of 215 kg/ha (Ledgard et al., 2001).
This latter experiment was conducted at a site where lowest mean monthly soil tem-perature at 0.1 m depth was 7 to 8 °C in winter and peaked at approximately 20 °C in summer. In the present experiment the corresponding averages for the four years were 5.5 °C in winter and 16.6 °C in summer (Figure 1a). Average annual rainfall was approximately 1200 mm in the New Zealand study compared with 963 mm at Solohead. The annual range in soil temperatures in New Zealand was far more favourable for the growth of perennial ryegrass, white clover and BNF than in Ireland or Western Europe and this accounts for the higher herbage production per ha in New Zealand stud-ies compared with the studstud-ies in Western Europe (Table 4). Higher stocking den-sities in New Zealand (Bryant et al., 1982; Ledgard et al., 1998) are related to pasture production as well as the genetic capacity of the cows for milk pro-duction. High milk production in some studies in Western Europe can be attrib-uted to very high levels of concentrate supplementation per ha fed to cows with genetic capacity to give a milk production response to such diets (for example Schils
et al., 2000b).
Herbage production per hectare pro-vides a better comparison of the produc-tivity of the grassland system than milk production per hectare because herbage production reflects soil N supply either from fertilizer N or BNF whereas milk production can also depend on large dif-ferences in concentrates fed per hectare. It is typically the case that concentrates are allocated on a per cow basis and thus, input per hectare increases with increas-ing stockincreas-ing density. Davies and Hopkins (1996) reported that, under simulated grazing (frequent mechanical harvests and no returns of excreta) herbage production from clover-based grassland was similar to
that from perennial ryegrass receiving
fer-tilizer N input of 100 to 200 kg ha−1. Higher
values were associated with clover
concen-trations in swards of greater than 300 g kg−1
of herbage DM or on soils with a relatively poor supply of mineralized N. This range is in general agreement with the levels of relative productivity of the clover-based systems in Table 4. In the first experiment of Bryant et al. (1982) the application of 86 kg/ha of fertilizer N gave no increase in herbage or milk production per ha at the same concentrate input per ha. At a higher stocking density and fertilizer N input of 137 kg/ha in the second experiment, herb-age and milk production was increased mainly through a longer grazing season and longer lactation length. This empha-sizes the benefit of applying fertilizer N to clover-based swards in spring in terms of a longer grazing season and higher annual herbage production, although the clover concentration of swards decreased from 230 g/kg to 195 g/kg of herbage DM. In the experiment of Ledgard et al. (2001) input of 215 kg/ha of fertilizer N lowered the clover concentration of herbage DM from 152 g/kg to 107 g/kg, which makes it difficult to clearly assess the benefit of clover because it was contributing to both systems. In the experiment of Schils
et al. (2000b) the clover concentration of
the swards receiving fertilizer N input of 208 kg/ha was low, and on this basis, the clover-based swards were the equiva-lent of grass swards receiving fertilizer N input of approximately 180 kg/ha, under a mixed grazing and cutting system over a relatively short growing season. The clover-based swards in the experiment of Leach et al. (2000) showed high levels of productivity relative to grassland receiv-ing very high input of fertilizer N, both stocked continuously during the grazing season. However, the grazing season was very short and the system of milk
produc-tion was primarily based on harvesting herbage and feeding it indoors to autumn calving cows. Clover-based swards tend to be relatively more productive under cut-ting than grazing regimes because cutcut-ting tends to deplete soil N reserves, which increases BNF and the competitiveness of clover in the sward, whereas deposition of dung and urine and trampling by grazing livestock tend to reduce the clover content of swards (Frame and Newbould, 1986). Furthermore, increasing input of fertilizer N results in less efficient production of herbage DM per 1 kg of applied fertil-izer N, as is evident from the results of Humphreys et al. (2008; Table 4). Hence, the value of clover can be best evaluated from N-fertilized swards with similar lev-els of productivity to the clover-based swards. In the study of Humphreys et al. (2008) and the present study the annual fertilizer N replacement value of white clover, in terms of herbage production, was approximately 98 kg/ha and 125 kg/ha in these two studies, respectively.
Statutory instruments No. 101, 2009 and milk production
Under SI No. 101 (2009) stocking den-sities on Irish grassland is limited to 2 dairy cows per hectare and, under these circumstances, fertilizer N input should not exceed approximately 200 kg/ha. The results of the present experiment shows that this stocking density is well within the carrying capacity of clover-based swards receiving 90 kg/ha of fertilizer N applied in spring for early spring grazing and for production of silage. At this stocking den-sity, white clover can make a substantial contribution to lowering fertilizer N costs on farms. On more intensive grassland farms, there is the possibility of applying for a derogation from these limits. On derogation farms, which represent less than one third of all Irish dairy farms,
maximum permissible fertilizer N input to grassland is approximately 275 kg/ha. The results of the present experiment and data presented in Table 4 suggest that the level of herbage production that can be achieved with this level of fertilizer N input is substantially higher than that achievable with clover-based swards, even with input of 80 or 90 kg/ha of fertilizer N in spring.
The clover content of swards and animal health
Clover swards or grass-clover swards with very high clover concentrations are sometimes associated with animal health problems such as bloat and hydrogen cyanide poisoning, particularly in New Zealand (for example, Johnson and Thomson, 1996). In the present experi-ment there were no incidences of prob-lems with animal health that required treatment and no precautionary measures were taken to avoid bloat other than avoiding cows being very hungry when first allowed into swards with high clover concentration (>300 g/kg in herbage DM) in summer. Likewise, in the previous experiment (Humphreys et al., 2008) no cow on the clover-based system required treatment for clover-related disorders and no precautionary measures were neces-sary. This can be attributed to the rela-tively low clover concentration of herbage DM in both these experiments (Table 4).
The clover content of swards and over-seeding
The clover content of swards in the present experiment was marginally lower than the same clover swards used in the previous experiment (Table 4). Herbage production was generally higher in the present experi-ment except in 2006, for reasons outlined above. The average clover concentrations of herbage DM on the WC system were
239, 202, 225 and 206 g kg−1 DM in each
of the four years of this experiment. There was no evidence of a crash in the clover content of swards in this or the previous experiment, except during the period of summer drought in 2006. However, this was of short duration and was followed by recovery of clover concentrations in the autumn. During the present experi-ment, swards with declining clover con-centrations were identified, and around 0.2 of the area of the WC system was over-seeded with clover seed each year as described earlier. The establishment of these swards in the previous experiment and the maintenance of the clover content of swards in the present experiment were mainly due to over-seeding combined with low fertilizer N input. Over-seeding onto silage stubble in late May or early June on this heavy soil where soil moisture was rarely limiting (Figure 1c) contributed to maintaining the clover concentration of swards and consistent herbage production on the WC system during the four years of this study.
Conclusions
Well established white clover-based swards (WC) receiving annual fertilizer N input of 90 kg/ha applied for early grazing in spring and for first cut silage were able to support an annual stocking density of 2.15 cows per hectare, producing a milk output of 14 t/ha with an annual input of 531 kg concentrate DM per cow. Annual herbage production on WC was 0.92 (s.d. 0.029) of the FN treatment. There were no differ-ences between systems in the length of the grazing season or the in vitro OM digest-ibility of the grazed pasture. The concen-tration of CP in herbage DM was higher on the FN system, although this difference was relatively small and did not impact on milk production per cow. The clover
concentration in herbage DM of the WC system was greater than for the FN system but this had no effect on milk production, cow live weight and body condition score. Under the stocking rate limits imposed under SI No. 101 (2009) clover-based systems can support high levels of milk output with substantial savings in fertilizer N on non-derogation dairy farms.
Acknowledgements
Funding for this study was provided by the Irish National Development Plan and the Irish Dairy Levy. The authors acknowledge the technical input of A. Lawless and the farm staff at the Teagasc, Solohead Research Farm, and the staff at Moorepark Laboratories who conducted the analyses. Dr. E. Lewis and Dr. B. Horan, Teagasc, Moorepark DRPC provided critical comments on the manuscript.
References
Anon. 1951. Soil Survey Manual, USDA Handbook No. 18, Washington, DC, USA: USDA.
Bax, J.A. and Thomas, C. 1992. Developments in legume use for milk production. In: “Grass on the Move: A Positive Way Forward for the Grassland Farmer” (ed. A. Hopkins). British Grassland Society, Occasional Symposium No. 26, pages 43–53.
Bryant, A.M., MacDonald, K.A. and Clayton, D.G. 1982. Effects of nitrogen fertilizer on production of milk solids from grazed pasture. Proceedings of the New Zealand Grasslands Association 43: 58–63.
Central Statistics Office (CSO). 2008. “Principal Statistics in Relation to Agriculture”. CSO, Cork, Ireland. www.cso.ie.
Corrall, A.J. and Fenlon, J.S. 1978. A comparative method for describing the seasonal distribution of production from grasses. Journal of Agricultural Science, Cambridge 91: 61–67.
Crush, J.R. 1987. Nitrogen fixation. In: “White Clover” (eds. M.J. Baker and W.M. Williams). CAB International, Wallingford, UK, pages 185– 201.
Department of Agriculture Fisheries and Food (DAFF). 1996. “The Code of Good Agricultural Practice to Protect Waters from Pollution by Nitrates”. DAFF, Dublin, Ireland.
Davies, D.A. and Hopkins, A. 1996. Production benefits of legumes in grassland. In: “Legumes
in sustainable Farming Systems” (ed. D. Younie), British Grassland Society, Occasional Symposium No. 30, pages 172–176.
Deinum, B. and Dirven, J.G.P. 1974. A model for the description of the effects of different environmental factors on the nutritional value of herbages. Proceedings of the 12th International Grassland Congress Volume 1, Part 1: 338–346. Dillon, P., Crosse, S., O’Brien, B. and Mayes, R.W.
2002. The effect of forage type and level of con-centrate supplementation on the performance of spring-calving dairy cows in early lactation. Grass and Forage Science 57: 212–223.
European Fertilizer Manufacturers Association (EFMA). 2005. Forecast of food, farming and fertilizer use in the European Union 2005 to 2015. European Fertilizer Manufacturers Association. Avenue E. van Nieuwenhuyse, 4 - B-1160 Brussels, Belgium.
European Council. 1991. Directive 91/676/EEC con-cerning the protection of waters against pollu-tion caused by nitrates from agricultural sources. Official Journal of the European Union L375: 1–8. Fitzgerald, D.A. and Fitzgerald, D.L. 2004.
Meteorological measurements. In: “Climate, Weather and Irish Agriculture” (eds. T. Keane and J.F. Collins), Met Éireann, Dublin, Ireland, pages 9–26.
Frame, J. and Boyd, A.G. 1987. The effect of strategic use of fertiliser nitrogen in spring and/or autumn on the productivity of a perennial ryegrass/white clover sward. Grass and Forage Science 42: 429–438. Frame, J. and Newbould, P. 1986. Agronomy of white
clover. Advances in Agronomy 40: 1–88.
Harris, S.L., Auldist, M.J., Clark, D.A. and Jansen, E.B.L. 1998. Effects of white clover concentra-tion in the diet on herbage intake, milk produc-tion and milk composiproduc-tion of New Zealand dairy cows housed indoors. Journal of Dairy Research
65: 389–400.
Humphreys, J. 2008. Nutrient issues on Irish farms and solutions to lower losses. International Journal of Dairy Technology 61: 36–42.
Humphreys, J., O’Connell, K. and Casey, I.A. 2008. Nitrogen flows and balances in four grassland-based systems of dairy production on a clay-loam soil in a moist maritime climate. Grass and Forage Science 63: 467–480.
Jarrige, R. 1989. Ruminant Nutrition, Recommended Allowances and Feed Tables. John Libbey Eurotext, Montrougue, France.
Johnson, R.J. and Thomson, N.A. 1996. Effect of pasture species on milk yield and milk composi-tion. Proceedings of the New Zealand Grassland Association 57: 151–156.
Kennedy, E., O’Donovan, M., Murphy, J.P., Delaby, L. and O’Mara, F.P. 2005. Effects of grass pasture and concentrate based feeding systems for spring calving dairy cows in early spring on lactation per-formance. Grass and Forage Science 60: 310–318. Laidlaw, A.S. 1980. The effect of fertilizer nitrogen
applied in swards of ryegrass sown with four cul-tivars of white clover. Grass and Forage Science
35: 295–299.
Leach, K.A., Bax, J.A., Roberts, D.J. and Thomas, C. 2000. The establishment and performance of a dairy system based on perennial ryegrass: white clover swards compared with a system based on nitrogen fertilized grass. Biological Agriculture and Horticulture 17: 207–227.
Ledgard, S.F., Crush, J.R. and Penno, J.W. 1998. Environmental impacts of different nitrogen inputs on dairy farms and implications for the Resource Management Act of New Zealand. Environmental Pollution 102: 515–519.
Ledgard, S.F., Penno, J.W. and Sprosen, M.S. 1999. Nitrogen inputs and losses from clover/grass pas-tures grazed by dairy cows, as affected by nitro-gen fertilizer application. Journal of Agricultural Science, Cambridge 132: 215–225.
Ledgard, S.F., Sprosen, M.S., Penno, J.W. and Rajendram, G.S. 2001. Nitrogen fixation by white clover in pastures grazed by dairy cows: Temporal variation and effects of nitrogen fertilization. Plant and Soil 299: 177–187.
Lowman, B.G., Scott, N. and Somerville, S. 1976. “Condition Scoring of Cattle”, revised edition. Bulletin No. 6. East of Scotland College of Agriculture, Edinburgh, UK.
Morgan, D.J., Stakelum, G. and O’Dwyer, J. 1989. Modified neutral detergent cellulose digestibility procedure for use with the “Fibertec” system. Irish Journal of Agricultural Research 28: 91–92. National Research Council (NRC), USA. 2001.
Nutrient Requirements of Dairy Cattle, 7th Edition. National Academy Press, Washington DC, USA, page 266.
O’Mara, F. 1996. “A Net Energy System for Cattle and Sheep”. Department of Animal Science, Faculty of Agriculture, University College Dublin, Belfield, Dublin.
Peyraud, J.L., Delagarde, R. and Delaby, L. 2001. Relationships between milk production, grass dry matter intake and grass digestion. Proceedings of the Irish Grassland Dairy Conference 2001, Silver Springs Hotel, Cork, Ireland, pages 1–19.
Phillips, C.J.C. and James, N.L. 1998. The effects of including white clover in perennial ryegrass swards and the height of mixed swards on the milk production, sward selection and ingestive
behaviour of dairy cows. Animal Science 67: 195–202.
Ribeiro Filho, H.M.N., Delagarde, R. and Peyraud, J.L. 2005. Herbage intake and milk yield of dairy cows grazing perennial ryegrass swards or white clover/perennial ryegrass swards at low and medi-um-herbage allowances. Animal Feed Science and Technology 119: 13–27.
Ribeiro Filho, H.M.N., Delagarde, R. and Peyraud, J.L. 2003. Inclusion of white clover in strip-grazed perennial ryegrass swards: herbage intake and milk yield of dairy cows at different ages of sward regrowth. Animal Science 77: 499–510.
Ryan, M. 1986. Investigation of white clover for dairying. Irish Grassland and Animal Production Association Journal 20: 83–86.
Ryan, M. 1989. Development of a legume-based dairy system. In: “Legumes in Farming Systems” (eds. P. Plancquaert and R. Haggar). EEC, Brussels, 159–167.
Statutory Instruments (SI) No. 378, 2006. European Communities (Good Agricultural Practice for Protection of Waters) Regulations 2006, The Stationary Office, Dublin, 49 pages.
Statutory Instruments (SI) No. 101, 2009. European Communities (Good Agricultural Practice for Protection of Waters) Regulations 2009, The Stationary Office, Dublin, 51 pages.
Sayers, H.J. and Mayne, C.S. 2001. Effect of early turnout to grass in spring on dairy cow perform-ance. Grass and Forage Science 56: 259–267. Schils, R.L.M., Boxem, T.J., Sikkema, K. and André,
G. 2000a. The performance of a white clover based dairy system in comparison with a grass/ fertilizer-N system. II. Botanical composition and sward utilization. Netherlands Journal of Agricultural Science 48: 291–303.
Schils, R.L.M., Boxem, T.J., Jagtenberg, C.J. and Verboon, M.C. 2000b. The performance of a white clover based dairy system in compari-son with a grass/fertilizer-N system. II. Animal production, economics and environment. Netherlands Journal of Agricultural Science 48: 305–318.
Schulte, R.P.O., Diamond, J., Finkele, K., Holden, N.M. and Brereton, A.J. 2005. Predicting the soil moisture conditions of Irish grasslands. Irish Journal of Agricultural and Food Research 44: 95–110.
Thomson, D.J., Beever, D.E., Haines, M.J., Cammell, S.B., Evans, R.T., Dhanoa, M.S. and Austin, A.R. 1985. Yield and composition from Friesian cows grazing either perennial ryegrass or white clover in early lactation. Journal of Dairy Science 52: 17–31.
Tyrell, H.F. and Reid, J.T. 1965. Prediction of the energy value of cows’ milk. Journal of Dairy Science 48: 1215–1233.
Weissbach, F. and Ernst, P. 1994. Nutrient budgets and farm management to reduce nutrient emissions. In: “Grassland and Society” (eds. L.‘t Mannetje and J. Frame), Proceedings of the 15th General
Meeting of the European Grassland Federation, Wageningen, The Netherlands, pages 343–360.
Wilkins, R.J., Gibb, M.J., Huckel, C.A. and Clements, A.J. 1994. Effects of supplementation on produc-tion by spring-calving dairy cows grazing swards of differing clover concentration. Grass and Forage Science 49: 465–475.
Wilman, D. and Riley, J.A. 1993. Potential nutri-tive value of a wide range of grassland species. Journal of Agricultural Science, Cambridge 120: 43–49.