6154 North Meeker Pl., Ste 100 Boise, ID 83713
800-338-6692 / 208-377-0336
An H&W Computer Systems, Inc. white paper
Developing your strategy to manage Web
application performance
Forward by David McGoveran
The importance of Web applications in today's businesses can hardly be overestimated. Software in practically every category of software, from ERP to BPM to BI, can now be deployed as a Web application. Even system management and monitoring has joined the trend. It is, perhaps, better to understand this trend as the triumph of distributed, service-oriented component architectures over tightly coupled function-oriented application architectures. This success depends heavily on standard protocols such as HTTP for intercomponent or interprocess communication, HTML (and derivatives) for presentation, XML (and predecessors) or JDBC for data exchange, and Web Services for business services. Add to these protocols the ability to all but ignore the details of component life cycle (from startup to shutdown) functions, resource (e.g., cache) management, database access, and transaction management by using a Web application server, and
developers can concentrate on designing, developing, and publishing discrete services that consume other, existing services.
Distributed, service-oriented, component architectures, of which Web
applications are the most common realization, have obvious development and maintenance benefits. The combination of Java or C# development suites and enterprise-class application servers make it relatively easy to develop Web applications that will provide a desired service. Most of the time, these applications will handle large numbers of concurrent users and perform well due to the architecture's and the Web application server's inherent scalability. However, enterprise Web applications often depend on many resources that are not (and probably should not be) managed by the Web application server. These include network and database resources, and sometimes even valuable heritage assets with older, monolithic architectures. The result can be an unexpected loss of performance and availability that additional hardware will not correct.
Discovering the cause and remedy of a poorly performing Web application is a non-trivial problem. Even a system characterized by a mere seven
independent variables can produce unpredictable behavior; Consider the complexity of one that involves thousands of interacting components distributed over numerous platforms. To make matters worse, the problem generally involves difficulties that few developers and system managers are trained to address. The very development suite facilities that enable high productivity also leave many developers ill-prepared to tackle the complex, system-wide problems that are involved: That not suffered by experience, is rarely learned.
This paper introduces three critical factors that must be considered when developing a strategy for Web application performance management. Without well-planned strategy and third-generation performance management tools like DiagnoSys to implement it, continued performance and scalability of such complex systems is a highly optimistic expectation, depending heavily on good fortune and the ability to pay the high cost of error. Having designed or optimized the performance of hundreds of distributed systems and databases in the course of my career, and having performed just as many postmortem audits, I wouldn't recommend that "strategy" to anyone.
David McGoveran
Alternative Technologies Felton, California
David McGoveran is
president of Alternative Technologies (www.alternativetech.com), an independent consultant, industry analyst, inventor, teacher, and author recognized around the world. Best known for contributions to relational database technology, distributed applications, and BPM, he has more than 25 years of consulting experience, has been CTO Pro-Tem of three high technology start-ups, and serves as Sr. Technical Editor of the Business Integration Journal (www.bijonline.com).
4 Developing your strategy to manage Web application performance
Developing your strategy to manage
Web application performance
Applications that fail to meet performance expectations damage an organization's reputation and stifle growth. According to Meta Group's Corey Ferengul, "To ensure successful use of the Web to drive business, companies must ensure that the technology performs well or they risk losing customers."
The numbers are staggering. Software defects, including performance slowdowns and application blackouts, cost the U.S. economy billions of dollars. According a report by the National Institute of Standards and Technology, annual costs range from $22.2 to $59.5 billion. Considering the explosion of Web application development and deployment over the past few years, it’s safe to assume that Web application defects increasingly make up a greater and greater portion of this cost to individual organizations and the U.S. economy.
So how does an organization respond to such a growing and costly problem? As with all technology-driven business issues, organizations must formulate a strategy. And while each strategy must be tailored to the unique structure of an IT organization, all must include these three critical factors:
• Managing performance at all stages of the application lifecycle • Developing a “true” holistic view of the Web application environment • Using intelligent performance analysis
Managing performance at all stages of the
application lifecycle
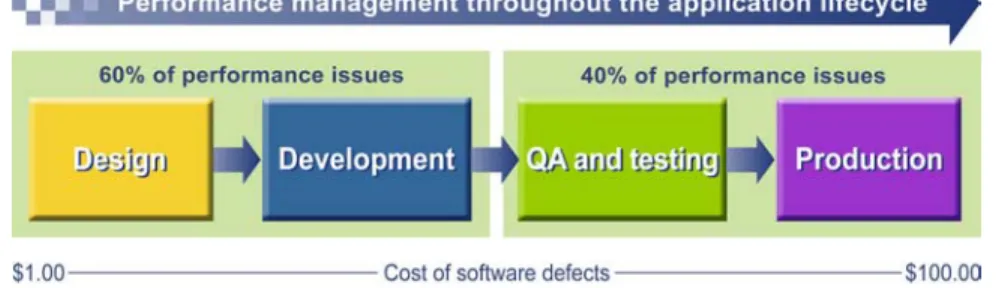
Tim Vanderham, team leader for IBM's WebSphere Performance Tools and Methodology Workshop, suggests than 60 percent of enterprise system performance problems are related to application design. For Web application projects to be successful, such issues must be addressed early in the application lifecycle. One reason is cost. In his book Software Engineering Economics, Barry Boehm estimates that finding and resolving issues in design costs $1 for every $100 it costs to fix those issues in production. The remaining 40 percent of performance issues, which are unrelated to design, include issues with the network infrastructure and the interactions between disparate backend platforms and operating systems that Web applications rely on. This variety of issues demonstrates the need to manage performance throughout the application lifecycle.
Figure 1. Managing performance throughout the application lifecycle
Managing performance throughout the lifecycle requires that personnel at each stage contribute. Typically development teams receive a design plan that includes performance requirements that they can use as a guideline during development. After development, testing personnel evaluate the application to determine if it meets those requirements. If it does, production personnel accept responsibility for the application and maintain its performance according to established service level
agreements (SLAs).
These basic steps are common in most application lifecycles. However, because of the inherent complexity of Web applications, many IT organizations do not sufficiently address performance management
"Performance testing should be seen as a living and continuously evolving aspect of your software development lifecycle—not only just in development and formal testing phases but also in live production."
Adam Neat, Accenture LLC
From his article "Defining and Building High-Performance Software"
6 Managing performance at all stages of the application lifecycle
throughout the application lifecycle. Specifically, development, QA and testing, and production teams must review the following processes in each stage:
• Performance benchmarking in the development stage • Performance validation in the QA and test stage • Performance analysis in the production stage
Performance benchmarking in the development stage
To ensure performance meets expectations, developers must establish benchmarks for performance, incorporate application-specific performance enhancements, and identify key measures prior to test and production. Taking these steps during the development phase saves QA and production teams countless hours chasing down performance issues and saves development groups from fixing performance problems later in the application lifecycle. Some key questions application development managers must ask themselves include:
• Are my architects focused on designing Web applications for performance? • Are my developers focused on coding Web applications for performance?
• Are my developers using the appropriate tools to discover performance problems in the earliest stages of application design?
• Do my developers understand their role in achieving performance goals?
• How much time do my developers spend fixing performance issues found in production? • Can my developers communicate performance issues effectively with other groups? • Are the lessons we learn documented and applied to future project plans?
Performance validation in the QA and test stage
Before an application goes to production, QA runs tests to ensure it meets established performance requirements. In most cases the test environment is a controlled environment where performance can be more efficiently evaluated than in development. If performance tests fail at the QA and test stage, QA should analyze the test environment to ensure that the application, and not a poorly performing resource such as a database, is causing the
bottleneck. If analysis identifies the application as the cause, QA should return the application to development for refinement. Moving such suspect applications forward only means setting your organization up for future headaches. Throughout this stage, QA and test managers should be asking themselves questions such as:
• Is my staff using realistic test loads when testing performance? • Does my staff understand its role in achieving performance goals?
• Can my staff communicate performance issues effectively with other groups? • Is my staff using the right tools to identify the source of the performance issue?
• Is the performance issue related to the application or to a poorly performing resource the application depends on?
Performance analysis in the production stage
Once an application reaches production, personnel need a performance analysis process that alerts them to potential problems. This process should be automated and should include a set of predefined resolution plans because in many cases, production personnel need to identify problems and resolve them immediately without assistance. With a properly executed performance analysis process in production, personnel can quickly identify and resolve issues before they impact users. Production managers should be asking questions such as:
• Do my production personnel understand their roles in achieving performance goals?
• Are my production personnel able to resolve performance issues quickly? • How often are my production personnel contacting application developers
to fix a performance issue?
• What escalation procedures exist when problems arise?
• Do my production personnel have documented resolution plans? • Who is responsible for triaging performance problems?
• Is my staff able to communicate performance issues effectively with development and QA groups?
8 Developing a “true” holistic view of the Web application environment
Developing a “true” holistic view of the Web
application environment
The second critical factor required for a performance management strategy is developing a “true” holistic view of the Web application environment.
Many internal and external factors affect Web application performance. These factors include network infrastructure, application design, and how well Web applications interact with disparate resources (HTTP servers, application servers, and databases) and their components (operation systems, CPUs, etc.). Issues with one or any combination of these factors can hamper application performance. Many organizations fail to quickly identify and resolve performance issues because IT personnel focus on only the performance of the application server and its connectors, ignoring the many external factors that can affect performance.
A critical factor in any performance strategy is being able to view and measure the interaction between the application and all the resources and components it touches. This "holistic" view allows IT personnel to see everything that may affect performance and to discover the causes of performance problems that are unrelated to infrastructure (hardware) and application design issues.
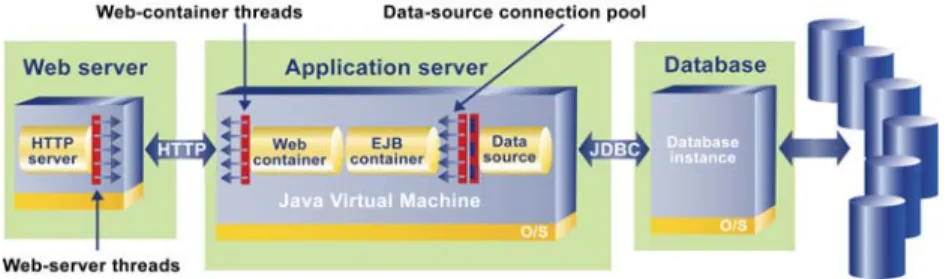
To further demonstrate the need for this view, consider a typical transaction: When a user executes a task from a browser, a request goes from the browser to the HTTP server and then on to the application server.
Figure 2. A typical transaction
The application server calls additional resources including databases and backend systems before returning a response to the end user's browser. Depending on the application and the request, transactions happen from thousands to millions of times a day. By analyzing these transactions from end-to-end, IT personnelcan identify specific areas where the transactions perform poorly during interactions with related application resources.
Only through a holistic view of the Web application environment can development, QA and test, and production personnel have the visibility they need to quickly identify the “true” root causes of performance slowdowns.
Using intelligent performance analysis
The final critical factor for a performance strategy is the use of intelligent performance analysis. Intelligent performance analysis gives IT personnel throughout the application lifecycle the ability to automatically identify, analyze, and resolve performance problems quickly, often before the problems impact users. Without this level of analysis, teams of experts (known as triage teams) must dig through layers of data to resolveperformance problems. This manual approach adds cost throughout the IT organization in terms of time to resolution, impact to users, and missed opportunities. To attain intelligent performance analysis requires new solutions that have begun to emerge in recent years.
The evolution of performance management tools
Many IT organizations have embraced first generation performance tools (also known as "framework tools"). These tools monitor the health and status of the hardware components such as servers, routers, and hubs. Some tools also have limited operating system (OS) and application monitoring capabilities. The most popular of these tools include IBM® Tivoli®, BMC® Patrol®, HP OpenView, and CA Unicenter®. These tools
perform well within the confines of their original design. However, as business information and IT environments evolved to externally focused, Web-based platforms, a need to address the new complexities inherent within Web application infrastructures and server deployment platforms arose. Second generation tools evolved to specifically monitor Web application servers and their components, such as the JVM, Java classes, EJBs, etc. Most second generation tools are console-based and use graphic metaphors such as dashboards with red, yellow, and green lights to reflect the relative health of the monitored application components. While these tools do a nice job monitoring Web applications, many focus only on the application server and its connectors, ignoring the entire environment the Web application relies on. In addition, second generation tools require administrators and
developers to perform in-depth analysis on the data these tools collect. This lack of a holistic view and automated analysis features has fueled the evolution of a new generation of tools.
This new generation of performance management tools, sometimes referred to as "third generation" or "intelligent analysis" tools, evolved to provide developers and administrators with the holistic-view and analysis features needed to proactively identify and quickly respond to performance issues and
"The next generation of performance monitors is emerging and provides additional insight through advanced methods such as statistical analysis, long-term pattern recognition, and multivariant composite processing. This added insight enables better understanding of performance issues, which can be used for problem identification and performance optimization."
10 Using intelligent performance analysis
their causes. These third generation tools analyze the relationships between application components and all the various IT components within the infrastructure that can affect
performance. This contrastswith second generation tools, which do not provide a holistic view and require domain experts to manually analyze and correlate what limited performance data they do collect.
This new generation of tools provides application developers, QA and test administrators, and production personnel with an understanding of the true causes of performance problems, provides problem detection signs that guide application design, helps quickly troubleshoot production issues, and ultimately improves overall application and system-wide performance. Some of the key features built into third generation tools include the following:
Holistic application view—Holistic application view aids in understanding the relationship between the various application components and all of the infrastructure components that the application interacts with. Holistic view provides application development, QA and test, and production personnel a complete view of the application, allowing them to pinpoint the actual performance problem quickly regardless of where it exists.
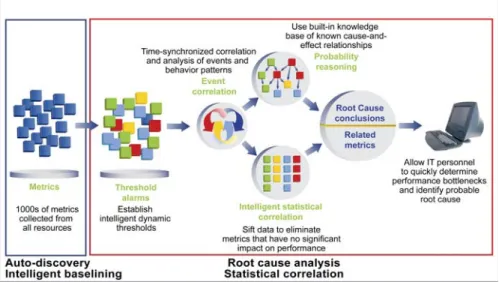
Auto-discovery—Auto-discovery automatically identifies the key indicators and metrics from all components that an application touches when completing tasks. For example,
auto-discovery provides detailed performance information about the Web server, operating system, application servers, backend mainframe resources, mainframe OS, database servers, the database server OS, and much more. This eliminates the time and cost associated with domain experts manually identifying the right data to measure from each resource.
Figure 3. Key features of third generation solutions
Intelligent baselining—Intelligent baselining uses algorithms to automatically discover the parameters for evaluating the performance of system resources. By monitoring the application for a period of time, these tools learn system behavior and set thresholds for acceptable
behavior. This dramatically reduces the time and domain knowledge needed to start analyzing Web application performance quickly.
Statistical correlation—Using statistical correlation, third generation tools analyze the relationship between performance indicators across the entire application environment to determine which indicators are performing
statistically “abnormally” at any given time. With this information, IT personnel can filter out information unrelated to performance problems. Statistical correlation is also useful for doing "what if" analysis by showing how an application design change can impact the application's performance across a variety of tasks or circumstances. This feature is particularly valuable for those who want to understand how a design change might affect
performance.
Root cause analysis—Root cause analysis considers metric relationships and indicates likely sources of performance problems using sophisticated algorithms. This feature then provides expert advice on how to resolve problems and can activate resolution scripts to resolve problems
automatically. This allows personnel who are responsible for managing the Web application to quickly identify the root cause of a problem even when they are unfamiliar with the behavior of the application’s internals and resources.
12 Introducing DiagnoSys—a third generation solution
Introducing DiagnoSys—a third generation solution
H&W’s DiagnoSys™ is a third generation performance management solution. The systematic use of DiagnoSys across the application lifecycle provides the intelligent analysis needed to proactively identify and correct the most complex performance problems found in today's sophisticated Web application environments.DiagnoSys provides comprehensive intelligent performance analysis
As a third generation solution, DiagnoSys includes the following key features:
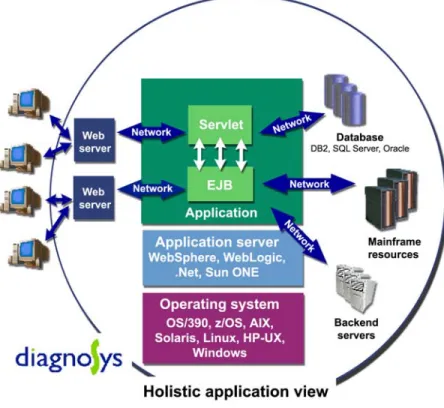
Holistic application view—DiagnoSys collects and analyzes data from across the entire Web application environment. This holistic application view is critical to identifying and resolving issues that are associated with resources external to the application.
Figure 4. Holistic application view
Auto-discovery—With thousands of metrics to be considered, it is virtually impossible to know what performance data can and should be captured unless you’re an expert in all Web application resources (Web servers, application servers, databases, networks, etc.).
DiagnoSys automatically identifies indicator metrics for each resource and component in the Web application environment, sets default dynamic thresholds, and continues to refine those thresholds automatically based on activity patterns.
Intelligent baselining—DiagnoSys analyzes the application environment to understand its behavior and then uses this information to automatically set dynamic thresholds for indicator metrics. DiagnoSys continues to adjust these dynamic thresholds automatically based on
metric behavior. IT personnel can refine thresholds to increase or decrease sensitivity of analysis of any given metric. When metrics exceed established limits, DiagnoSys begins a two-pronged attack to find the problem using root cause analysis and statistical correlation.
Root cause analysis—DiagnoSys automatically analyzes metric relationships in real time to identify sources of potential problems. As DiagnoSys identifies problems, it provides expert advice and can run resolution scripts to automatically resolve identified issues. Ultimately, root cause analysis shortens the time from problem identification to resolution by eliminating the delays that lengthy investigations and drill-down
methodologies cause.
Statistical correlation—DiagnoSys provides automatic statistical correlation. Independent of root cause analysis, statistical correlation is an automated process that analyzes resources that have exceeded their thresholds. DiagnoSys filters out unrelated metrics and correlates the related resource metrics to intelligently focus in on the problem. Statistical correlation goes beyond the more common approach of visual correlation, reducing the risk that critical metrics contributing to a problem will be overlooked.
Summary
As the use of Web applications to support customers, partners, and employees continues to grow, organizations can no longer ignore the economic impacts associated with poor application performance. Poor performance drives customers away, hinders business transactions, and damages employee and business productivity. Accordingly, Web application performance management must maintain high visibility within all levels of the IT organization.
As today's increasingly sophisticated Web environments place new demands on IT personnel, uncovering the issues that impact performance becomes more difficult. To combat this, application developers, QA and test personnel, and production personnel need a cohesive performance strategy and to use the right tools. The newest of these tools, known as third generation solutions, helps resolve performance issues in less time, with fewer people, by providing intelligent performance analysis features.
H&W offers a third generation solution in DiagnoSys. For more information, contact an H&W Account Executive at (800) 338-6692 or e-mail us at
Find additional information about DiagnoSys by visiting H&W's Web site at:
http://www.hwcs.com/products/diagnosys/index.asp.
You can also sign up for H&W's monthly e-newsletter, WebApp News, at:
http://www.hwcs.com/newsletter/index.asp. WebApp News covers current
Developing your strategy to manage Web application performance 14
Ferengul, Corey, META Group, “Web Application Management Tools: Service Management Strategies, Operations Strategies,” April 2003
Glen O'Donnell, META Group, “Performance Monitoring Versus Performance Analysis: Operations Strategies, Service Management Strategies;” June 2003
National Institute of Standards and Technology, Planning Report 02-3: The Economic Impacts of Inadequate Infrastructure for Software Testing, 2002,
http://www.nist.gov/director/prog-ofc/report02-3.pdf
Neat, Adam "Defining and Building High-Performance Software," Software Test & Performance, no.1 (2004): 12-18