ISSN 0973-2675 Volume 11, Number 1 (2016), pp. 19-26 © Research India Publications
http://www.ripublication.com
Statistical Analytic Tool for Dimensionalities in Big
Data: The role of Hierarchical Cluster Analysis
Justine Nkundwe Mbukwa1, G. Neeha Tabita2, G. V. S. R. Anjaneyulu3 and O.V. Rajasekharam4
Department of Statistics, Acharya Nagarjuna University, Nagarjuna Nagar Guntur 522010, Andra Pradesh
Abstract
An interest for presenting this paper rose because of massive increase information with a very high dimensional from different sources in this era of globalization. Data are produced continuously and are unstructured (1). This paper is confined to literature review search for big data issue and challenges of several scopes in data. It brings a detailed discussion on the problem on these data and analysis done using the effective multivariate statistical tool namely clustering analysis technique as a data reduction technique. It is used as a base for discussion for existing challenge of multi-dimensionalities of data. The findings indicated that, the world is noisy due to massive flow of information continuously. Findings revealed that data emanating from face book, you tube and twitter can be used to predict the epidemic of influenza and even market trend (2 and 3). With face book data is used to predict the people`s interest. However, data from different sources have been proved to be useful in decision making efficiently and effectively for public as well as private sector. Cluster analysis technique sorts data/alike things into groups, to see if there a high natural degree association among members of the same group and low between members of different groups. Finally, this technique has proved failure to handle such heap of data with varied sources. With regards to data stored, it remains to be a challenge in terms of analysis among researchers and scientists. Therefore, it calls for advanced statistical software to cater for such an existing challenges.
Keywords: Big data, Dimensionalities, Clustering analytics
1. 0 Introduction
are on various format either in structure or unstructured form. With such type of data are stored in databases. Thus, it becomes too tedious to dig out, alter and load (4). Now days the term Big Data is used nearly anywhere. The term coined by Roger Magoulas from O’Reilly media in 2005. It refers to a wide range of large data sets which almost impossible to handle and process using traditional data management tools because of size and their complexity. Big Data can be seen in various field of study, these include finance and business where huge amount of stock exchange are done, banking, online purchasing data flows through computerized systems. Data are captured and stored for inventory monitoring as well as behavior for customer and market. It can also be seen in the life sciences where big sets of data are stored every day. Also clinical data and patient data are continuously tracked.
Currently, a business world is facing a challenge in handling volume of information. Data are increasing in terms of volume and complexity. These data are tracked from both online and offline sources whose form is structured, semi-structured and unstructured as well. These enormous data are very high in terms of scope such that its analysis remains to be extremely tedious among researchers and scientists. Data are produced continuously and unstructured (1). Ultimately, it calls for new technique for handling and analyzing big data in real time. Before an invention in technology, organizations faced no such a challenge because data were structured. Statistical analysis was performed by using traditional data mining techniques.
How can we analyse these enormous data? This is question of interest. This calls for scientific and effective statistical analytical tool for finding insights on relationship between these unstructured features, looking for homogeneity among groups of data because diverse scope. The data are being aggregated from multiple sources at a time from different technologies. This ultimately creates heavy costs in terms computational. The issue of heterogeneity, statistical biasness and trials variability are still inevitable since data are collected data from various sources.
1.1 Objective of the study
This paper aimed at answering the following major purposes:
i. To assess the usefulness of big data (massive data) despite of its complexity in terms of analysis
ii. To assess the problem of big data and usefulness cluster analysis as analytic tool
1. 2 The scope of the study
Basically, this paper is confined to literature review search for big data issue from different scholarly work and how cluster analytic tool has been addressed effectively to the problem of multidimensional in data.
1. 3 Literature review on big data
Big data refers to a datasets which are very complex in nature. It is large in size as well as too tiresome in terms of storage, management and analysis. It is perceived in terms of largest (terabytes to exabytes that is 1 terabyte =1. 0 × 10-6 exabytes). Data are complex (ranging from sensor to social media) (5). Therefore, it requires an
21
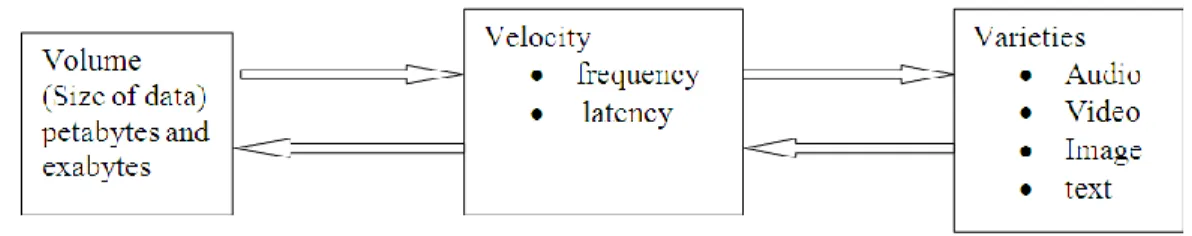
advanced technology to be handled such immense information. It is argued that data are said to be big if possesses three important things, namely volume, varieties and velocity. They are produced in large quantities, more quickly with maximum speed, consists of varieties in format of either structured or unstructured. Volume does not just mean terabytes or petabytes, it also refers to number of files, records and transaction. The figure 01, indicates three (Vs) that constitute a big data (6).
Figure 01: Three (3Vs) of Big Data
It should be understood that, a world is full of all popular social sites relying on Big Data only and its productivity undergone with the help of business advisory services. Each business advisory service keeps on fighting to provide a valuable solution to the association and organizing their data precisely. This is done by the help of human as well as technologies (scientific software tools). It is very crucial to manage this data to be able to make proper decisions. Management of this massive information requires people, process and technologies to ensure a realized accuracy and value from such complex data. Big Data analytics refers to the way that massive information can bring meaningfully results. Normally data are of varying shapes and sizes. Analytics provide some set of measures and tools that constantly defines and helps in organizing of facts to the standard manner (7).
It is also described as the data sets that are so large and complex in terms of storage, management and analytic. These unstructured data are somehow different from what we call data mining. Since the field of big data analytics is quite new there is no enough scientific literature available yet to bring about a realist solution. Many organizations are using big data sources and integrate new approaches of data analysis in order achieve deeper understanding of their customers and optimization of customers commitment. However, the challenge remains the same since the information use to flow continuously (8).
1. 4 Big data value chain
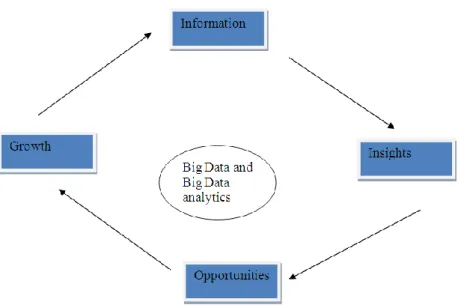
Essentially, financial institutions collect plentiful data. However, they fail to use the meaningful on time which lead the business to look insights. Since they fail also to generate big data analytics and process data on real time they did not find easy to predict and responding to any changes the business need for opportunities. Ultimately business profits and opportunities and related growth were tied and slow down. This value chain is a foundation of big data (figure 02).
Figure 02: Big data value chain
1. 5 Methodology used
Systematic search of literature review has been done from the different perspectives among scholarly work. Since the massive information is characterized by the problem of unsupervised learning, we have to embark on trying to find a hidden structure to the unlabelled data. The unsupervised learning problem also encompasses many other techniques that seek to summarize and explain key features of the data. Regarding to an increase in massive data with different view it calls for application clustering analysis. This paper strictly provides discussion on how cluster analysis found to be suitable for as a big data analytic in business arena. Thus, cluster analysis refers to the process of separating objects based on similarities or differences. Thus objects within a cluster are homogenous. Clustering algorithms are categorized into two parts, namely hierarchical (single linkage, complete linkage and average linkage) and partitioning/non-hierarchical clustering (K-means).
In context of cluster analysis, distance between two vectors of p-dimensional used to sort out objects is referred to Euclidean distance. This is applicable to hierarchical clustering particularly numeric data whose final results are shown by nested tree (9). That is x (x , x ..., x )1 2 p T and y (y , y ,..., y )1 2 p T …(1. 5. 1)
The statistical distance (euclidean) between two observations vectors x and y is given by: 2 2 2 1 1 2 2 (x, y) (x y ) (x y ) ... (xp y )p d …(1. 5. 2) 2 (x, y) (xi y )j d = (x y ) (x y)T … (1. 5. 3)
Since, statistical distance between to vectors can be adjusted using variance-covariance matrix, thus equation (1. 4. 3) can be rewritten as:
23
1
(x, y) (x y )T (x y)
d S … (1. 5. 4)
Whereby, S stands for the sample variance- covariance matrix. However for large data sets, the Euclidean distance is computed using computers.
However for text/document a cosine is more commonly used to identify frequencies of words/terms in the document. Cosine measure refers to the algorithm which is used to cluster text rather than geometric figures. It is found to be more effective measure of similarities in analyzing and grouping text documents. This requires the use of directional data that deals with the direction of unit vectors (22). This takes into account the inner product between two document vectors emanating from the same source seen in figure 03.
Figure 03: Angle between two vectors
Therefore, the cosine is “1” if the angle between two vector document is zero degree ( 0
) and the magnitude is zero “0” otherwise. That is: . cos ( , ) . a b ine a b a b …(1. 4. 5)
Whereby a and b are m- dimensional document vectors originated from the same source.
Under classical methods of sorting items standard measure distance very significant. Clustering is very popular and found useful in field of statistics, mining and pattern recognition (image analysis). It can be either top down (divisive hierarchical measure where by clusters are formed by splitting of large clusters. Also it said to bottom up whereby clusters are built is such a way that merging from minor parts. However, clustering is very expensive items of computational as complexity (Big Data) increases(20). Again it should be known that the classical clustering methods also face with the following statistical challenges such as producing different results among different algorithms, size of the data set influence the statistical results, results depend on the nature of data sets. There is no consensus to which algorithm is sounding better than the other?
1. 5 Analysis and Discussion
Despite the fact that there are existing of some challenges emanating from Big Data, yet groups such as face book, you tube and twitter are still beneficial. However despite they reveal number of individuals traits at time. By using these data, it is possible to predict influenza epidemic (2). Also a supply trend and box office revenues for movies can easily be predicted (3).
Moreover, the organizations such as public or private make use of Big Data in decision making. As far as information technology is in terms of effectiveness and efficiency in production, also Big Data expect to have similar impacts in many sectors (10; 11; 12; 13).
Despite those benefits revealed from Big Data, still business firms are struggling to be more competitive by ever-increasing an electronic promotion. New technique skills are required to manage and analyse data that coming continuously from several sources. The only way to analyse such massive online customer’s views is through segmentation approach. This calls for the role of “Big Data” (1).
Segment analysis as a technique for big data analytic is very crucial. It makes easier to extract the sentiment-text classification in order to determine the strength of the consumer opinion. Hence, in this case to perform the analysis of large amount of unstructured textual data is possible (15).
Again it has been articulated that in order to understand customers and optimization is through segmentation (14). The term refers to the process of separating the customer into dissimilar groups such that internally remain to be homogeneous in order to develop differentiated marketing strategies according to their uniqueness (16). This is comparable to formulating clusters in such a way that analysis of behavior or attributes becomes easily handled. Since Big Data is characterized by high dimensionality, then an effective statistical tool to address such an existing challenge is very substantial. Observations and critical insights are made on correlation among features for scientific decisions to predict the future (17).
The question of data sets scope reduction plays a significance role in addressing the challenge of continuous incoming data. Reducing these volumes of data to a manageable size before undertaking analysis has been proved to bring the statistical accuracy. Therefore Big Data needs cluster analytic tool for better and easier analysis of such massive information since they are coming from multiples of sources, unstructured structured and sometimes semi- structured (18). Among of a range of analytical techniques that have been developed to deal with the Big Data clustering technique is also inclusive (19).
1.4 Conclusions and Recommendations
Big Data encompasses structured, semi-structured and unstructured information from demographic and psychographic information about consumers to product reviews and commentary; blogs, content on social media sites, data streamed from mobile devices sensors and even technical devices. Nowadays it is great challenge to process the volumes of data timely among economic services institutions. This has brought a continuous discussion of Big Data as a new area of research recently. One of the common challenges encompassing big data is high scope of data which creates some
25
sort of noise and untrue correlation in data. The dimensionalities bring a heavy computational challenge and heterogeneity. Due to veracity (lack of accuracy and reliability of data) can lead to (statistical bias, variations in statistical experiments, statistical analytics instability) since no accuracy in handling massive data.
Out of big volume or huge data it is very crucial to find out a realistic analytics to be used to mine the information from shapeless kind of data such that can bring value to the existing problem. Resource persons who are practicing statistics as an engine of development need to find out solution for such problem.
The traditional analytics methods are facing number of challenges as far as fast incoming data are concerned: firstly, former analytics are often were designed to analyse relatively small sample sizes whereas presently the sample size is infinitely large. Secondly, data storage across multiple drives is hectic since they are emanating from different sources. Thirdly, cost of analysis of large datasets using traditional techniques is too huge in terms time and memory.
In view of traditional statistical methods facing, here are suggested recommended solutions: which data to save? Which one to discard? With rapids growth and updates of data it requires dynamic tools to analyse efficiently real time information. Also it requires more advanced tools able to identify useful data and discards all less important information. This is proposed solution for Big Data related to velocity. Regarding with the challenge of variety, it is recommended that an insight analysis to the diverse range of structured and unstructured is highly required. With the growing technology in this era data never stop flowing from several sources.
There will be more data since fast and modern tools are being invented daily. More data is going to be produced than even there today. Now, with this continuous flow of information it has been documented in the literature that classical cluster analysis methods found not useful to bring efficient and effective management operation due infinitely large sample size. Thus, Hadoop Distributed File System (HDFS) is one of the suggested software designed to hand huge data. It consists of commands to delete files, change directory as well as file listing. It is possible to achieve reliability as files are stored in dissimilar machines (21).
References:
1. Stein, L. (2010). “The case for cloud computing in genome informatics”. Genome Biology, 11(5):207.
2. Aramaki, E., Maskawa, S., and Morita, M. (2011). “Twitter catches the flu: Detecting influenza epidemics using twitter”. In Proceedings of the Conference on Empirical Methods in Natural Language Processing, pages 1568–1576.
3. Bollen, J., Mao, H., and Zeng, X. (2011). “Twitter mood predicts the stock market”. Journal of Computational Science, 2(1):1–8.
4. Sagiroglu, S. ; Sinanc, D., (20-24 May 2013), ”Big Data: A Review” Siemens, G., & Long, P. (2011). Penetrating the Fog: Analytics in Learning and Education.
EDUCAUSE Review, 46(5), 30–32
5. Chen, H., Chiang, R. H. L., & Storey, V. C. (2012). Business Intelligence and Analytics: From Big Data to Big Impact. MIS Quarterly, 36(4), 1165–1188.
6. Russom, P. (2011). TDWI Best Practices Report: Big Data Analytics (Best Practices) (pp. 1–35). The Data Warehouse Institute (TDWI). Retrieved from on 15, October, 2014 http://tdwi. org/research/2011/09/best-practices-report-q4-big-data-analytics. aspx?tc=page0
7. Vidhya, C. (2014). “An analysis of Big Data usage in Big Organization”.
International Journal of Innovative Science, Engineering & Technology, Vol. 1 Issue 7
8. Chen, H., Chiang, R. H. L., & Storey, V. C. (2012). “Business Intelligence and Analytics: From Big Data to Big Impacts”. MIS Quarterly, 36(4), 1165–1188
9. Johnson, R. A & Wichern, D. W. (2007). AppliedMultivariate Statistical Analysis
(6th edition). USA: Pearson Education, Inc., Publishing as Pearson prentice Hall. 10. Jorgenson, D. W. (2002). Econometrics, Vol. 3: Economic Growth in the
Information Age (1st ed. ). The MIT Press.
11. Melville, N., Kraemer, K., & Gurbaxani, V. (2004). Review: Information Technology and Organizational Performance: An Integrative Model of IT Business Value. MIS Quarterly, 28(2), 283–322.
12. Castells, M. (2009). The Rise of the Network Society: The Information Age: Economy,Society, and Culture Volume I (2nd ed. ). Wiley-Blackwell.
13. Peres, W., & Hilbert, M. (2010). Information Societies in Latin America and the Caribbean Development of Technologies and Technologies for Development. Santiago: United Nations ECLAC. Retrieved on 14, October, 2014 from http://www. cepal. org/publicaciones/xml/3/43803/Libro_Cepal_98. pdf
14. Fotaki, G., Gkerpini, N., Triantou, A, I., Brinkkemper, S. (2012). Online CustomerEngagement Management. Utrecht University.
15. Pang, B., & Lee, L. (2008). Opinion Mining and Sentiment Analysis.
Foundations andTrends in Information Retrieval, 2(1–2), 1–135.
16. Tsiptsis, K., & Chorianopoulos, A. (2009). Data Mining Techniques in CRM: InsideCustomer Segmentation. Wiley.
17. Bickel, P. (2008). Discussion on the paper “Sure independence screening for Ultra high dimensional feature space” by Fan and Lv. Journal of the Royal Statistical Society: Series B (Statistical Methodology), 70(5):883–884.
18. Fan, J. and Fan, Y. (2008). “High dimensional classification using features annealed independence rules. ” The Annals of Statistics, 36(6):2605–2637.
19. Adomavicius, G., and Tuzhilin, A. (2005). “Toward the Next Generation of Recommender Systems: A Survey of the State-ofthe-Art and Possible Extensions, ” IEEE Transactions on Knowledge and Data Engineering (17:6), pp. 734-749.
20. Jain, A. K., Murty, M. N., and Flynn, P. J. (1999). Data Clustering: A Review. ACM, NewYork, USA..
21. Eastam, J. (2012). Canopy Clustering. Retrived on 16. 10. 2014. From https://cwiki. apache. org/confluence/display/MAHOVT/Canopy+clustering. 22. Mardia, K. V. Jupp, P. (2000). Directional Statistics. John Wiley and Sons Ltd.,