Bogotá Colombia Bogotá Colombia Bogotá Colombia Bogotá Colombia Bogotá Colombia Bogotá Colombia Bogotá Colombia Bogotá Colombia Bogotá -Operational Risk Management
using a Fuzzy Logic Inference System
Por: Alejandro Reveiz Carlos León
Núm. 574
2009Operational Risk Management using a
Fuzzy Logic Inference System
♦Alejandro Reveiz
Carlos León
Banco de la República
Colombia
♦ The following is a working paper and does not necessarily reflect the official position of the Central
Operational Risk Management using a
Fuzzy Logic Inference System
†Alejandro Reveiz♣
Carlos León♠
Abstract
Operational Risk (OR) results from endogenous and exogenous risk factors, as diverse and complex to assess as human resources and technology, which may not be properly measured using traditional quantitative approaches.
Engineering has faced the same challenges when designing practical solutions to complex multifactor and non-linear systems where human reasoning, expert knowledge or imprecise information are valuable inputs. One of the solutions provided by engineering is a Fuzzy Logic Inference System (FLIS).
Despite the goal of the FLIS model for OR is its assessment, it is not an end in itself. The choice of a FLIS results in a convenient and sound use of qualitative and quantitative inputs, capable of effectively articulating risk management’s identification, assessment, monitoring and mitigation stages.
Different from traditional approaches, the proposed model allows evaluating mitigation
efforts ex-ante, thus avoiding concealed OR sources from system complexity build-up
and optimizing risk management resources. Furthermore, because the model contrasts effective with expected OR data, it is able to constantly validate its outcome, recognize environment shifts and issue warning signals.
Keywords: Operational Risk, Fuzzy Logic, Risk Management. JEL Classification: G32, C63, D80.
† The following is a working paper and does not necessarily reflect the official position of the Central
Bank or its Board of Directors. The opinions and statements are the sole responsibility of the authors. This paper is the result of years of research and development first established by the Foreign Reserves Department and followed by the Operations and Market Development Department, at the International and Monetary Affairs Division of Banco de la República. The herein presented model is still under implementation; hence some practical enhancements could arise in the process. Authors are grateful to the staff involved in this process.
♣ Senior Investment Officer, World Bank, [email protected] / [email protected];
involvement in this working paper is limited to his previous position as Senior Researcher, International and Monetary Affairs Division, Banco de la República.
♠ Researcher, Operations and Market Development Department, Banco de la República. [email protected] / [email protected].
1. Introduction
International risk management practice for financial institutions focus on three main risk categories: Market Risk (MR), Credit Risk (CR) and Operational Risk (OR). The first two categories have a broad literature and, despite the recent financial turmoil, there exists some degree of consensus about the main characteristics a management model should fulfill in order to be considered useful.
Meanwhile, in spite of being present in all financial institution’s activities and notwithstanding the fact that it accounts for some of the biggest losses in history (Moosa, 2007; Gallati, 2003), there is less progress and consensus about what an OR management model should be.
For example, Basel Committee on Banking Supervision (BCBS) has chosen not to employ a soundly based model for calculating capital requirements due to OR. BCBS
proposal consists of an overall α% charge to the bank’s gross income as a proxy for OR
exposure, or to apply a βi% charge to a standardized list of business units and business
lines within the firm, where each unit or line (i) has its own gross income figure and is
assigned a different charge1; not only both alternatives rely on the assumption of
linearity of OR with the size of the banks or business activity (Pézier, 2003), but none of these alternatives alone creates an incentive for better OR management.
The vast majority of models, including the aforesaid BCBS’ Basic and Standardized approaches, are designed for capital requirement calculations only. They are not intended for risk management, which should fully entail the identification, assessment, monitoring and mitigation of OR. Moreover, traditional models are incapable of capturing the effect of risk management decisions, making impossible to evaluate their expected outcomes.
There are some reasons why OR management’s theoretical and practical development has been less dynamic when compared with MR and CR. Most of the reasons share a common ground: the unique characteristics of OR require models not only to deal with quantitative, but with qualitative information –a rather difficult task.
Taking into account the unique characteristics of OR this document develops a model which allows using qualitative and quantitative inputs in order to attain an expected OR figure. The chosen model, a Fuzzy Logic Inference System (FLIS), takes advantage of years of successful engineering experience when solving non-linear systems, multifactor problems, and using expert knowledge or subjective information as inputs.
The main advantage of the model is a sound and consistent treatment of qualitative and quantitative information, along with the ability to integrate the assessment process to the identification, monitoring and mitigation of OR, which allows the implementation of a rather complete OR management framework.
1 These two alternatives are named by the BCBS (2001) as the Basic Indicator Approach and
Standardized Approach, respectively. Besides these two approaches, BCBS defines the possibility of developing and implementing internal models, also known as Advanced Measurement Approaches, which are based on loss experience according to BCBS definition. For a complete description and analysis of the three approaches please refer to Dowd (2003) and Pézier (2003).
Additionally, contrary to traditional approaches, the proposed estimation of the expected OR figure allows effectively measuring and evaluating the expected outcome of risk management decisions, preserving this way the true preventive nature of risk management. Finally, because the model contrasts effective with expected OR data, it is able to constantly validate its outcome, recognize environment shifts and issue warning signals.
The document is structured as follows: next chapter briefly introduces OR, focusing on its unique characteristics and resulting challenges for risk management; the third chapter acquaints the reader with the basics of Fuzzy Logic (FL) and Fuzzy Logic Inference Systems (FLIS); the fourth chapter exhibits the general proposed FLIS for OR assessment; the fifth chapter presents the model’s results, and the last gives some final remarks about the model.
2. Characteristics and challenges of Operational Risk (OR)
OR is defined by the BCBS (2003) as the risk of loss resulting from inadequate or
failed internal processes, people and systems or from external events, including legal
risk, but excluding strategic and reputational risk.2 Despite BCBS’ effort to provide a
standard definition for regulatory purposes, OR is still an unclear concept. According to Moosa (2007), Holmes (2003), Gallati (2003) and Medova and Kyriacou (2001), this has encouraged “residual” definitions which term OR as those types of risk that could not be classified as either CR or MR.
Since a negative or residual definition of OR is difficult to work with (Moosa, 2007) and because it is expected that the BCBS -taking into account industry’s feedback- will include reputational risk (Gallati, 2003), this document embraces the following OR
definition: failure to meet an operational target or objective with resulting losses being
monetary or reputational, due to events such as inadequate or failed internal process, people and systems or from external events.3 This definition also tries to avoid focusing
on the underlying known causes and the resulting known losses which results in the causes’ and losses’ universe restriction to past observations (Moosa, 2007; Gallati, 2003), but to focus on the failure to comply with the firm’s operational objectives as the core issue, without unnecessarily restricting the causes or the results as is the case with most quantitative approaches to OR.
It is clear that OR includes non-linear, multidimensional, heterogeneous and untypical factors -such as the human factor-, therefore is a broad, complex and unclear topic, more involved than CR or MR.
Nevertheless, it is always tempting to use CR and MR quantitative approaches to assess OR; presumably, as asserted by Pézier (2003), this is an effort to facilitate the role of
2 Strategic risks are those resulting from fundamental shifts in the economy or political environment
(Gallati, 2003). Reputational risks are those resulting from adverse public opinion (BCBS, 1998; BCBS, 1997).
3 This is similar to the European Commission (2006) definition because it doesn’t exclude reputational
the supervisor. Unfortunately such temptation comes with severe limitations. Five main
characteristics of OR may explain this fact4:
Figure No.1
Operational Risk’s Main Characteristics
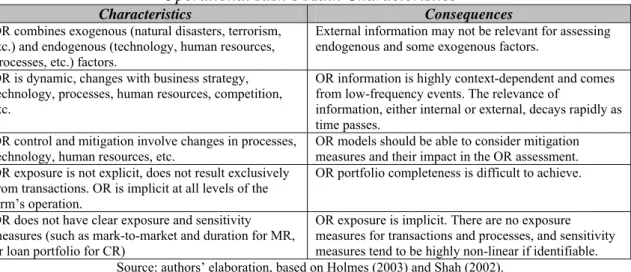
Characteristics Consequences
OR combines exogenous (natural disasters, terrorism, etc.) and endogenous (technology, human resources, processes, etc.) factors.
External information may not be relevant for assessing endogenous and some exogenous factors.
OR is dynamic, changes with business strategy, technology, processes, human resources, competition, etc.
OR information is highly context-dependent and comes from low-frequency events. The relevance of
information, either internal or external, decays rapidly as time passes.
OR control and mitigation involve changes in processes,
technology, human resources, etc. OR models should be able to consider mitigation measures and their impact in the OR assessment. OR exposure is not explicit, does not result exclusively
from transactions. OR is implicit at all levels of the firm’s operation.
OR portfolio completeness is difficult to achieve. OR does not have clear exposure and sensitivity
measures (such as mark-to-market and duration for MR, or loan portfolio for CR)
OR exposure is implicit. There are no exposure measures for transactions and processes, and sensitivity measures tend to be highly non-linear if identifiable. Source: authors’ elaboration, based on Holmes (2003) and Shah (2002).
Taking into account the characteristics and consequences above mentioned, five major OR management issues can be acknowledged:
• Historical information is scarce: Unlike MR and CR, OR losses data is
particularly scarce. This is due to the fact that the most relevant OR losses are of
the low-frequency-high-impact type5, which makes traditional quantitative
approaches based on loss experience difficult at best (Austrian Nationalbank, 2006; Shah, 2004; Alexander, 2003; Gallati, 2003; Holmes, 2003; BCBS, 2001). A traditional decision to surmount this problem is using industry’s (external) information. This alternative is not trouble-free because it assumes the existence of a common loss distribution for the whole industry and because some qualitative and quantitative methods could be necessary in order to make this information meaningful (BCBS, 2004).
Additionally, as asserted by Moosa (2007), industry’s information may be inaccurate just because it’s dubious that firms will make their entire operational loss data publicly available; they will be tempted to make public those loss events that make it to the media only.
Holmes (2003) also highlights that data scarcity also results in serious difficulties for validating or backtesting OR models, thus reducing their reliability or usefulness in predicting future outcomes.
4 Literature mentions some other characteristics such as OR being one-sided (there is no reward from
bearing OR), idiosyncratic (an operational event in one firm does not affect others) and indistinguishable from other kinds of risk. Moosa (2007) describes these characteristics and the reasons why they are not genuine.
5 OR events can be divided in two groups: i) low-frequency-high-impact (such as rogue trading, major
lawsuits, terrorism and natural disasters) and ii) high-frequency-low-impact events (such as settlement errors and credit card fraud). Occurrence of the latter results in efficiency losses, but low-frequency-high-impact events can adversely affect the capital of the firm, severely harm its reputation or in extreme situations even threaten its existence. (Holmes, 2003)
Historical information is not relevant: Besides scarce, OR data is highly context- dependent. Context dependency determines how relevant past data is to the system under analysis: if a system changes rapidly, the predictive ability of a model based on past data is quite limited. OR context dependency is explained by the continual change of organizations, the evolution of the environment in which they operate and because of extremely changing factors such as human resources and technology.
As Holmes (2003) states, CR and MR show a moderate level of context dependency, with statistical properties somewhat stable and reliable, whilst OR statistical properties are rather dynamic. Scandizzo (2000) highlights that the problem may not be the ability of a model to quantify a stable distribution of OR losses, but questions the mere existence of such a distribution.
As Scandizzo (2005) asserts, high-severity-loss events are not very useful in modeling future exposure, as the risk and control environment, and hence the statistical distribution underlying such events, changes sharply immediately thereafter.
Furthermore, because OR comprises factors such as training or professional experience, assessing OR involves a subjective and qualitative component not easily captured by traditional quantitative approaches (Scandizzo, 2000).
• Uncertainty about OR exposure and portfolio completeness: Whilst MR and CR
exposure stem from clear-cut transactions such as the mark-to-market of a currency position or the nominal value of a loan, OR exposure (or size) is not clear and is not explicit. OR arises from the mere existence of the firm and does not arise exclusively from a given transaction. As exemplified by Holmes (2003), two banks with identical asset and liabilities portfolios, with identical counterparties and instruments, will exhibit exactly the same MR and CR, but may differ significantly in their OR; this reinforces the previously mentioned non-relevance of external information.
Consequently, it is difficult to be certain of the OR exposure and portfolio completeness, particularly when relying on loss experiences as means for inferring loss distributions and assessing OR. In this sense, using losses experience, either internal or external, assumes that the only OR causes and effects are those found in the data sample; all other sources and effects of OR are inconveniently discarded.
• Unclear links between risk factors and OR losses: Unlike MR and CR, for OR
there isn’t a direct and clear link between the exposure and the likelihood or size of losses (Gallati, 2003; Holmes, 2003; Shah, 2002; Scandizzo, 2000). For example, MR has linear and non-linear approximations to risk sensitivity, such as bond’s duration and convexity or option’s delta and gamma, which clearly link exposure to losses.
As pointed by Scandizzo (2000), no mathematical models or pricing equations are available that rigorously link the occurrence of a particular OR factor to the
market value of a financial institution or with the amount of loss that can actually be incurred.
• Difficulties when capturing the effect of risk management decisions: MR and
CR management decisions (e.g. hedging or unwinding a position) directly and clearly affect the risk exposure of the firm. Due to OR complex and diverse risk factors and the inability of traditional quantitative approaches to evaluate the effect of changes in factors such as training, professional experience, processes, controls, or technology, it is difficult that mitigation decisions result in a truly updated OR figure.
As Scandizzo (2005) argues, MR and CR managerial decisions affect the resulting risk profile directly and in a manner that measurement models have no problem capturing. Differently, OR measurement managerial decisions may affect the risk profile in a number of different ways, none of which any measurement model can capture in a simple and direct way; statistical approaches in particular will be unable to take into account such changes, as historical data will reflect a risk and control environment which no longer exists. Remarkably, because of the non-linear and unique nature of OR factors, genuine mitigation efforts may even yield undesired outcomes. A firm willing to reduce OR may be tempted to undertake as much mitigation efforts (e.g. implementation of additional controls, new software, etc.) as possible;
nevertheless, due to the intricacy of ex-ante evaluation of OR management
decisions, the firm may be creating a system complexity build-up6, thus fostering
the rise of an unnoticed, yet potentially significant, source of OR.7
It is also important to highlight that using past operational losses data and statistical methods may yield risk measures, such as an OR Value at Risk or capital charges, but will be useless when trying to manage OR (Pézier, 2003; Cruz, 2002). It is crucial that OR models capture the expected effect of risk management decisions.
The mentioned characteristics validate the departure from MR and CR management techniques. Such quest for non purely-quantitative approaches has yielded diverse approaches, which can be classified according to their degree of reliance on data analysis and expert knowledge –the poles of the purely quantitative and purely qualitative models, respectively.
6 The system complexity build-up arises from the additional interactions created by the implementation of
mitigation efforts. The implementation of a new control (e.g. a new software) to mitigate OR may create new sources of OR, which may arise from the new control itself or from its interaction with other controls or processes.
7 This is akin to the decision of a firm to hedge via a complex derivative instrument. Despite its market
risk exposure may be reduced, if the derivative’s expertise of the firm is not adequate, the complexity of the chosen instrument may result in an undesired or unplanned outcome. As presented by Dowd (2003), the use of sophisticated techniques for mitigating CR and MR (e.g. collateralization, netting, credit derivatives, asset securitization) transforms these risks into operational risks.
Figure No.2 Risk Modeling Methods
Source: Shah (2002)
Shah (2003, 2002) identifies the dynamic and endogenous nature of OR as the main motivation for using expert knowledge in order to overcome purely quantitative approaches’ flaws. According to Shah, models capable of combining expert knowledge with data analysis are better suited for modeling OR.
Applications based on expert knowledge are not new, and are typical of disciplines different from Finance or Economics, such as Engineering. When dealing with complex systems, where information is incomplete or imprecise, especially when humans are
involved, control engineering has successfully relied on Fuzzy Logic (FL).8
It is important to highlight that FL is by no means a replacement for quantitative approaches when assessing OR losses, but a complement which deals with the complex and non quantitative information content of OR factors. Hence, Cruz (2002) asserts that FL does not compete with mathematical probability theory as means of evaluating random events or estimating an OR VaR, but rather can be regarded as a complement for dealing with real-world problems in which available information is subjective, incomplete or unreliable, and when systems are non-linear, allowing this way to understand OR correlations and causalities.
3. Fuzzy Logic (FL) and Fuzzy Logic Inference Systems (FLIS)
The fundamental concept of ordinary sets is “membership”, which states that an
element belongs or not to a set. This type of sets, described by unambiguous definition
and boundaries, is known as ordinary or crisp sets; these sets are characterized by
discrete–bivariate membership (yes or no, 1 or 0, true or false) and classic, Boolean or
Aristotelic logic.
8 According to Cruz (2002), FL
has been applied extensively in the real world, mostly in an engineering
context, to control systems where the timing and level of inputs are at least to some extent uncertain […].
FL everyday applications include medicine, automotive industry (e.g. antilock breaking systems, speed limiters), water treatment, air and ground traffic control, military sonar, nuclear fusion and home appliances design. FL has been used in finance industry too, mainly in insurance and credit card fraud detection, credit risk analysis, money laundering and other types of financial crime. (Sivanandam et al.,
2007; Austrian Nationalbank, 2004; Hoffman, 2002; von Altrok, 2002; Bundesbank, 1999; Klir and Yuan, 1995)
Data Analysis Modelling Expert input
Empirically from historical data Actuarial approach Extreme Value Theory (EVT) Stochastic Differential Equations Neural networks Regression over variables that affect risk
System dynamics simulation Bayesian belief networks Fuzzy Logic Influence diagrams Decision trees Direct assessment of relative likelihood Preferences among bets or lotteries Delphi method
In contrast to ordinary sets, Lofti A. Zadeh (1965) acknowledged the fact that in reality
there are elements characterized by membership functions which are not discrete, but
continuous, where different degrees of membership exist between yes or no, 1 or 0, true
or false; this type of sets have unclear boundaries, therefore Zadeh named them as fuzzy
sets. As stated by Sivanandam, et al. (2007), the main contribution of the fuzzy set
concept is the ability to model uncertain and ambiguous information, the kind of information frequently found in real life.
A plain example of an ordinary set is presented in the following graph. There are ten
concepts, of which we try to define the “American cities” set; it is straightforward that only Bogotá, Brasilia, Buenos Aires and Washington can be regarded as members of
such set. For ordinary sets there is no uncertainty about the applicable boundaries.
Figure No.3 An Ordinary Set
Source: authors’ elaboration.
The main difference between fuzzy set and ordinary set theories underlies on the fact
that the former allows for a gradual or partial membership of the elements (Cox, 1994), being able to recognize that membership can’t always be regarded as bivalent, Boolean
or binary, but as a matter of degree. A plain example of a fuzzy set is presented in the
following figure, where we try to establish the membership of the days of the week to the “week-end” set.
Figure No.4 A Fuzzy Set
Source: authors’ elaboration, based on Mathworks (2009).
In this example it is impossible to unambiguously assign a discrete membership to the week-end set for each one of the days of the week. For example, many individuals will include Friday as the beginning of the week-end, some others will define it at the end of Friday’s working hours, and others when the clock’s minute and hour hands meet at Friday’s midnight. It can be seen that the membership of the elements (days of the
Cotton Wheat Airplane Bogotá Washington Brasilia París Buenos Aires Zurich Moscow Cotton Wheat Airplane Bogotá Washington Brasilia París Buenos Aires Zurich Moscow Tuesday Sunday Wednesday Friday Thursday Monday Saturday Tuesday Sunday Wednesday Friday Thursday Monday Saturday
week) to the set (week-end) is not clearly bounded, is a matter of degree, therefore it is
better described by a fuzzy set. The next figure shows how this example is represented
through the membership concept.
Figure No.5
Days of the Week as Discrete and Continuous Membership
Source: authors’ elaboration, based on Mathworks (2009).
Another example is presented next. Regarding an individual’s height, according to
ordinary sets theory there is a precise –discrete- level which defines if someone is “tall”
or “short”; any person whose height falls below the threshold level is considered “short”, independent of the difference with such level, which can be ten inches or one
millimeter. In the other hand, being “tall” or “short” is a matter of degree for fuzzy sets.
Figure No.6
Height as Discrete and Continuous Membership
Source: authors’ elaboration, based on Mathworks (2009).
In this example, according to ordinary sets theory the man in the middle would be
regarded as “short”. For fuzzy sets theory the man in the middle belongs 80% to the
“short” concept and 20% to the “tall” concept, therefore gaining precision from rather imprecise concepts.
It is important to emphasize the fact that ordinary sets can be regarded as a particular
case of fuzzy sets, in which degrees of membership are restricted to two extreme
alternatives: 0 or 1.(Bojadziev and Bojadziev, 2007; Klir and Yuan, 1995)
In both examples the transition from a bivariate to a multivariate membership allows to better define the characteristics of an element, with clear gains in terms of ability to describe real-life cases and imprecise concepts. The lines used in Figure No.5 and No.6
Thursday Degr ee of M e m ber s h ip 0.0 1.0 Discrete Continuous 1.0 0.0
Thursday Friday Saturday Sunday Monday Friday Saturday Sunday Monday
Degr ee of M e m ber s h ip Thursday Degr ee of M e m ber s h ip 0.0 1.0 Discrete Continuous 1.0 0.0
Thursday Friday Saturday Sunday Monday Friday Saturday Sunday Monday
Degr ee of M e m ber s h ip 0.0 1.0 Discrete Continuous 1.0 0.0 Height Height 0.8 short 0.2 tall Degr ee of Mem ber s h ip Degr ee of Mem ber s h ip 0.0 1.0 Discrete Continuous 1.0 0.0 Height Height 0.8 short 0.2 tall Degr ee of Mem ber s h ip Degr ee of Mem ber s h ip
Triangular Trapezoidal Gaussian
Generalized Bell Sigmoidal (left) Polynomial (left)
to describe the membership –either discrete or continuous- of elements to a set are
known as membership functions.
A membership function is the line which defines the transition between sets, thus
mapping the degree of membership of the elements of such sets. In the height example
the ordinary membership function defines the transition as a discrete jump at a given
height level. A continuous membership function, typical of fuzzy sets, recognizes that an
individual belongs to the “tall” and “short” categories in some degree, with this degree varying in a smooth and continuous manner. Therefore, as pointed out by Sivanandam
et al. (2007), fuzzy sets theory allows dealing with imprecise or vague information
within a quantitative approach.
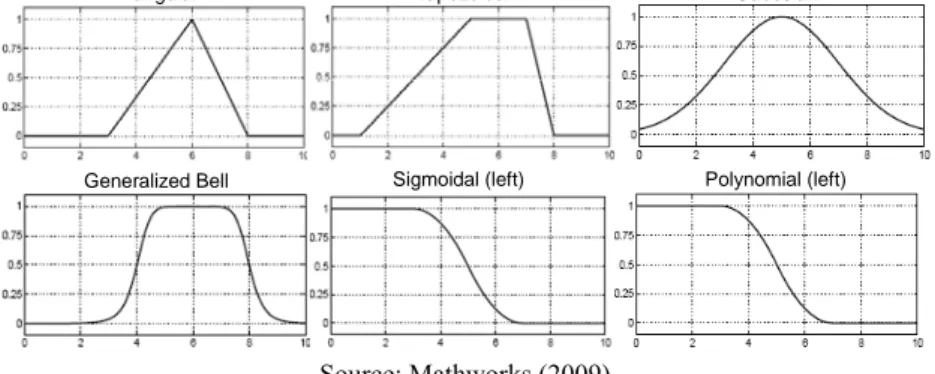
There exists a wide variety of membership functions. The most used and practical is the
triangular membership function, characterized by its simplicity and low information
requirements (Bojadziev and Bojadziev, 2007; McNeill and Thro, 1994). Nevertheless, there exist other functions such as trapezoidal, Gaussian, sigmoidal and polynomial, where higher complexity comes with higher information content. Some typical
membership functions are presented next.
Figure No.7
Typical Membership Functions
Source: Mathworks (2009)
Several membership functions can be used to better represent the sets, even using a
mixture of different types of functions. The next figure represents temperature as an
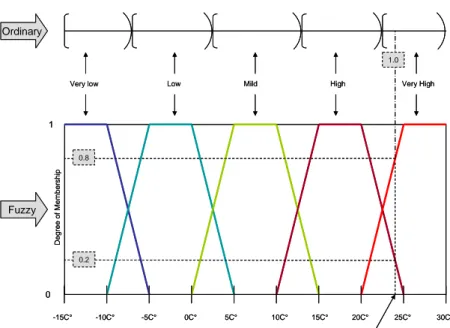
Figure No.8
Temperature as an Ordinary and as a Fuzzy Set
Source: authors’ elaboration, based on Klir and Yuan (1995).
The previous graph evaluates the degree of membership for the 24C° temperature,
where five categories exist: Very Low, Low, Mild, High and Very High. If the
temperature is considered as an element of an ordinary set (upper section of Figure
No.8) 24C° would be considered unambiguously (100%) as a Very High temperature,
although being somewhat close to the level where it could be considered as High; a
change of a couple of degrees would result in an abrupt change of category. If
considered as an element of a fuzzy set (lower section of Figure No.8) 24C° would be
regarded as 80% Very High and 20% High, and this membership would vary smoothly
and continuously as temperature changes.
The process just presented, converting a crisp quantity to the appropriate fuzzy sets
through the use of membership functions, is known as fuzzification (Sivanandam, et al.,
2007; Klir and Yuan, 1995; McNeill and Thro, 1994). According to Klir and Yuan
(1995) the gain of fuzzification is greater generality, higher expressive power, an
enhanced ability to model real-world problems and, most importantly, a methodology
for exploiting the tolerance for imprecision; besides, although the use of ordinary sets is
mathematically correct, it is unrealistic and unpractical.
The choice of the membership function is somewhat arbitrary but should be done with
simplicity, convenience, speed and efficiency in view (Mathworks, 2009). Cox (1994) emphasize that special attention should be drawn to the overlapping between
membership functions: the overlapping is a natural result of fuzziness and ambiguity
associated with the segmentation and classification of a continuous space.
Cox (1994) also highlights that FL models are rarely sensitive to the membership
function choice, making them quite robust and resilient, which is an important property
when models are initially prototyped.
-15C° -10C° -5C° 0C° 5C° 10C° 15C° 20C° 25C° 30C°
Very low Low Mild High Very High
D egr ee of Mem ber s h ip 0 1 0.2 0.8 1.0 Ordinary Fuzzy 24C° -15C° -10C° -5C° 0C° 5C° 10C° 15C° 20C° 25C° 30C°
Very low Low Mild High Very High
D egr ee of Mem ber s h ip 0 1 0.2 0.8 1.0 Ordinary Fuzzy 24C°
Concerning the logic used to evaluate propositions, ordinary sets rely on ordinary logic;
this type of logic, also known as classical, Aristotelic or Boolean logic, conceives the universe in terms of well-structured categories, where an item is either a member of a
set or not, without the existence of middle grounds.9 Using the logical operators AND,
OR and NOT, which correspond to conjunction, disjunction and complement,
respectively10, propositions are evaluated as follows:
Figure No.9
Ordinary Logical Operators
Conjunction Disjunction A B A AND B A B A ORB A NOT A 0 0 0 0 0 0 0 1 0 1 0 0 1 1 1 0 1 0 0 1 0 1 1 1 1 1 1 1 Complement
Source: authors’ elaboration.
As mentioned before, ordinary sets can be regarded as a particular case of fuzzy sets, in
which degrees of membership are restricted to two extreme alternatives (0 or 1). Due to
this fact the choice of the fuzzy logical operators should be able to preserve the ordinary
logical operators for bivariate memberships –as in Figure No.9- and be capable of
evaluating multivariate degrees of membership. The simplest fuzzy logical operators
which comply with these requirements are the following:
Figure No.10 Fuzzy Logical Operators
Conjunction Disjunction
A B min(A,B) A B max(A,B) A 1-A
0 0 0 0 0 0 0 1
0 1 0 0 1 1 1 0
1 0 0 1 0 1
1 1 1 1 1 1
Complement
Source: authors’ elaboration.
Using min(.) instead of AND for conjunction, max(.) instead of OR for disjunction and 1-(.) instead of NOT for complement, allows the logic to be applied to any set,
independent of it being discrete or continuous.11
Fuzzy logic operators allow assessing propositions with respect to a fuzzy set. Based on
the previously presented fuzzy representation of temperature (Figure No.8) some propositions are assessed next:
9 Classic, Aristotelic or Boolean logic deals with propositions that are necessarily either true or false. This
type of logic relies on two inviolable laws: the Law of Non Contradiction and the Law of the Excluded Middle. The former says that the intersection of a set with its complement results in an empty or null set (A ∩Ā = ∅); the latter says that the union of a set with its complement results in the universal set of the underlying domain (A ∪Ā = X). (Cox, 1994; Klir and Yuan, 1995)
10 Mathematically the logical operator AND can be expressed as “intersection” (∩), OR can be expressed
as “union” (∪) and NOT as “complement” (XC).
11 Some alternatives do exist for the min(.) and max(.) functions. In the case of disjunction min(.) may be
replaced by product [prod(.)] and max(.) may be replaced by the algebraic sum [probor(.)], where
probor(a,b)= a + b – ab. Nevertheless, the majority of FL applications use min(.) and max(.) as
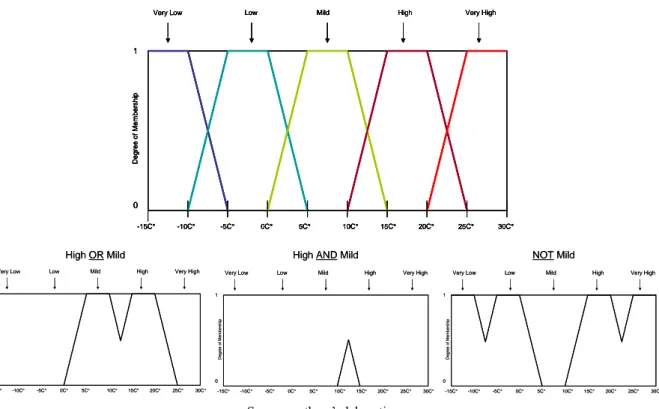
Figure No.11
Assessing Propositions with Respect to a Fuzzy Set12
Source: authors’ elaboration.
The existence of these fuzzy logical operators allows developing and evaluating fuzzy
inference rules, which are rules for deriving truths from stated or proven truths
(McNeill and Thro, 1994). The set of fuzzy inference rules or knowledge base which
contain general knowledge pertaining to a problem domain, connect antecedents with consequences, premises with conclusions, or conditions with actions (Klir and Yuan,
1995). If A and B are fuzzy sets, the simplest form of a fuzzy inference rule is the
following:
if A, then B
Other more elaborate rules may look like the following:
if A is […] AND B is […],then C is […]
if A is […] AND B is […] OR C is […], then D is […] if A is not […] OR B is […] AND C is […], then D is not […], etc.
Inference rules result from expert knowledge and try to imitate human’s reasoning
capabilities. Cox (1994) claims that the process of building a knowledge base via the
12 The reader should be aware that this figure demonstrates that under FL the Law of Non Contradiction
of ordinary logic (the intersection of a set with its complement results in an empty or null set) does not
hold: for example, the intersection of the NOT Mild set and Mild set is not an empty set. According to
Cox (1994) some of the strongest and deepest capabilities in fuzzy reasoning stem from its failure to obey this dictum of Boolean logic.
High OR Mild High AND Mild NOT Mild
-15C° -10C° -5C° 0C° 5C° 10C° 15C° 20C° 25C° 30C°
Very Low Low Mild High Very High
Deg ree of M e m b e rsh ip 0 1 -15C° -10C° -5C° 0C° 5C° 10C° 15C° 20C° 25C° 30C°
Very Low Low Mild High Very High
Deg ree of M e m b e rsh ip 0 1 -15C° -10C° -5C° 0C° 5C° 10C° 15C° 20C° 25C° 30C°
Very Low Low Mild High Very High
D e gree of M e m b ers h ip 0 1 1
Very Low Low Mild High Very High
D e gre e of M e m b e rs h ip -15C° -10C° -5C° 0C° 5C° 10C° 15C° 20C° 25C° 30C° 0 1 D e gre e of M e m b e rs h ip -15C° -10C° -5C° 0C° 5C° 10C° 15C° 20C° 25C° 30C° 0
Very Low Low Mild High Very High
High OR Mild High AND Mild NOT Mild
-15C° -10C° -5C° 0C° 5C° 10C° 15C° 20C° 25C° 30C°
Very Low Low Mild High Very High
Deg ree of M e m b e rsh ip 0 1 -15C° -10C° -5C° 0C° 5C° 10C° 15C° 20C° 25C° 30C°
Very Low Low Mild High Very High
Deg ree of M e m b e rsh ip 0 1 -15C° -10C° -5C° 0C° 5C° 10C° 15C° 20C° 25C° 30C°
Very Low Low Mild High Very High
D e gree of M e m b ers h ip 0 1 1
Very Low Low Mild High Very High
D e gre e of M e m b e rs h ip -15C° -10C° -5C° 0C° 5C° 10C° 15C° 20C° 25C° 30C° 0 1 D e gre e of M e m b e rs h ip -15C° -10C° -5C° 0C° 5C° 10C° 15C° 20C° 25C° 30C° 0
elaboration of fuzzy inference rules forces experts to deconstruct their expertise into
fragments of knowledge, which results in a significant benefit of fuzzy system modeling: to gain the ability to encode knowledge directly in a form that is very close to
the way experts them-selves think about the decision process.13
As stressed by Sivanandam, et al. (2007), the Achilees’ heel of a fuzzy system is its
rules; smart rules give smart systems and other rules give less smart or even dumb systems. Bojadziev and Bojadziev (2007) emphasize the important role played by the
experience and knowledge of human experts when developing the knowledge base
because they are appointed to state the objective of the system to be controlled.
The evaluation of the inference rules is carried out by a fuzzy inference processing
engine, which is based on the fuzzy logical operators previously introduced. The fuzzy inference processing engine is in charge of evaluating input’s degree of membership to
the fuzzy output sets according to all the inference rules, where such evaluation is done
simultaneously.14
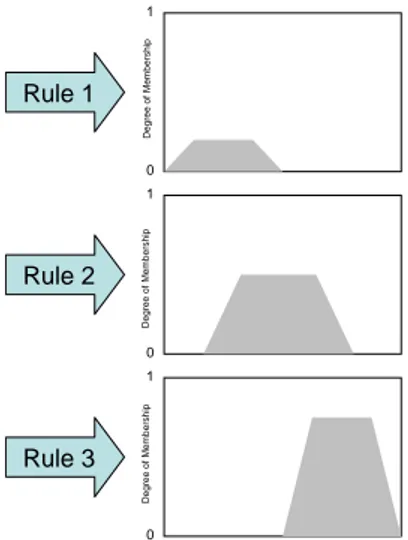
Each time the fuzzy inference processing engine evaluates an input’s degree of
membership to the inference rules, it maps each solution variable into its corresponding
output fuzzy set, where the resulting number of output fuzzy sets matches the number of
inference rules used to evaluate the inputs. For example, after evaluating an input (or
inputs) with three inference rules we could have the following three resulting output
fuzzy sets:
Figure No.12 Output Fuzzy Sets
Source: authors’ elaboration.
13 Cox (1994) emphasizes that conventional expert and decision systems fail because they force experts to
crisply dichotomize rules, resulting in an unnecessary multiplication of rules and the inability to articulate solutions to complex problems.
14 According to Cox (1994) the main difference between conventional expert systems and a
fuzzy expert
system is the latter’s simultaneous evaluation of inference rules, which compared to the serial evaluation
of the former has the advantage of being able to examine all the rules and their impact in the output space.
0 1 0 1 0 1 Rule 2 Rule 3 Rule 1 Degre e of Me m b er sh ip Degr e e of M e m b ership Degree of M e m b ership
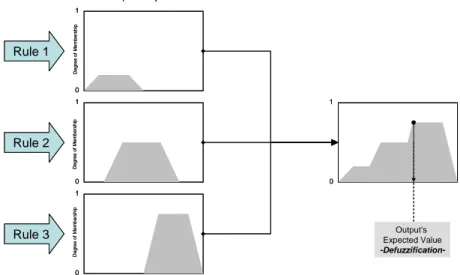
The aggregation of these three fuzzy sets produces the final output fuzzy region, which
contains the information of the degree of membership (or truth) of the inputs (or
propositions) after evaluated by all the inference rules.
Afterwards, because a single and crisp quantity is required, the best representative value of the output fuzzy region has to be calculated; because of consisting in the conversion
of fuzzy into ordinary quantities, this process is known as defuzzification, and
corresponds to the calculation of the expected value of the output (Cox, 1994).
Figure No.13
Aggregation and Defuzzification
Source: authors’ elaboration.
According to the literature (Sivanandam, et al., 2007; Klir and Yuan, 1995; Cox, 1994),
there exist several defuzzification methodologies:
• Centroid: this is the most widely used method, also known as the center of gravity method or center of area method. It’s calculated as the weighted average
of the output fuzzy region and corresponds to the point in the x-axis which divides the output fuzzy region into two equal subareas.
• Max-membership-principle: also known as height method or maximum height method, finds the domain point with the maximum truth, which corresponds to
the x-axis point where the maximum height with respect to the origin is found. If the solution is not unique, the point is located in the center of the solution range; when this conflict resolution approach is used the method is regularly known as
Mean-max-membership-principle.
• Weighted average method: the maximum truth (height) of each output fuzzy set
is used to calculate the weighted average of maximum truth.
• Centre of sums: similar to the weighted average method, but the areas of each
output fuzzy set are used as weights instead of using the truths (heights).
• Center of largest area: the centroid of the largest output fuzzy set area is used as
the expected value of the output. 0 1 0 1 0 1 0 1 Rule 2 Rule 3 Rule 1 Degre e of Mem b ershi p D e gr e e of Memb er ship Degre e o f Mem b ers h ip
Output Fuzzy Set
Output’s Expected Value -Defuzzification-0 1 0 1 0 1 0 1 Rule 2 Rule 3 Rule 1 Degre e of Mem b ershi p D e gr e e of Memb er ship Degre e o f Mem b ers h ip
Output Fuzzy Set
Output’s Expected Value
-Defuzzification-According to Sivanandam, et al. (2007), Klir and Yuan (1995) and Cox (1994) the most
used method is the centroid. Cox (1994) highlights centroid’s consistency and
well-balanced approach, its sensitiveness to the height and width of the total fuzzy region15
and the smooth changes in the expected value of the output across observations; Cox also emphasizes that unless there are reasons to believe that the model requires a more advanced or specialized method of defuzzification, the model should be limited to either the centroid or the max-membership-principle method.
Finally, according to McNeill and Thro (1994), the combination of fuzzy inference rules
and the fuzzy inference processing engine –based on fuzzy logical operators- results in
an expert fuzzy system. Jointly, as in Figure No.14, the use of an expert fuzzy system and fuzzy sets theory results in a Fuzzy Logic Inference System (FLIS).
Figure No.14
A Fuzzy Logic Inference System
Source: authors’ elaboration.
4. A Fuzzy Logic Inference System (FLIS) for Operational Risk (OR)
OR is a good candidate for a FLIS-based solution. Inputs to be captured include qualitative and quantitative information, whereas the former comes mainly from expert knowledge and the latter is rather incomplete and scarce. Additionally, the solution space is highly multidimensional and non-linear, where expert-human knowledge has a lot to offer in terms of articulating solutions to complex problems, and where traditional quantitative approaches alone are fated to fail.
Several authors (Austrian Nationalbank, 2006; Elkins, 2004; Shah, 2003; Causal Actuarial Society, 2003; Shah, 2003; Hoffman, 2002; Cruz, 2002; Scandizzo, 2000) have highlighted some of the aforesaid potential benefits of using FL based approaches to measure OR. Nevertheless, just a few (Elkins, 2004; Shah, 2003) have developed a formal, yet practical, OR model, which is the primary objective of this section.
Furthermore, because a FLIS-based solution is capable of evaluating updated qualitative and quantitative OR factors, and their interactions through the imitation of human’s reasoning capabilities, it is possible to obtain an updated and comprehensive expected OR figure. Most notably, this possibility allows the risk management process to
15 Regarding
centroid’s sensitiveness, Cox (1994) affirms that it behaves in a manner similar to Bayesian
estimates, that is, it selects a value that is supported by the knowledge accumulated from each executed proposition.
Fuzzy Inference Engine
(Fuzzy Logical Operators)
Inference Rules Fuzzy Sets in X Fuzzy Sets in Y Expert Fuzzy System Ordinary Sets in X Ordinary Sets in Y Fuzzification Defuzzification Fuzzy Sets Theory Fuzzy Logic Fuzzy Inference Engine
(Fuzzy Logical Operators)
Inference Rules Fuzzy Sets in X Fuzzy Sets in Y Expert Fuzzy System Ordinary Sets in X Ordinary Sets in Y Fuzzification Defuzzification Fuzzy Sets Theory Fuzzy Logic
evaluate mitigation efforts ex-ante, avoiding in some extent the aforementioned system
complexity build-up and optimizing risk management resources.
The herein proposed OR model can be described as a FLIS model based on the
self-assessment of Key Rate Indicators (KRIs) within a bottom-up approach. In the next
sections this broad description will become clear as we address the two first stages of risk management: identification and assessment. Monitoring and mitigation stages are addressed in the fifth chapter after the model’s results are presented.
a. Identification
The identification process begins by defining the appropriate approach for managing
OR. Two alternative approaches are commonly used: top-down and bottom-up.
The first alternative, a top-down approach, focuses on OR’s identification through the
combination of an external or internal database of loss events and traditional risk discovery techniques such as workshops, checklists or questionnaires, where identified risks are aggregated into risk categories consistent with the organization’s definition of
risk. Top-down approaches do not focus on the identification of sources or causes of
risk, but on the identification of direct or indirect losses that have affected or may affect the firm as a whole, where the identification process is usually centralized within the organization. (Gallati, 2003)
Differently, a bottom-up approach, instead of relying on effective or potential losses
(symptoms), focuses primarily on the identification of the potential sources or causes of OR within the organization (Gallati, 2003). Under this approach the identification process requires the organization’s breakdown into its core processes, which in turn may be broken down into subprocesses and tasks, followed by mapping risk exposures and the potential downside events that could result in the inability to meet the firm’s objectives; the risk exposure analysis includes understanding the risk factors that generate OR (human resources, technology, processes, external events, etc.) and recognizing their interrelations and their typically non-linear cause-and-effect relationship.
Regarding OR quantitative assessment, a top-down approach consists of calculating a
loss figure at the firm level and then attempting to allocate it down to the firm’s businesses, often using a proxy such as expenses or a scorecard approach. Under a
bottom-up approach OR quantitative assessment consists of the analysis of loss events
in individual business processes and the identification and quantification of each type of risk at that level (Haubenstock and Hardin, 2003).
Despite both approaches may use qualitative information, the bottom-up approach will
profit more from it. Under the bottom-up approach the expert knowledge is used to
understand the linkages between OR factors and their effects, thus providing valuable information for monitoring and mitigation stages. The use of qualitative information
under a top-down approach mainly consists of an overall impression of the OR at the
firm level (Gallati, 2003).
The choice between a bottom-up and a top-down approach within the proposed model
use of and profit from qualitative inputs at a conveniently disaggregated level. This will allow a more comprehensive and constructive identification, assessment, monitoring and mitigation of OR. As Scandizzo (2005) argues, because OR is not product specific, risk mapping is the basis for OR management.
Consequently, the identification stage will consist of the firm’s breakdown into its core processes, which in turn may be broken down into sub-processes and tasks. As Haubenstock (2003) asserts, the result of this stage is a risk map detailing which of these risks applies to any one business, process or organizational unit and to what degree, where degree is often defined as frequency and severity, rated either qualitatively (high, medium, low) or on a quantitative scale.
The number of levels the firm is broken-down into will depend on firm’s characteristics such as size, complexity of its processes and the employee’s background. Authors’ experience in the implementation of the proposed model within the International and Monetary Affairs Division of Colombia’s Central Bank signals the benefits of a detailed breakdown. The possibility of reaching the expertise of the incumbent or “owner” of each one of the tasks which compose the processes and sub-processes results in an extraordinary practical view of the interaction and consequences of OR causes. In many occasions the incumbent of the task was able to identify, describe and analyze OR sources and linkages which were not apparent to the managerial staff.
According to Blunden (2003) the identification of a risk’s incumbent or “owner” is to ensure that a specific person (or committee) takes responsibility for the risk and therefore for its management and mitigation, not to generate a blame culture. Without such responsibility approach for risk ownership there will be many fewer risks identified and much less enthusiasm on the part of management and supervisors to be conscious of the risks faced by an organization.
Despite a high-detail decomposition of the firm’s processes may help identify and analyze a broader base of OR sources and their connections, two main issues have to be considered. First, if the firm is too large the implementation of a risk management program may become burdensome; however, even if the majority of the firm’s operational risk does not result from a few critical processes, this issue may be partially surmounted through a decentralized implementation of the model within the firm. Second, depending on the employee’s background, the qualitative inputs may become particularly biased; a careful design of the management process (e.g., a “no blame” culture) is necessary to avoid subjective bias (Alexander, 2003). Again, the risk manager should find an optimal level of detail for the firm’s sources of risk according to its inherent characteristics.
b. Assessment
Assessment provides the organization with an objective process by which to determine what the exposures are, how well the organization is controlling and monitoring them, what the potential weaknesses are, what the organization should be doing to improve, who is responsible for these actions, and how the organization plans to accomplish them. (Haubenstock, 2003)
OR assessment under this model relies on a Fuzzy Logic Inference System (FLIS). As
presented before, the design of the FLIS consists of several elements, which will serve the purpose of capturing and interpreting quantitative and qualitative factors in order to ultimately deduce an expected OR figure. Hence, before applying the FLIS model, the elements of a FLIS should be properly defined.
i. Inputs and fuzzification procedure
Risk mapping may be described as a systematic way of extracting task-specific information on the various ways a process can fail (Scandizzo, 2005). The most simple and common risk mapping technique consists of constructing a probability/severity chart where risk management priorities may be easily identified, but where information for specific management actions is absent.
A more complete way is to map the risks to the phases of a business activity and identify the task-specific key risk factors and drivers in the process; this leads to a more complex result, where priorities and information for management’s specific actions are provided, but where standardization across different firms, processes or even tasks is rather troublesome.
The herein proposed mapping technique is an intermediate one, where the trade-off between standardization and comprehensiveness is most favorable and constructive for an effective risk management program. Instead of identifying heterogeneous task-specific key risk factors or constructing a plain probability/severity chart, the model relies on task-generic key risk factors, capable of reasonably signaling priorities and strategies for risk management purposes.
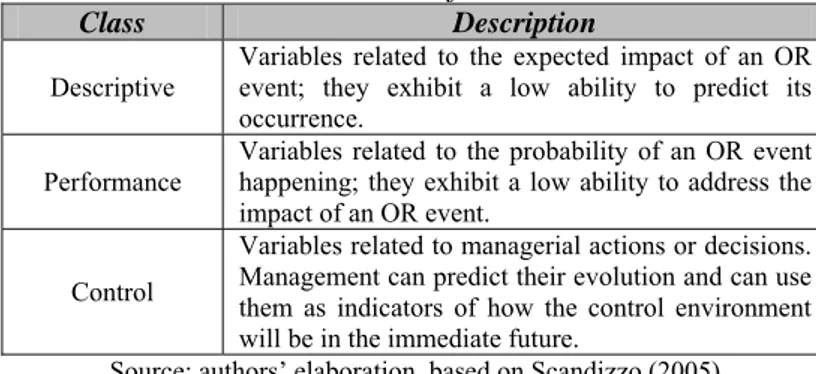
The aforementioned task-generic key risk factors will be those variables, either quantitative or qualitative, which together will serve the purpose of estimating the probability and severity of OR events at the task level. Those risk factors are commonly known as Key Risk Indicators (KRIs) and can be classified as descriptive, performance or control indicators.
Figure No.15 KRIs’ Classification
Class Description
Descriptive Variables related to the expected impact of an OR event; they exhibit a low ability to predict its occurrence.
Performance
Variables related to the probability of an OR event happening; they exhibit a low ability to address the impact of an OR event.
Control
Variables related to managerial actions or decisions. Management can predict their evolution and can use them as indicators of how the control environment will be in the immediate future.
Source: authors’ elaboration, based on Scandizzo (2005) The definition of the KRIs should observe five convenient features:
• Relevancy (variables should effectively capture a specific KRI class);
• Generality (variables can be used across firms, processes or tasks);
• Measurability (variables should be quantifiable and verifiable);
• Monitoring facility (cost and simplicity of monitoring).
According to these features, the proposed KRIs are i) impact of task’s failure on the
process; ii) impact of process’ failure on the firm’s objectives; iii) expertise; iv) probability, and v) feedback. The following figure describes and classifies the proposed
KRIs.
Figure No.16 Selected KRIs
KRI Class Description Source; Type
Impact of task’s failure on the process (IoP)
Expected impact at the process level of an OR
event happening in a specific task. Expert knowledge from the task’s incumbent and
backup; Qualitative input.
Impact of process’ failure on the firm
(IoF)
Descriptive
Expected impact at the firm’s business level of an OR event happening in a specific process.
Expert knowledge from the process’ manager; Qualitative input.
Expertise
(E) Control
Perceived proficiency of the employee for developing a specific task. It comprises the human resources training and knowledge level.
Expert knowledge from the task’s incumbent and backup; Qualitative input.
Probability
(P) Performance Control /
Expected likelihood of an OR event happening in a specific task. It comprises the efficiency of controls in place.16
Expert knowledge from the task’s incumbent and backup; Qualitative input.
Feedback
(F) Performance
Effective OR data is contrasted against expected OR in order to constantly validate the model and recognize eventual environment shifts. It issues warning signals as reality overtakes expectations.
OR event collection; Quantitative input. Source: authors’ elaboration.
Some important remarks about the selected KRIs, their characteristics and the proposed capture method are now addressed:
• Each task requires the evaluation of the mentioned KRIs, which means that
each task has its own OR assessment. In order to obtain the sub-process, process or firm level OR figure, an aggregation method should be defined. Authors’ choice is to equally weight each task, sub-process or process within the firm. This choice recognizes that impact related KRIs already represent a weighting scheme.
The aggregation of the OR allows achieving a firm level figure, which can be easily decomposed for OR prioritizing purposes, as will be described when the mitigation stage is addressed.
• Besides capturing the qualitative information from the task’s incumbent, the
appointed backup employee is also required to separately provide his qualitative information. Both employees’ qualifications are weighted by their
expertise level to obtain the weighted expected OR Indicator.
16 The proposed model deals directly with the risk remaining after all -formal and informal- controls are
considered (residual risk). The authors found that questioning employees or managers about the
probability of an OR event happening without controls (inherent risk) resulted in awkward and ultimately unhelpful answers.
This is of key importance for the model since it is most probable that OR will increase as the backup is temporarily in charge of the incumbent’s duties. Thus, when the incumbent is absent from the office (e.g. on vacation, ill, etc.) the backup information is the sole source of KRIs.
• Besides capturing the information for a normal state-of-the-nature scenario, the
incumbent and the backup are required to gather and give their qualitative information about what a contingency state (earthquake, collapse of communications, etc.) would imply for the probability (P) KRI. This is of key importance for the model since it allows identifying tasks, sub-processes and processes which are more sensitive to extreme events happening.
• The feedback (F) KRI is a particular input, which will result from the OR event
collection. Depending on the task the feedback is captured manually (e.g. in a
spreadsheet) or on real-time (e.g. an automatic electronic error report from a
transactional platform).17
Feedback is a quantitative input that serves the purpose of contrasting the
expected OR events with effective OR events. If effective OR events surpass the expectancy, the model internally adjusts –increases- the expected OR in order to recognize an eventual environment shift or a injudicious KRI evaluation; at the same time a warning signal is issued to inform the risk manager of the incident.
• To separately capture the impact of task’s failure on the process and the impact
of process’ failure on the firm’s objectives allows discriminating between OR events that could seriously endanger firm’s business goals and those that may be important at the process level, but have moderate or negligible effects for the firm.
To guarantee a sound judgment of the impact of a process’ failure on the firm’s business goals a strategic view of the firm is required. Therefore, the managerial level should be appointed to provide this KRI.
• In order to capture the inputs, the incumbent and the backup use a Matlab®
based GUI (Graphic User Interface) which requires a non-scaled qualitative assessment of the corresponding KRIs for each of his tasks (IoP, P, E). The manager of each process also uses a GUI for his qualitative assessment of IoF. This means that the model relies on self-assessment.
Haubenstock (2003) asserts that self-assessment helps to unveil and discuss risk across the organization and discuss interdependencies, but highlights that independent involvement plays a key role in coordinating, reviewing, discussing and challenging the results in order to ensure that everyone is responding in a consistent fashion.
17
Feedback’s capture is a rather difficult chore. For automated tasks it may require some technological
developments; for non-automated tasks, where an employee is in charge of event’s report and
documentation, feedback’s capture may be troublesome. This is the KRIs which author’s are still working
Authors’ experience corroborates Haubenstock assertions. It is crucial to have a staff that ensures consistency in the assessment procedure, capable of fully understanding the FLIS and of analyzing the responses in order to keep the process and results objective. Additionally, authors found that training and accompanying incumbents, backups and managers is essential to facilitate and enhance the procedure.
Afterwards, in order to capture KRIs and to be able to translate them into quantitative
variables, the fuzzification procedure should be defined. The foundation of this
procedure is the design of the fuzzy sets and the membership functions.
The fuzzy sets theory will make possible to obtain the imprecise and vague, yet valuable
and irreplaceable, judgment of the people associated with the tasks and processes to be
evaluated. It would be clumsy and imprecise to ask for true or false, yes or no, 1 or 0
answers when dealing with variables such as expertise, impact or probability.
In order to translate the judgment of the people into a quantitative variable, the
corresponding membership functions should be defined. Authors’ choice is to employ
the most used and practical membership function: triangular (Bojadziev and Bojadziev,
2007; McNeill and Thro, 1994). The next figure presents authors’ Probability (P) input
as a mixture of triangular membership functions.
Figure No.17
Probability KRI as a Fuzzy Variable
Source: authors’ elaboration.
ii. Outputs
The expected OR figure may be of two types: expected operational loss or expected operational indicator. The choice will depend on the objectives of the OR management model. If the model is intended to solely calculate capital requirements due to OR, then the expected OR figure should inevitably be a dollar-loss; if the model is intended to serve as a tool for OR management, it may yield a loss or an indicator.
The choice of expected OR figure type will define the nature of the output fuzzy set. If
the expected OR figure is in the form of an index OR Indicator, the risk manager should
fit linguistic variables such as high, medium and low to a subjective output scale (e.g. 0
to 10, 1 to 100, etc.) through the design of appropriate membership functions; in this
Low Medium-low Medium Medium-high High
way the risk manager will use the model’s output as a relative indicator of the expected OR.
If the expected OR figure is monetary the risk manager will define a scale which reveals his expert judgment of how to qualify a monetary loss. According to Shah (2003), since inference rules cover all possible combinations of KRI levels, an estimated loss amount can be calculated for the current levels of each KRI, resulting in a expected OR dollar-loss; in this case, instead of defining a subjective indicator scale, the risk manager should fit an OR dollar-loss scale, which may result from an empirical distribution based on –internal or external- historical losses or other quantitative methods such as Extreme Value Theory.
As stated by Sevet (2008), because central banks’ OR relate to the potential failure to achieve predefined legal or statutory obligations, their approach to the OR management
has to remain predominantly qualitative.18 Since the proposed model was built for the
Foreign Reserves Department and the Operations and Market Development Department of Colombia’s Central Bank, an organization not obliged to calculate OR capital
requirements, the choice is to employ an OR Indicator as output.
Therefore, authors’ choice is to use a 0 to 10OR Indicator which employs a mixture of
the most used and practical membership function: triangular. The next figure presents
authors’ output set.
Figure No.18
OR Indicator as a Fuzzy Variable
Source: authors’ elaboration.
As already mentioned, a risk manager interested in a monetary OR figure could fit an
estimated loss amount instead of an OR indicator. In this case traditional quantitative
approaches could help the risk manager to define the most appropriate dollar-loss scale.
18 On the other hand, because all private sector risk-generating events materialize in a financial
“Value-at-Risk”, their OR management can and indeed must be based on a quantitative approach and justify monetary incentives at company and individual levels. (Sevet, 2008)
Negligible Negligible/Low Very Low Low Low/Medium Medium/High High Very High High/Catastrophic Catastrophic
iii. Knowledge base
The set of inference rules or knowledge base have the objective of deconstructing
expert’s knowledge and encoding it in a form that the FLIS is capable of mimicking human’s reasoning capabilities to solve complex systems.
Therefore, an expert (or group of experts) analyzes the KRIs, their different linkages and their relation to the linguistic variables in the output space, resulting in a list or set
of educated inference rules that will solve simultaneously any combination of inputs
and calculate the expected OR Indicator.
Authors’ knowledge base consists of approximately 180 inference rules. Literature
doesn’t mention a method for establishing the optimal number of inference rules, but to
achieve an intuitive, smooth and continuous solution space for every combination of KRIs is a fair rule of thumb adopted by the authors.
iv. Defuzzification
Having specified the input space, the output space, and the knowledge base, the method
for estimating the expected OR Indicator is to be defined. Cox (1994) highlights
centroid’s consistency and well-balanced approach, its sensitiveness to the height and
width of the total fuzzy region and the smooth changes in the expected value of the output across observations. Additionally, Cox affirms that it behaves in a manner similar to Bayesian estimates, that is, it selects a value that is supported by the knowledge accumulated from each executed proposition.
Taking into account these advantages and because it’s the most used method
(Sivanandam, et al., 2007; Klir and Yuan, 1995; Cox, 1994), centroid or center of
gravity method is the authors’ choice.
5. Results
Based on the set of inference rules the FLIS is capable of inferring all the attainable OR
Indicator results for any KRIs combination. These results are best presented as a surface
plot; the next figure exhibits the OR Indicator as a combination of Impact on the
Figure No.19
OR Indicator as a combination of Impact on the Process and Probability
Source: authors’ elaboration.
The previous figure, somewhat similar to a probability/severity chart, displays the
non-linear relation between Impact on the Process or Probability and the OR Indicator,
where each combination of these KRIs results in a unique position on the surface.
Intuitively, if an event happening within a task has a low (high) Impact on the Process
and a low (high) Probability, the OR Indicator yields a low (high) outcome, where
intermediate results are also considered according to the knowledge base.
Figure No.20 exhibits the OR Indicator as a combination of Impact on the Process and
Expertise. Once again, the non-linear relation between the selected KRIs is
acknowledged.
Figure No.20
OR Indicator as a combination of Expertise and Probability
Source: authors’ elaboration.
Comparing Figure No.19 and Figure No.20 helps distinguishing the different effects of
changes along Probability and Expertise on the OR Indicator according to the expert’s
knowledge. Because the slope of the OR Indicator with respect to Probability is greater
that the slope with respect to Expertise –holding all other KRIs constant– it could be
asserted that the experts that designed the knowledge base recognize that it is more
efficient to focus on reducing the likelihood of an event happening (e.g. better controls) than increasing training.
OR In
dica
tor
Probability Impact on the Process
(IoP)
Impacto on the Process
(IoP) Expertise OR In dica to r
Impact on the Process (IoP)