International Journal of Emerging Technology and Advanced Engineering
Website: www.ijetae.com (ISSN 2250-2459, ISO 9001:2008 Certified Journal, Volume 4, Issue 6, June 2014)
563
No-Reference Video Quality Assessment
Yogini Kulkarni
1, Charudatta V. Kulkarni
21,2Department of Electronics and Telecommunication, MIT College of Engineering, Pune
Abstract— Methods to assess the visual quality of digital videos as perceived by human observers are becoming important, due to large number of applications that target humans as the end users of video. In this paper a no-reference video quality assessment (VQA) algorithm is introduced. Characteristics of human visual system (HVS) is taken into considerations. The quality of video is calculated in compressed domain considering three factors of compression process; quantization factor, motion factor and bit allocation factor. The algorithm is tested on LIVE Video Quality Database. The results are compared with previous existing methods.
Keywords—Video quality assessment, no-reference, H.264/AVC, subjective quality assessment, objective quality assessment
I. INTRODUCTION
Digital videos are increasingly finding their way into the day-to-day lives of people via the explosion of video applications such as digital television, digital cinema, Internet videos, video teleconferencing, video-sharing services such as Youtube, Video On Demand (VoD), home videos, and so on. Digital videos typically pass through several processing stages before they reach the end user of the video. Most often, this end user is a human observer. In order to transmit videos over narrow band network it is necessary to reduce the size of original video. Digital videos pass through several processing stages before they reach the end user of the video. Different compression techniques like MPEG-2, MPEG-4, H.263, H.264 are used to reduce the bandwidth required and also the storage capacity. One of the effects of processing of video is degradation of video quality due to distortion. Since human observers at the receiver side are sensitive to the video quality, for many applications, such as video conferences and broadcasting, it is important to have a good estimate of the quality of the material being received. Methods for evaluating video quality play a critical role in quality monitoring to maintain Quality of Service (QoS) requirements.
Subjective VQA deals with methods that utilize human subjects to perform the task of assessing visual quality. Subjective VQA is impractical for most applications due to the human involvement in the process.
The Mean Opinion Score(MOS) is calculated as sum of their scores which is measure of subjective quality assessment. Video quality is affected by viewing conditions such as ambient illumination, display device, viewing distance and so on and subjective studies have to be conducted in a carefully controlled environment. Hence it is a cumbersome process.
Objective VQA algorithms eliminate human involvement and automatically predict the visual quality of an input video. Objective quality metrics can be classified into the following three categories: Full-reference (FR) metrics require the original videos as reference, reduce-reference (RR) metrics rely on partial information related to the original signal, and no-reference (NR) metrics that assess quality score only using the data receive at the terminals. NR metrics show better applicability where the original video is not present like the real time applications.
The major drawback of the FR approach is that it requires a large amount of reference information at the final comparison point. RR metrics may be less accurate than the FR metrics, but they are also less complex, and make real-time implementations more affordable. Need for the reference video or even limited information about it becomes a serious hindrance in many real-time applications. It is essential to develop NR video quality metrics that blindly estimate the quality of a video.
The goal of each no-reference approach is to create an estimator that would predict the Mean Opinion Score (MOS) of human observers, without using original data. There are various developments done in order to obtain a NR metric that will show better applicability. Many metrics considered the most common artifacts that are observed in videos such as blockiness, blur or ringing. Some metrics used for image quality assessment can also be used for video quality assessment. But these metrics are useful for measuring quality of single frames. However, in case of video there exists temporal changes which are equally important to estimate the video quality and the influence of various distortions.
II. RELATED WORK
International Journal of Emerging Technology and Advanced Engineering
Website: www.ijetae.com (ISSN 2250-2459, ISO 9001:2008 Certified Journal, Volume 4, Issue 6, June 2014)
564
A new method for objective VQA from coding parameters of an H.264/AVC bitstream as a hybrid/bitstream category focuses on the influence of quantization and de-blocking process, but neglects the distortion caused by other factors. Another NR quality metric utilizes intra 4x4 block mode parameter to predict the spatial variance. Intra 4x4 block mode is not presented in all bitstreams. Also quantized Discrete Cosine Transform (DCT) coefficients extracted from bitstreams were used to calculated the peak signal-to-noise ratio(PSNR) of video. PSNR is not a reliable VQA tool, and the operation of DCT coefficients would increase the computation complexity. The additional measures were introduced that took into account two motion intensity measures i.e. global motion intensity, calculated from the global motion field, and object motion intensity, calculated by subtracting the global motion from the motion vectors . A NR quality metric to measure the networked video, the value of average bit rate per pixel is used to predict the spatial and temporal complexity. But this value varies wildly with the change of the encoder and its algorithm, which could not reflect the spatial and temporal characteristics of video precisely.The paper is divided into following sections. Section III presents H.264/AVC compression. In Section IV presents the compressed domain metric in detail, while section V presents the experimental results, and the conclusions are given in the last section.
III. H.264/AVCCOMPRESSION
The video compression process involves applying an algorithm to the source video to create a compressed file that is ready for transmission or storage. To play the compressed file, an inverse algorithm is applied to produce a video that shows virtually the same content as the original source video. The statistical analysis of video signals indicates that there is a strong correlation both between successive picture frames and within the picture elements themselves. The conventional approach to video coding removes redundancies that exist within individual images of each video frame and also between successive frames. Different video compression standards utilize different methods of reducing data, and hence, results differ in bit rate, quality and latency.
The main objective of the H. 264 standard is to provide a means to achieve substantially higher video quality compared to what could be achieved using any of the existing video coding standards. H.264 consists of following stages:
1)Dividing each video frame into blocks of pixels so that processing of the video frame can be conducted at the block level
2)Exploiting the spatial redundancies that exist within the video frame by coding some of the original blocks through transform, quantization and entropy coding (or variable-length coding)
3)Exploiting the temporal dependencies that exist between blocks in successive frames, so that only changes between successive frames need to be encoded. This is accomplished by using motion estimation and compensation
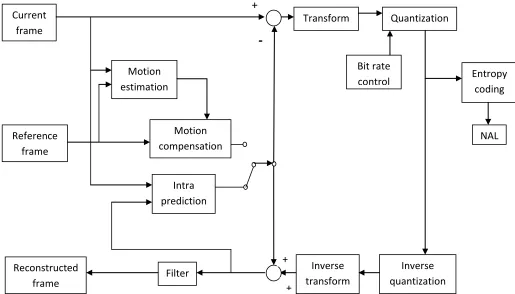
H.264 takes video compression technology to a new level. H.264/AVC represents a number of advances in standard video coding technology, in terms of both coding efficiency enhancement and flexibility for effective use over a broad variety of network types and application domains. With H.264, a new and advanced intra prediction scheme is introduced for encoding I-frames. This scheme can greatly reduce the bit size of an I-frame and maintain a high quality by enabling the successive prediction of smaller blocks of pixels within each macroblock in a frame. This is done by trying to find matching pixels among the earlier encoded pixels that border a new 4x4 pixel block to be intra-coded. By reusing pixel values that have already been encoded, the bit size can be drastically reduced. A general framework of H.264/AVC video compression algorithm is shown in Fig.1.
IV. THE COMPRESSED DOMAIN VIDEO QUALITY METRIC
International Journal of Emerging Technology and Advanced Engineering
Website: www.ijetae.com (ISSN 2250-2459, ISO 9001:2008 Certified Journal, Volume 4, Issue 6, June 2014)
[image:3.612.51.566.142.436.2]565
Fig. 1. General framework of H.264/AVC video compression algorithm
A.Quantization parameter factor
As Quantization parameter(QP) increases, the degradation of video increases. Fig. 2 illustrates the experiment results of comparing the relationship between Difference Mean Opinion Scores (DMOS) and QP. Numerical values of DMOS reflect the relative subjective quality score which has a range between [0, 100], where “0” and “100” represent the best and the worst of the subjective quality respectively. The videos with intense motion suffer from more severe distortions. Typical human visual system (HVS) based VAQ methods analyze the spatial and temporal complexity separately, and the results are being used in objective quality assessment.
Compression actually happens during the quantization process. The quantization parameter is used for determining the quantization of transform coefficients. The parameter can take 52 values. The arrangement of values is such that an increase of 1 in quantization parameter means an increase of quantization step size by approximately 12%. Quantization step is directly related to the compression ratio. The QP factor (FQ) reflects the influence
of QP on video quality. It can be calculated as:
( ) ( )
Where, qp is the average QP of n frames and a, b and c are constant parameters that are obtained from experiments. Cn is chracteristics of successive n frames.
( )
Where Bn is the consumption of n frames, w and h
represent the width and height of picture, and qp is the average QP used in n frames.
B. Motion factor
Motion is one of the most important types of information contained in natural video. It plays a very important role in human perception of moving image sequences. While video signals do suffer from spatial distortions, they are often degraded by severe temporal artifacts such as ghosting, motion compensation mismatch, jitter, smearing, mosquito noise. It is very sensitive to motion information.
Inverse
quantization
Entropy
coding
NAL
x
Quantization
Inverse
transform
Transform
Bit rate
control
Motion
estimation
Current
frame
Reference
frame
Reconstructed
frame
Intra
prediction
Motion
compensation
Filter
+
-
+
International Journal of Emerging Technology and Advanced Engineering
Website: www.ijetae.com (ISSN 2250-2459, ISO 9001:2008 Certified Journal, Volume 4, Issue 6, June 2014)
566
Conventional video quality metric examines mismatches between original and distorted video pixel by pixel, and estimates the artifacts caused by motion distortion such as blockiness, blur, and mosaic. But this method is not feasible in the compressed domain. Based on the heavy researches of HVS, neurons respond best to a stimulus moving in a particular direction[5]. To reflect the influence of the motion factor to the video quality the global motion consistency (MCg) and local motion (MCl) consistency areestimated. The calculation of MCg and MCl is carried out in
P frame only. MCg reflects the consistency of motion
objects.
Every motion object has a unique direction of movement at a particular time. MCl reflects the consistency inside the
motion objects. The MBs belonging to the same motion object usually have approximately the same motion attributes. MCl is calculated based on the absolute
difference of MV between adjacent MBs. The calculation of MV’s absolute difference is carried out in both the horizontal and the vertical direction.
The motion factor is given as the sum of DH and DV.
( )
C.Bit allocation factor
It is hoped that moving regions including the behavior information have a little visual degradation during the compression process. HVS is less sensitive to the loss of high frequency information than that of low frequency information. This phenomenon inspires the idea of Region of Interest (ROI) based video coding method in transform domain. Hence, ROI based video coding technique is highly expected in video communication and video surveillance applications. Many ROI based bit allocation algorithms have also been employed in video compression applications. There are researches carried out on the topic of bit rate control scheme(RC) which aims to achieve best video quality with limited bitstream[6]. It is necessary to consider the influence of bit allocation into consideration when applying VQA. The calculation of credibility of RC focuses on inter MBs which have large consumption of bitstream.
( )
Where, is credibility of RC and is larger variance
of bit consumption of each MB. The judgement of perceptual quality is a continuous process due to the characteristics of HVS, the information that lies in the successive frames, should be taken into account.
The final objective video quality metric is given as:
( ( ) ( ) ( ) ) ( )
Where ( )is the integrated value of FQ in N frames,
( )is the average of FM of P frames in N frames, and
( ) is the average of FB of N frames. α, β, and γ are
constant parameters which can be determined through experiments. ε and θ are utilized to confine Qc to a nominal
range of [0, 100]. “0” and “100” represent the best and the worst objective quality respectively.
V. EXPERIMENTAL RESULTS
LIVE Video Quality Database consists of 10 raw naturalistic reference videos and 150 distorted videos obtained from the references using four real world distortion types. DMOS is obtained for each compressed video by employing thirty non-expert viewers[7].
The compressed domain metric is applied to all of forty H.264/AVC videos in LIVE Video Quality Database[9]. The objective scores are obtained and compared with the subjective scores. The obtained objective score is also compared with the results of following algorithms:
Peak Signal-to-Noise Ratio (PSNR) is a simple function of the Mean Squared Error (MSE) between the reference and test videos
Structural SIMilarity (SSIM) is a popular method for quality assessment of still images that was extended to video. The SSIM index was applied frame-by-frame on the luminance component of the video and the overall SSIM index for the video was computed as the average of the frame level quality scores
The performance of the algorithm is measured using the Spearman Rank Order Correlation Coefficient (SROCC) which measures the monotonicity of the VQA algorithm prediction against human scores and the Pearson Linear Correlation Coefficient (LCC). The values of SROCC and LCC range from 0 to 1.
Table 1 Experiment Values
Prediction model SROCC LCC
PSNR 0.4585 0.5492
SSIM 0.6514 0.6646
International Journal of Emerging Technology and Advanced Engineering
Website: www.ijetae.com (ISSN 2250-2459, ISO 9001:2008 Certified Journal, Volume 4, Issue 6, June 2014)
567
VI. CONCLUSION
The NR VQA algorithm is designed aiming to solve the problem of objective video quality assessment in the terminals of various video related applications. The impact of the three factors is used to measure the quality. The experimental results show that in comparison to the other leading VQA algorithms, this metric gives higher accuracy, and less computation cost. This algorithm can be used for practical applications.
REFERENCES
[1] Xiangyu Lin, Hanjie Ma, Lei Luo and Yaowu Chen, "No-Reference Video Quality Assessment in Compresssed Domain," IEEE Transactions on Consumer Electronics, Vol. 58, No. 2, May 2012 [2] Dubravko Culibrk, Vladimir Zlokolica, Dragan Kukolj, “Salient
Motion Features for Video Quality Assessment ,” IEEE Transactions on Image Processing , Vol. 20, No. 4, April 2011
[3] ThomasWiegand, Gary J. Sullivan, Gisle Bjontegaard, and Ajay Luthra, "Overview of the H.264/AVC Video Coding Standard," IEEE Transactions on Circuits and Systems for Video Technology, Vol. 13, No. 7, July 2003
[4] Taeyoung Na and Munchurl Kim, "A Novel No-Reference PSNR Estimation Method with regard to De-blocking Filtering Effect in H.264/AVC Bitstreams," IEEE Transactions on Circuits and Systems for Video Technology, 2013
[5] Wang, “Objective Image/Video Quality Measurement-A Literature Survey ,” 1998
[6] Kalpana Seshadrinathan, "Motion Tuned Spatio-Temporal Quality Assessment of Natural Videos," IEEE Transactions on Image Processing, Vol. 19, No. 2, February 2010
[7] Kalpana Seshadrinathan, "Study of Subjective and Objective Quality Assessment of Video," IEEE Transactions on Image Processing, Vol. 19, No. 6, June 2010
[8] Rafael C. Gonzalez, Richard E. Woods, Digital Image Processing, Third Edition Pearson 2011
[9] LIVE Video Quality Database,