[email protected] www.eforenergy.org ISSN nº
WP 04/2010
The Economics of New Nuclear
Power Plants in Liberalized
Electricity Markets
Pedro Linares
Adela Conchado
- 1 -
The economics of new nuclear power plants in
liberalized electricity markets
*Pedro Linares
†, Adela Conchado
U. Pontificia Comillas
February 25, 2011
Abstract
The nuclear debate is strong in many countries, with the discussion of its economics being a significant part of it. However, most of the estimates are based on a levelized-cost methodology, which presents several shortcomings, particularly when applied to liberalized electricity markets. Our paper provides results based on a different methodology, by which we determine the breakeven investment cost for nuclear to be competitive with other electricity generation technologies. Our results show that the cost competitiveness of nuclear is not clear, and that several uncertainties may prevent the revival expected by some.
Keywords: nuclear power, economics, liberalized electricity markets
JEL Codes: Q41, Q47, L94
1
Introduction
There has been lately much talk about the possible “renaissance” of nuclear power, according to both popular (e.g. Crumley, 2009) and academic sources. Nuttall and
* We are grateful to William Nuttall and Jean-Marc Moulinier for their comments on earlier
drafts. Research assistance by Nathalie Ormazabal and Cesar Vispo is also gratefully acknowledged. All views expressed here, as well as any errors, are the sole responsibility of the authors.
Also, Financial support from the Spanish Ministry of Science and Innovation (ECO2009-14586-C02-01) is acknowledged.
† Instituto de Investigación Tecnológica, Universidad Pontificia Comillas, Alberto Aguilera
23, 28015 Madrid, Spain; and MR-CBG, Harvard Kennedy School. E-mail: [email protected]
- 2 -
Taylor (2009) took as the first signs for this renaissance the high prices being paid for existing nuclear power plants – including the high prices paid recently by EDF for British Energy nuclear assets (Thomas, 2009). Although of course these signs should probably be interpreted just as an evidence of the profitability of already-existing, largely written-off, low-operating-cost nuclear plants in deregulated electricity markets, the fact that more than 40 nuclear power plants are currently being built across the world, and the change in attitude towards nuclear in some countries (Nuttall, 2009) makes it worthwhile to look also at the prospects for construction of new nuclear plants in Europe and the US. In Western Europe, two nuclear power plants are being built by AREVA. In the US, Sioshansi (2008) has argued that the recent filings of formal applications for new nuclear reactors, or the orders for components for them, are indicators of serious intention to build. Steven Chu, the US Secretary of Energy, also declared recently that “I think nuclear power is going to be a very important factor in getting us to a low carbon future”. Some simulation models also show bright prospects for nuclear. Recent European Commission studies (EC, 2007) show for example that nuclear will go from 380 GW in 2005 (340 GW in developed countries) to 1,100 – 2,000 GW in 2050 (580-800 GW in developed countries).
This possible renaissance for nuclear is fueled basically by two arguments: one, its relatively low carbon emissions (although this has been challenged by Storm, 2008); and second, its higher security of supply and lower price volatility compared to fossil fuel alternatives. These have been joined recently by an additional one, cost. Although cost has usually been considered to be one of the four problems of nuclear, together with safety, proliferation, and waste (e.g. MIT, 2003), some studies recently put nuclear as a competitive alternative for electricity generation (e.g. EC, 2008; IEA, 2008), particularly when introducing a price for carbon emissions (Joskow and Parsons, 2009). This has prompted some to formulate the nuclear debate as a trade-off question: either we have nuclear, or we must pay more for our electricity.
We find this discussion about costs very relevant for energy policies worldwide: if nuclear energy is required for achieving a low carbon future, or for having more stable electricity prices, we should ascertain whether this will take place spontaneously, that is, if firms will invest in new nuclear plants just out of its cost
- 3 -
competitiveness; or if we rather need some support from the government – and, in this case, if this support is justified or not.
Therefore, a careful analysis of the cost of new nuclear power plants, and of its comparison with other electricity generation alternatives seems more than warranted. However, most of the studies looking at the costs of nuclear power do so by using a levelized-cost methodology, which in turn depends critically on assumptions of investment cost, and is also of limited application for deregulated markets (which are currently the standard in Europe and also in many states in the US).
The objective of this paper is to try to contribute to a better understanding of the cost competitiveness of new nuclear power plants in liberalized electricity markets, by using an improved methodology to undertake the analysis. Our results can be read in two ways: from a private perspective, if nuclear power is competitive in a purely monetary basis; and also, if it is deemed appropriate due to other reasons, if it will require economic support for private companies to invest. Section 2 presents a review of some of the current studies and discusses their shortcomings. Section 3 describes the methodology and data used in the paper, and Section 4 shows the results obtained. Finally, Section 5 offers some conclusions and recommendations. We would like to make clear before going on that we acknowledge that a nuclear policy should not only take into account economic costs: all advantages and disadvantages of nuclear should also be considered to make a final decision: whether to allow new investments or forbid them, whether to penalize nuclear or support it. In order to do that a full cost-benefit analysis or at least a quantification of the externalities to be considered should be carried out – see Kennedy (2007), or EC (2005) as examples of this approach. However, we believe that the discussion of monetary costs is rich enough as to focus just on it in this paper.
2
Assessing the costs of nuclear power
As mentioned before, most of the studies looking at the cost of new nuclear power plants are based on a levelized-cost (LEC) methodology. Koomey and Hultman (2007) offer a fine example of this approach, as well as a review of previous studies. Rothwell (2004) also discusses the fundamentals of the costs of nuclear. The most relevant and updated study may be the update of the MIT report “The future of
- 4 -
nuclear” (Du and Parsons, 2009). Other up-to-date study worth citing is Cooper (2009). This methodology has become very popular, since it provides a single indicator of the competitiveness of the different electricity generation technologies. However, it also has several shortcomings, particularly for liberalized markets, which we discuss below.
First, it is critically dependent on the assumption of investment cost. Of total costs for nuclear electricity, approximately 70% come from investment cost (20% from O&M costs, and 10% from fuel). However, as Joskow and Parsons (2009) correctly point out, the lack of reliable contemporary data for the actual construction costs of real nuclear plants make very uncertain any estimate of future construction – and therefore electricity generation – costs. Indeed, some of the studies pointing to cost competitiveness for nuclear were based on the MIT (2003) figure of $1,500/kW, which was not a real construction cost but just a target to be attained. Therefore, it would be better to use a method which does not require assuming an investment cost ex-ante.
Another critical assumption in LEC studies is the hours of operation for the different technologies. Since investment costs are distributed among all operating hours to calculate the final cost of generating electricity, the more hours a plant is assumed to operate, the cheaper it will be. However, the hours a plant operates also depend on its cost, and therefore this becomes endogenous to the problem. Although this is not a critical issue for nuclear – since nuclear plants usually provide baseload power, and therefore run continuously –, it is for marginal units such as gas combined cycles or coal power plants.
Other endogeneity issue is the correlation between fuel prices, carbon prices, and electricity prices – more salient in liberalized markets. The competitiveness of power plants will depend not only on their costs, but also on their income. And this income will be basically the electricity market price, which is in turn determined by the cost of the marginal unit. Since these are usually gas or coal power plants, the price will be determined by gas, coal, and carbon allowance prices. Again, this affects differently baseload technologies – nuclear – and marginal technologies – coal or gas.
- 5 -
These two latter problems are further complicated by the general inability of LEC methodologies to account for different electricity load levels (and therefore different prices and operating hours).
We also mentioned before that the LEC methodology is not well suited for liberalized electricity markets. First, in these markets cost recovery is not guaranteed, and new, cheaper technologies may easily displace existing investments before the end of their expected lifetime (Linares, 2001), therefore reducing their cost competitiveness. Second, the LEC methodology does not handle well the risks underlying liberalized electricity markets. Real options approaches have been developed (Rothwell, 2006; Roques et al, 2006) to address, at least partially, these concerns. Unfortunately, these methods also suffer from similar shortcomings regarding assumptions of costs and operating hours.
Finally, LEC studies only take into account costs, but not the volume of new investment in an electricity market: other constraints coming from energy policy (renewable energy promotion, for example), the shape of the load curve (with no requirements for new baseload power) or the extension of the license of existing power plants – as seems to be the case in the US (Joskow and Parsons, 2009) – may do not allow for new investments in nuclear plants.
Therefore, we believe that the analysis of the cost competitiveness of new nuclear power plants would be improved by using a different methodology such as the one presented in this paper. This method assesses the cost competitiveness of new nuclear power plants by inquiring whether there would be any spontaneous (that is, based on cost competitiveness alone) investments in the electricity system studied, and which should be the investment cost required to allow for these investments to take place.
To do that, we simulate the behavior of the electricity market in the long term, with a generation-expansion model (Linares et al, 2008a). We leave the investment cost for nuclear as a decision variable, and iterate until we find the breakeven investment cost, that is, the investment costs that makes it profitable to build new nuclear.
- 6 -
This allows us to solve most of the problems related to LEC: we do not have to assume ex-ante any investment cost for nuclear or operating hours for all technologies, since these are outputs of the model; we account not only for costs, but also for income, since the price of the electricity market is endogenously determined by the model – even considering the effect of market power, since the model allows for simulating oligopolistic behavior; we simulate the evolution of liberalized electricity markets, by allowing for new technologies to retire earlier investments even if they have not been recovered; and we take into account other possible constraints of the system, such as renewable energy promotion, or demand growth. In addition, we are able to compare all the possible electricity-generation technologies simultaneously in an easier way.
3
An application to the Spanish electricity market
We have applied the method presented above to the Spanish electricity system, since we consider it is a good representative of liberalized European and US power markets and therefore some of our results may be easily extrapolated to them. The 2008 Spanish electricity mix is basically 10-15% hydro (depending on rainfall), 20% nuclear, 15% coal (both imported and domestic, the latter including black and brown lignite), and 30% combined cycles. Renewables (not including hydro) contribute with 15% of the total demand, and are expected to grow up to 40%. The market is a rather concentrated one, with two large firms covering a large part of the generation market and only four more small firms with some generation capacity, which cover the rest of the market. More information about the Spanish electricity system and its expected evolution may be found in Linares et al (2008b). In addition, we believe that this type of study is very relevant for Spain, in which a very strong debate is being held about the future role of nuclear in the electricity mix. Although the government recently denied the extension of the operating license for the oldest nuclear power plant in Spain, this does not necessarily mean that the debate has been closed.- 7 -
3.1
Basic assumptions
We will assess the competitiveness of the construction of new nuclear power plants in the next ten years (2008-2018)‡. We have chosen ten years as the relevant period to be assessed because it is short term for construction purposes, and therefore we can safely assume that the technology will be very much the same as the current one, and also to remove much of the long-term uncertainties.
We do not include dismantling or waste management costs – except for the current fees being charged for low- and medium-level waste management. At the discount rates used (see below), costs such as these, which take place 40 years or more in the future are not relevant.
We also do not consider inflation. Therefore, all our costs are real 2007 euros. We believe the impact of inflation should not be very relevant, since it should affect similarly all technologies (capacity constraints aside, see below). Indeed, the only relevant impact might come from the difference in construction duration between the different technologies, particularly concerning nuclear. However, we try to deal with this by using overnight costs as our reference investment cost for nuclear. We agree with Koomey and Hultman (2007) in that installed costs give a more acceptable picture of actual capital costs than do the overnight costs by incorporating capital costs and inflation. However, most of the real costs quoted in industry and other studies are overnight costs, so this is the unit we will use for our assessment.
As for the investment and operation costs for the alternative technologies: the relevant ones are the investment cost for gas combined cycles and for coal power plants, together with the cost of operating coal power plants. As will be explained below, the price of gas will be a variable parameter, and the cost of renewables is not relevant for this analysis because their contribution will be set as a quota – that is, we will not compare nuclear and renewables on a cost basis, although separate analysis show that wind will be competitive with nuclear under most of the scenarios.
‡ This requires us to simulate more years, to cover the economic lifetime of the power plants. We have
- 8 -
We have assumed an investment cost for gas combined cycles of 635 €/kW, following Du and Parsons (2009) and also consistent with EC (2008). The investment cost for coal power plants is 1,725 €/kW, and the price of coal is set at 2.6 US$/MMBtu, also from Du and Parsons (2009). The efficiency of a combined cycle has been set at 50%, and that of a coal power plant at 38%. We have assumed 2 years for building a gas combined-cycle, and 2 years – possibly a bit optimistic, here we follow again Du and Parsons(2009) – for a coal power plant.
A relevant issue here is carbon capture and sequestration. We have not included this technology in the analysis basically because it is not expected to become commercial in the following ten years (the scope in which we have looked for new nuclear investments). In addition, at the carbon prices considered (see below), it would not become competitive (Al-Juaied and Whitmore, 2009)
Finally, some caveats, and their consequences on results: we take fuel prices as fixed (although they will probably be volatile, which would be positive for nuclear), we do not consider intermittency in renewable energy production (this makes nuclear more competitive than under an intermittency assumption, since nuclear cannot follow well the changes in renewable energy production) , and we do not account for financial issues. We are also not taking into account other economic issues outside the scope of the model, such as the possible capacity constraints (human and manufacturing infrastructure) due to an increased demand for nuclear power plants, which in turn might result in higher costs (Joskow and Parsons, 2009). Although of course incorporating all these issues would certainly improve the validity of our results, we think that they should not change much the overall picture, at least in the short term.
3.2
Uncertain parameters
Of course, we would not attempt to carry out an analysis of the competitiveness of nuclear under a single scenario. There are many uncertainties surrounding the economics of nuclear (Rothwell, 2004; Nuttall and Taylor, 2009) and here we have selected the ones which we consider more relevant: the growth of demand, the development of renewable energy – which will basically result in a lower demand for conventional sources –, the discount rate (or hurdle rate) for the investment, the price of natural gas, the price of carbon allowances, the construction duration of
- 9 -
nuclear, and the availability of nuclear power plants. For all them, we have selected a baseline figure, and a reasonable range. In this sense, we have tried to follow the recommendations from Koomey and Hultman (2007), in that assumptions that deviate significantly from historical experience need careful justification.
3.2.1 Annual demand growth
We assume as our baseline figure a 1% annual demand growth. This is quite low compared to the recent figures for Spain (around 4% for the last years). However, the recent recession has resulted in a change in this trend, and in fact energy officials and utilities do not expect to return to 2007 levels until at least 2020. Therefore, choosing 1% as the average annual growth for the entire period considered seems like a reasonable assumption, moreover given the emphasis given by the current government to energy conservation programs.
The lower value for the range has been set a 0.5% as a conservative estimation, whereas the higher value has been set at 2% (which again seems reasonable given the long term implied).
3.2.2 Contribution of renewables
Given that in most electricity markets in Europe renewables do not enter the market based on cost, but based on public support, and that this support is usually determined based on a volume quota – although it may sometimes be instrumented through a subsidy –, we have formulated the scenarios for the contribution of renewables as targets for the specific technologies, as proposed by the Spanish government. These targets are 42,000 MW for onshore wind, 3,000 MW for offshore wind, 5,300 MW for solar thermal, 8,000 for solar PV, 3,200 for biomass, and 5,500 MW for small hydro. These targets have been set for 2020-2030, so there is a possibility that they will be enlarged in the future. We have accounted for that by assuming a possible increase of 25% of these targets. We also consider the possibility of the targets not being met (quite possibly for biomass and solar thermal, but also for the rest if the subsidy is not high enough), and therefore we also analyze a 25% decrease in these targets.
- 10 -
3.2.3 Discount rate
This is possibly one of the most critical parameters of this type of analysis. Given the large weight of investment costs for nuclear, the rate at which these costs are written off will determine to a large extent the competitiveness of this technology. Here the most relevant question is whether the discount rate for nuclear has to be different from that of gas or coal.
Under a merchant power plant model, such as the one followed in Du and Parsons (2009), it seems reasonable to allocate a risk premium for nuclear. Both the large contribution of investment costs and the risks for delays and cost overruns, together with the variation in market prices, are reasons enough for this. Indeed, Roques et al (2006) calculate a risk premium between 3 and 5.2% for merchant plants. It could be argued that investing in nuclear reduces a company’s overall exposure to fossil fuel and gas prices. However, the higher correlation between gas, carbon allowance, and electricity prices reduces the intrinsic riskiness of these investments to a lower level than nuclear plants (Roques et al, 2006).
But it is not clear whether the merchant model would be viable in a liberalized environment. As has been shown by the recent bids in the UK, utilities seem to be thinking about financing investments from their own balance sheet. Although that severely limits the number of investments to be undertaken – since only the more powerful players have enough financial muscle and expertise to do it –, it seems that this is currently the only realistic alternative, and therefore it is the one we will consider. We acknowledge of course that this improves the competitiveness of nuclear power plants in our analysis, and that should be taken into account in the results.
Therefore, we will use a reasonable weighted average cost of capital (WACC) measure as the hurdle rate. Our baseline assumption is a WACC of 9%, with a range between 6 and 12%. This is pretty consistent with the references in the literature (Du and Parsons, 2009; Cooper, 2009).
3.2.4 Price of natural gas
Natural gas prices are probably the most volatile of the parameters considered. Their linking to oil prices – although it seems that this is becoming less so,
- 11 -
moreover with the advent of shale gas – make them follow a very spiky trend and therefore it is difficult to agree on a reasonable range. Currently, prices seem to be stable around 7 $/MMBtu, which were also the average prices before the oil price crisis. Therefore, we have chosen that figure as our baseline assumption. The lowest bound is set at 4 $/MMBtu, and the highest one at 14 $/MMBtu, taken from historic records. However, and in order to account for the expectations of much higher oil prices in the future, we have also considered an “extreme” scenario of 20 $/MMBtu.
3.2.5 Price of carbon allowances
Carbon allowance prices are also very variable in nature, and in addition, this variability comes from regulatory decisions (the targets for carbon emissions reductions). This makes them quite difficult to predict, so again, we have relied in those values most used in the literature. The baseline value has been set at 18.75 €/tCO2 (equivalent to 25$), with the lower and higher ends set at 10 and 40 €/tCO2. The lower and mid values are consistent with the prices observed at the EU ETS, with the higher value trying to represent the expected price for 2020-2030. These seem reasonable estimates for the time frame considered (2008-2050). But again, we should not exclude higher allowance prices in the future, if climate negotiations are successful and more stringent targets are set. Therefore, we also consider an “extreme” scenario of 100 €/tCO2.
3.2.6 Construction duration
The baseline scenario assumes 6 years for the construction of a nuclear power plant, from the start of the licensing period – when the first costs are incurred – to the start of the operation phase. This number has been taken from Du and Parsons (2009), and is considered too low by Koomey and Hultman (2007), who cite 9 years as the median duration for the US nuclear fleet. However, as cited in this latter paper, “construction duration in the historical sample was influenced by a complex set of interrelated factors, including rapid regulatory changes (both before and after the Three Mile Island accident), quality control problems in construction, increased reactor size, reduced electricity demand growth, and utility financial constraints”. This, together with the recent efforts to streamline the licensing procedure, would make it reasonable to assume a certain reduction of construction times, as we do here. In fact, the IAEA database shows that construction times
- 12 -
since 1991 range from 4 to 8 years, with a median of 5.2, as cited in Roques et al (2006)
However, we also include a more pessimistic scenario of 9 years to assess its impact on the results, and because of the historic risk of delays – also shown more recently in the Olkiluoto power plant. On the optimistic side, we assume 5 years as the construction duration.
3.2.7 Availability of nuclear power plants
The availability of nuclear power plants has improved very much recently, partly because of the incentives of a liberalized electricity market (Zhang, 2007). Recent figures for the US are around 90%, compared to 71% in 1992. Spanish nuclear power plants also feature availabilities higher than 90%. However, as Joskow and Parsons (2009) correctly point out, it is the lifetime capacity factor which should be used, since new plants must recover their investment over their economic lifetime. Only Finland has a lifetime capacity factor higher than 90% for its nuclear fleet. The lifetime factor for the US is 78%, and the global capacity factor in the last decade is 82%. Therefore, it seems reasonable to use a baseline figure of 85%, within a range of 80-90%, as a lifetime capacity factor for new nuclear power plants.
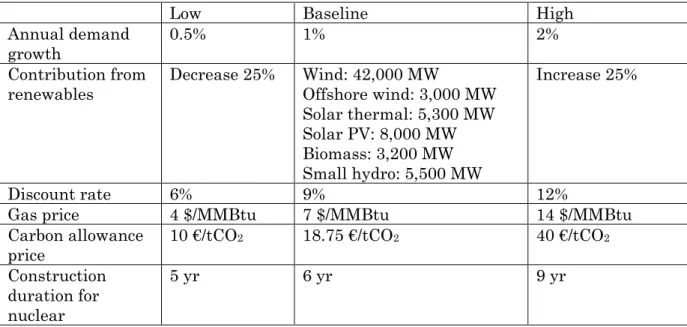
A summary of all the values considered for the uncertain parameters is presented in Table 1.
Table 1. Values for the uncertain parameters
Low Baseline High
Annual demand
growth 0.5% 1% 2%
Contribution from
renewables Decrease 25% Wind: 42,000 MW Offshore wind: 3,000 MW Solar thermal: 5,300 MW Solar PV: 8,000 MW Biomass: 3,200 MW Small hydro: 5,500 MW Increase 25% Discount rate 6% 9% 12%
Gas price 4 $/MMBtu 7 $/MMBtu 14 $/MMBtu Carbon allowance price 10 €/tCO 2 18.75 €/tCO2 40 €/tCO2 Construction duration for nuclear 5 yr 6 yr 9 yr
- 13 - Availability of
nuclear 80% 85% 90%
Source: Own elaboration
3.3
Breakeven cost for nuclear
Once we have determined all the parameters for our model, we proceed to run it. As explained before, we run the generation-expansion model iteratively until we find the breakeven investment cost for new nuclear, that is, the maximum investment cost that will allow for investing in this technology in a profitable way. We remind here that the model used simulates the behavior of the electricity market by maximizing the profit of firms subject to the operation constraints of the system. More details about the model in Linares et al (2008a).
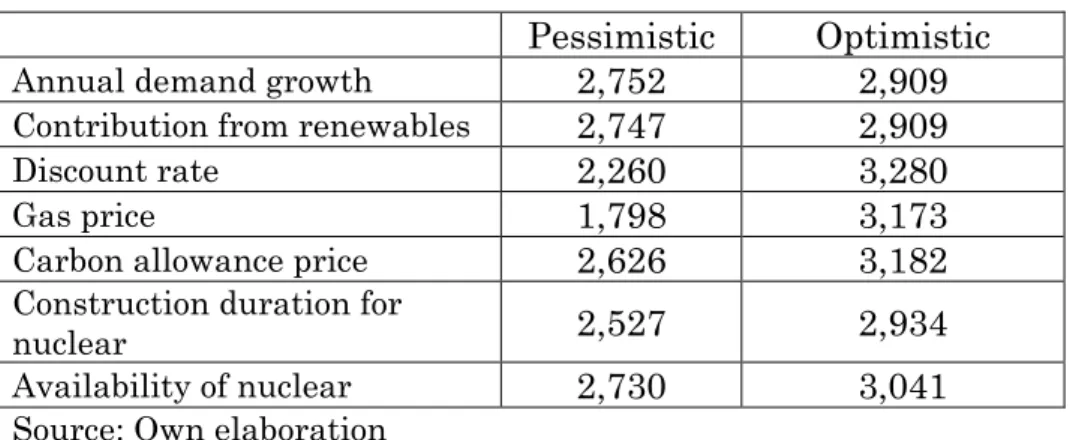
For the baseline scenario (the mid values in the ranges of variable parameters), the breakeven overnight cost that should be attained by new nuclear plants is 2,880 €/kW. For the rest of scenarios considered the breakeven overnight cost is presented in Table 2. We present the results for the optimistic and pessimistic values (from the nuclear point of view).
Table 2. Breakeven overnight costs for new nuclear (€/kW)
Pessimistic
Optimistic
Annual demand growth
2,752
2,909
Contribution from renewables
2,747
2,909
Discount rate
2,260
3,280
Gas price
1,798
3,173
Carbon allowance price
2,626
3,182
Construction duration for
nuclear
2,527
2,934
Availability of nuclear
2,730
3,041
Source: Own elaboration
As may be seen, nuclear becomes more competitive, expectedly, when: - Demand increases, or renewable energy targets are reduced - The discount rate is lower
- Carbon prices are higher - Gas prices are higher
- 14 - - Nuclear plants availability increases - Construction duration is reduced.
It may also be observed that the most critical parameters are the discount rate, the gas and carbon price, and also the construction duration. Demand growth and the contribution from renewables show a moderate influence in the breakeven cost. We have also considered interesting to run two extreme scenarios (those in which both the pessimistic and optimistic values are combined, respectively) to have a worst- and best-case estimation of the overnight cost to be attained by new nuclear power plants. Under the worst-case scenario, the overnight cost should be lower than 1,170 €/kW. Under the most favorable one, the overnight cost should be lower than 3,700 €/kW.
We also ran an extreme “climate” scenario, in which carbon prices reach 100 €/tCO2, and gas prices reach 20 $/MMBtu. The rest of parameters remain at their baseline values. Here the breakeven overnight cost is 3,800 €/kW.
3.4
Comparison with current overnight costs
Our final calculation then should be to compare the breakeven overnight costs obtained with the current overnight costs as declared by the industry. Here we rely on the exhaustive work carried out by Du and Parsons (2009), who put on comparable terms the most recent cost filings in the US, Japan and South Korea. These are shown in Tables 3 and 4. Costs have been translated from US$ to euro using a 0.7 rate.
Table 3. Overnight costs for recent nuclear power plants in Japan and S.Korea (2004-2008)
Type of reactor
Capacity (MW)
Date
Overnight cost
(
€
/kW)
ABWR
1.325
2004
2069
BWR
1.067
2005
2513
ABWR
1.304
2006
1768
OPR
995
2004
2518
OPR
994
2005
2207
Source: Du and Parsons (2009)
- 15 -
Type of reactor
Capacity (MW)
Date
Overnight cost
(
€
/kW)
ABWR
1.371
N/A
2198
ESBWR
3.040
2018-2020
2648
AP1000
2.212
2016-2017
3155
AP1000
2.234
2016-2019
2840
AP1000
2.200
2016-2017
3559
Source: Du and Parsons (2009)
These costs are also in line with those estimated by the European Commission (EC, 2008) at 2,680 €/kW, and from EPRI (2008) at 2,786 €/kW.
As may be observed, the breakeven overnight cost obtained in our analysis (2,880 €/kW for the mid estimate) is just in the average of the costs proposed for new nuclear power plants in the US, and also a bit higher than the European Commission estimate. That would mean that, if the parameters considered remain at their set values (particularly the most critical parameters described before), and most importantly, if there are no cost overruns, nuclear would be competitive on a purely economic basis, although at a very tight margin. In fact, if we use as a reference the $4,000 figure employed by Du and Parsons, then the margin would disappear and become negative.
When more optimistic scenarios are considered (basically, higher gas and carbon prices), then nuclear would prove to be competitive (3,100 – 3,800 €/kW compared to 2,800 €/kW), again if there are no cost overruns. However, there is also the possibility of finding less optimistic scenarios: if gas prices are not high enough (one possibility is the large supply of shale gas), carbon prices are not high enough (because of loose carbon targets, or competitiveness concerns), interest rates are higher (either global, or due to a risk premium for nuclear), or there are significant delays in construction times (as experienced before), then, even without cost overruns, nuclear would not be competitive, sometimes by a large margin.
Our results are clearly more pessimistic towards nuclear that those of the European Commission (EC, 2008) and the IAE (2008). They are also more pessimistic than the MIT (2009) study: we find that nuclear is just barely competitive under the no risk-premium, carbon allowance price scenario, whereas the MIT study for that scenario finds that nuclear is clearly more competitive than gas and coal (6.6 cents/kWh for nuclear, 7.3 cents/kWh for gas). This is even more
- 16 -
interesting when we learn that the average capacity factor in our model for combined cycles is about 50%, compared to the 85% assumed in the MIT study. Since the initial parameters used are basically the same as in the MIT study, we believe that this difference comes from the change in the methodology, which in turn should solve some of the shortcomings of the LEC methodology (see Section 2).
4
Conclusions
A first conclusion of our analysis is similar to the conclusion of Joskow and Parsons (2009), in that the cost competitiveness of nuclear energy in liberalized markets is not clear: under the baseline scenario, results are very tight or even negative, depending on the reference used for current investment costs. And then, there are several uncertainties surrounding them.
The first of these uncertainties is the possibility of a cost overrun. In that sense, some argue that the nuclear industry has an observed tendency to forecast overconfidence (Koomey and Hultman, 2007). Data shown by MIT (2003) point to significant historic overruns of up to 300%. And our results show that just a 10% overrun would make nuclear not competitive. Even in the most favorable scenario, the cost overrun should be lower than 35%. Looking at the past history of nuclear would then result in concluding that nuclear will probably not be competitive on a purely economic basis. Therefore, cost will not be a plus for nuclear, but will still be one of its problems. To put it in other words, the possible trade-off between more nuclear and higher electricity prices implied in the nuclear debate would not be such.
There are also other significant uncertainties. As mentioned before, the more critical are: construction duration, gas prices, carbon prices, and interest rates (including risk premiums for nuclear). Therefore, the final decision will have to be based on risk analysis, with many of the parameters difficult to fit in a probability distribution. This will probably require an analysis of the robustness of the decisions under an uncertain environment (as in Linares, 2002), which is outside the scope of this paper.
An important issue is that these uncertainties affect differently public and private decisions: because of the reasons mentioned before (Roques et al, 2006), higher gas and carbon prices do not result in increased chances for nuclear in liberalized
- 17 -
markets, whereas the other uncertainties are likely to be resolved negatively for nuclear Therefore, it seems unlikely to expect a spontaneous decision by utilities in liberalized markets to invest in new nuclear power plants, unless either the nuclear industry itself, or the government, step in to change the current situation and reduce the uncertainties involved.
The nuclear industry might have a role in two directions: reducing the cost of nuclear investments; and reducing the risks of cost overruns and construction delays – by standardizing design and projects, better project management, good financial and risk planning, or modular construction. In that latter direction, many risk-hedging instruments are already available: PPA contracts, O&M contracts, turnkey contracts, insurance, or financial instruments.
Governments might also want to support nuclear: although private companies are not concerned about high gas or carbon prices, price volatility, or dependence on fossil fuels, governments may be so. In addition, some of the risks of nuclear may be socially diversifiable, thus constituting a market failure to be corrected. In that case, a result from our study is that probably the most effective way to support nuclear is by reducing risks. The current US policy on loan guarantees for nuclear is a good example of this, although it has only been designed for a limited number of plants. Instruments to promote diversity in the energy mix would also probably help nuclear (Nuttall and Taylor, 2009).
Another important role for governments is the streamlining of licensing procedures. Navarro (2008) found evidence that a streamlined licensing process, and standardized reactor designs reduced construction duration and construction costs in Japan compared to the US.
However, it is not clear whether governments would be interested in pursuing this route. First, even from the social point of view, the cost competitiveness of nuclear is not clear. And second, if finally the development of nuclear requires some degree of economic support, then a higher level question comes forward: given the scarcity of public funds, which technology should be supported, and to what level? Because we are also supporting renewable energy, and energy conservation. Here the discussion would have to move then to a cost-benefit analysis of all three options.
- 18 -
And it is not clear that nuclear would be the winner, especially compared to conservation. But that remains for another paper.
References
Al-Juaied, M., A. Whitmore (2009). Realistic costs of carbon capture. Belfer Center Discussion Paper 2009-08.
Cooper, M. (2009). The economics of nuclear reactors: Renaissance or relapse?. Institute for Energy and the Environment. Vermont Law School.
Crumley, B. (2009). Areva’s field of dreams. TIME Magazine, August 5th.
Du, Y., J.E. Parsons (2009). Update on the cost of nuclear power. CEEPR Working Paper 09-004.
EC (2007). Global climate policy scenarios for 2030 and beyond. Joint Research Centre, European Commission.
EC (2008). Energy sources, production costs and performance of technologies for power generation, heating and transport. Commission staff working document accompanying the Communication from the commission to the European Parliament, the Council, the European Economic and Social Committee and the Committee of the Regions Second Strategic Energy Review: An EU energy security and solidarity action plan. {COM(2008) 744}.
EPRI (2008). Program on Technology Innovation: Integrated Generation Technology Options. Technical Update, November 2008
IEA (2008). Energy Technology Perspectives 2008. International Energy Agency, Paris.
Joskow, P.L. (2006). The Future of Nuclear Power in the United States: Economic and Regulatory Challenges. Working Paper 06-25 AEI-Brookings Joint Center for Regulatory Studies.
- 19 -
Kennedy, D. (2007). New nuclear power generation in the UK: Cost benefit analysis. Energy Policy 35: 3701–3716
Koomey, J. and Hultman, N.E. (2007). A reactor-level analysis of busbar costs for US nuclear plants, 1970–2005. Energy Policy 35 (2007) 5630–5642.
Linares, P., S. Isoard (2001). Effects of energy markets de/reregulation onto EU’s technology portfolio: conventional and emerging technologies. Report EUR 19829 EN. European Communities.
Linares, P. (2002). Multiple Criteria Decision Making and Risk Analysis as Risk Management Tools for Power Systems Planning. IEEE Transactions on Power Systems, 17: 895- 900.
Linares, P., F.J. Santos, M. Ventosa, L. Lapiedra (2008a). Incorporating oligopoly, CO2 emissions trading and green certificates into a power generation expansion model. Automatica, 44: 1608- 1620.
Linares, P., F.J. Santos, I.J. Pérez Arriaga (2008b). Scenarios for the evolution of the Spanish electricity sector: Is it on the righ path towards sustainability? Energy Policy 36 (2008) 4057– 4068
MIT (2003). The Future of Nuclear Power.
MIT (2009). Update of the MIT 2003 Future of Nuclear Power.
Nuttall, W.J. (2009). Nuclear Energy in the Enlarged European Union. EPRG Working Paper 0904. U. of Cambridge Electricity Policy Group.
Nuttall, W.J., S. Taylor (2009). Financing the nuclear renaissance. European Review of Energy Markets 3 (2): 187-202.
Roques, F.A., Nuttall, W.J., Newbery, D.M., de Neufville, R., Connors, R. (2006). Nuclear Power:A Hedge against Uncertain Gas and Carbon Prices?. The Energy Journal 27 (4): 1-24.
- 20 -
Rothwell, G. (2006). A Real Options Approach to Evaluating New Nuclear Power Plants. The Energy Journal 27 (1): 37-54.
Sioshansi, F.P. (2008). Nuke revival: When it rains, it pours. The Electricity Journal 21: 3-8.
Storm, J.W. (2008). Nuclear power – the energy balance. www.stormsmith.nl. Thomas, S. (2009). Areva and EDF: Business prospects and risks in nuclear energy. Report commissioned by Greenpeace International. March 2009.
Zhang, F. (2007). Does Electricity Restructuring Work? Evidence From The U.S. Nuclear Energy Industry. The Journal of Industrial Economics 55: 397-418.