University of Rhode Island University of Rhode Island
DigitalCommons@URI
DigitalCommons@URI
Open Access Dissertations
2017
Smart Grid Security Against Massive Blackouts
Smart Grid Security Against Massive Blackouts
Jun Yan
University of Rhode Island, [email protected]
Follow this and additional works at: https://digitalcommons.uri.edu/oa_diss
Recommended Citation Recommended Citation
Yan, Jun, "Smart Grid Security Against Massive Blackouts" (2017). Open Access Dissertations. Paper 608. https://digitalcommons.uri.edu/oa_diss/608
This Dissertation is brought to you for free and open access by DigitalCommons@URI. It has been accepted for inclusion in Open Access Dissertations by an authorized administrator of DigitalCommons@URI. For more
SMART GRID SECURITY AGAINST MASSIVE BLACKOUTS BY
JUN YAN
A DISSERTATION SUBMITTED IN PARTIAL FULFILLMENT OF THE REQUIREMENTS FOR THE DEGREE OF
DOCTOR OF PHILOSOPHY IN
ELECTRICAL ENGINEERING
UNIVERSITY OF RHODE ISLAND 2017
DOCTOR OF PHILOSOPHY DISSERTATION OF
JUN YAN
APPROVED:
Dissertation Committee:
Major Professor Haibo He
Yan Sun Pete August Nasser H. Zawia
DEAN OF THE GRADUATE SCHOOL
UNIVERSITY OF RHODE ISLAND 2017
ABSTRACT
The security of the smart grid is a grand challenge across cyber and physical do-mains. As an emerging critical infrastructure that integrates information and commu-nication technologies (ICT) into power and energy systems (PES) with improved ef-ficiency, reliability, and sustainability, the smart grid encompasses a transcontinental network of interdependent and interoperating cyber-physical systems (CPS) through the computerization, interconnection, and communication of systems and devices. Across the closely interwoven cyber-physical spaces, the vulnerability and exposure of critical systems and processes have been on the rise: malicious attackers may penetrate through access points in the cyberspace and exploit vulnerabilities in the physical systems, pos-ing major threats to disrupt the delivery of electricity through massive cascadpos-ing black-outs. Risks and impacts of such attacks have been demonstrated by intensive research efforts as well as real-world incidences recently, drawing increasing concerns from the government, the industry, and the public.
This dissertation will investigate the cyber-physical security of smart grid against potential massive blackouts. The work is composed of three synergistic tasks: 1) un-derstand the mechanisms behind major cascading blackouts; 2) identify critical attack vectors that could initiate the cascading process; 3) develop effective strategies to en-hance the resilience of the grid. The dissertation will first assess operational and struc-tural vulnerabilities in massive cascading blackouts through steady state and complex network models, respectively. It will then examine malicious attacks that exploit the vulnerabilities through compromised control and measurements, where advanced ma-chine learning algorithms are employed to identify critical attack vectors that would trigger massive cascades. Simulations results on IEEE standard benchmarks are evalu-ated and revealed the impact of sophisticevalu-ated attacks. The dissertation aims to facilitate our awareness and preparedness toward an attack-resilient smart grid of the future.
ACKNOWLEDGMENTS
During this journey, I have received unimaginable support from numerous individ-uals and organizations. Dr. Haibo He, has been a mentor, colleague, and friend with every guidance and support that I could ask for. I have also benefited immensely from my doctoral committee members, Dr. Yan (Lindsay) Sun, Dr. Pete August, Dr. Lisa DiPippo, and Dr. Tao Wei, whose invaluable time and advice have helped me made it through. I would also like to thank Dr. Sigrid Berka, for her support from the IEP program that allows me to start this incredible journey.
I have enjoyed six wonderful years in the Computational Intelligence and Self-Adaptive System (CISA) laboratory, thanks to an exceptional group of fellow col-leagues. Thank you, Zhen, Bo, Jing, Xiangnan, for your feedback, friendliness, and fun that make this journey brilliant and memorable. I am so grateful to have worked with and learned tremendously from so many outstanding scholars and colleagues around the globe at the CISA lab.
I would also like to give special thanks to my great colleague, roommate, and friend, Yufei Tang. I believe our mutual support and friendship will last long, long into the future.
This journey would not be possible without the unbreakable love and support from my parents, Weihua Song and Haoning Yan. And I could not be more blessed to have the company of my wife, Yingying Zhang, for her incredible wisdom, enthusiastic endeavor, and unconditional love are beyond compare.
The research has been supported by the National Science Foundation (NSF) under Grants CNS 1117314, ECCS 1053717, and CMMI 1526835, and by the Army Research Office (ARO) under Grant W911NF-12-1-0378.
TABLE OF CONTENTS
ABSTRACT . . . ii
ACKNOWLEDGMENTS . . . iii
TABLE OF CONTENTS . . . iv
LIST OF FIGURES . . . ix
LIST OF TABLES . . . xii
CHAPTER 1 Introduction to Cyber-Physical Security of Smart Grid . . . 1
1.1 Overview of the Smart Grid . . . 1
1.1.1 The Existing Electrical Power Infrastructure . . . 1
1.1.2 The Emerging Smart Grid . . . 3
1.2 Cyber-Physical Security of the Smart Grid . . . 5
1.2.1 Physical Security of the Smart Grid . . . 6
1.2.2 Cybersecurity of the Smart Grid . . . 8
1.2.3 Threats of Massive Blackouts . . . 9
1.3 Significance and Organization . . . 11
1.3.1 Significance of the Research . . . 11
1.3.2 Organization of the Dissertation . . . 13
2 Operational Vulnerability Assessment of Massive Blackouts. . . 17
2.1 Chapter Overview . . . 17
Page
2.2.1 Cascading Failure Simulators (CFSs) . . . 18
2.2.2 The DC Power Flow based CFS . . . 20
2.2.3 Assessment Metric . . . 27
2.3 Vulnerability Assessment with DC-CFS . . . 28
2.3.1 Simulation Setup . . . 28 2.3.2 Vulnerability Assessment . . . 29 2.4 Comparative Studies . . . 33 2.4.1 Case Study . . . 34 2.4.2 Critical Moments . . . 37 2.5 Chapter Summary . . . 43
3 Structural Vulnerability Assessment of Massive Blackouts. . . 46
3.1 Chapter Overview . . . 46
3.2 Structural Vulnerability Assessment Based on Complex Networks . 47 3.2.1 Complex Network Analysis for the Smart Grid . . . 47
3.2.2 Power Transfer Distribution Factor (PTDF) . . . 49
3.2.3 Extended Betweenness . . . 50
3.2.4 Extended Betweenness Based CFS (EB-CFS) . . . 52
3.2.5 Assessment Metrics . . . 56
3.3 Simulations and Results . . . 56
3.3.1 Simulation Setup . . . 56
3.3.2 Pre-cascading Analysis . . . 58
3.3.3 Cascading Failure Analysis . . . 58
Page
4 Multi-Contingency Analysis of Concurrent Attacks with
Self-Organizing Maps. . . 70
4.1 Chapter Overview . . . 70
4.2 Concurrent Attack in Smart Grids . . . 72
4.2.1 Concurrent Attack Schemes . . . 72
4.2.2 Risks of Massive Blackouts under Concurrent Attacks . . . 72
4.3 Self-Organizing Map-Based Multi-Contingency Analysis . . . 75
4.3.1 Self-Organizing Maps (SOM) . . . 75
4.3.2 Multi-Contingency Analysis with SOM . . . 78
4.4 Simulation and Performance . . . 82
4.4.1 Simulation Setup . . . 82
4.4.2 Attack Performance . . . 83
4.4.3 Comparative Studies . . . 85
4.4.4 Discussions . . . 88
4.5 Chapter Summary . . . 92
5 Multi-Contingency Analysis of Sequential Attacks with Q-Learning . 94 5.1 Chapter Overview . . . 94
5.2 Sequential Attack Analysis with Q-Learning . . . 96
5.2.1 Sequential Attacks in Smart Grid . . . 96
5.2.2 The Q-learning Algorithm . . . 98
5.2.3 Q-Learning for Sequential Attack Vectors . . . 101
5.3 Simulations and Results . . . 104
Page
5.3.2 Attack Performance . . . 107
5.3.3 Disucssions . . . 112
5.4 Chapter Summary . . . 113
6 Resilience And Detection Against False Measurement Attacks . . . . 115
6.1 Chapter Overview . . . 115
6.2 False Data Injection Attacks . . . 116
6.2.1 Power System State Estimation . . . 117
6.2.2 Bad Data Detection . . . 118
6.2.3 False Data Injection Attack . . . 119
6.3 Grid Resilience under FDI Attacks . . . 121
6.4 Detecting FDI Attacks with Supervised Learning . . . 124
6.4.1 Classifiers for FDI Detection . . . 124
6.4.2 Attack Strength in FDI Detection . . . 129
6.4.3 Performance Metrics . . . 129 6.5 Simulations . . . 130 6.5.1 Simulation Setup . . . 130 6.5.2 Resilience Analysis . . . 133 6.5.3 Detection Performance . . . 135 6.6 Chapter Summary . . . 137 7 Conclusions. . . 141
7.1 Summary of the Dissertation . . . 141
7.2 Challenges and Opportunities . . . 144
Page
7.2.2 Imperfect Attacks . . . 146
7.2.3 Attack-Resilience . . . 148
LIST OF REFERENCES . . . 150
LIST OF FIGURES
Figure Page
1 The electrical power infrastructure in the United States. . . 2
2 Cyber-physical architecture of the smart grid. . . 4
3 The population affected by major blackouts since 1999. . . 10
4 Cyber-physical attacks targeting the transmission grid. . . 11
5 Overall structure of the dissertation. . . 13
6 Flowchart of DC-CFS . . . 22
7 Blackout size distribution in the IEEE 39-bus system. . . 29
8 Decomposition of blackout sizes from single-bus and single-branch contingencies. . . 30
9 Number of affected load buses after (a) bus and (b) single-branch contingencies, respectively. . . 32
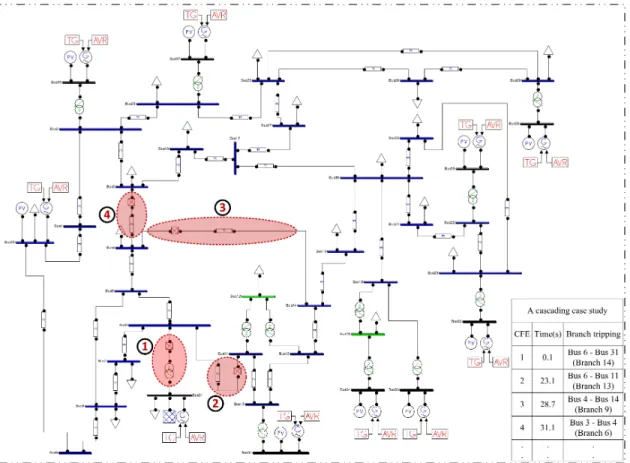
10 Cascading failures after Branch 13 in the IEEE 39-bus system is tripped. Branches affected in the cascading failure are numbered and highlighted. . . 34
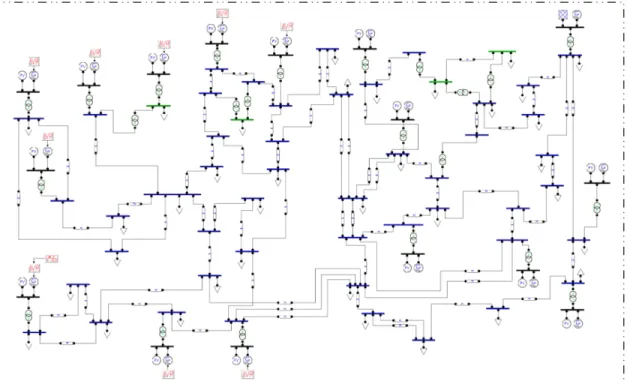
11 The IEEE 68-bus system in PSAT. . . 35
12 Transmission line load rate distribution (a) before cascading; (b) after Branch 13 is tripped; (c) after Branch 9 is tripped. . . 36
13 The (a) rotor angles and (b) bus voltages after the initial tripping. . 38
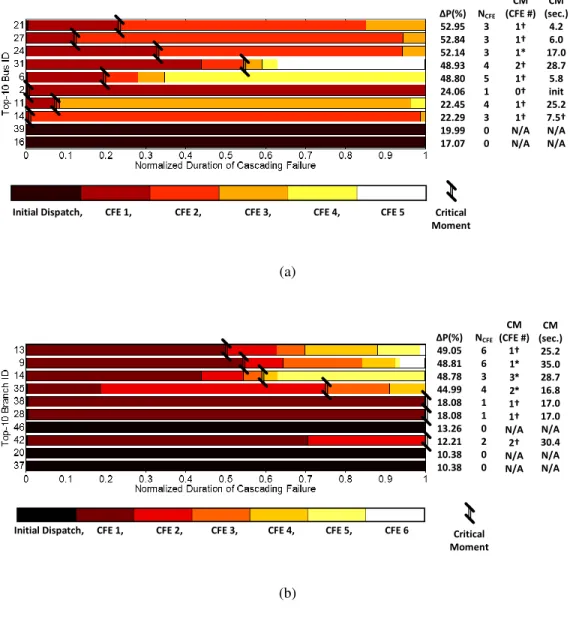
14 Critical moments in the top-10 (a) single-bus and (b) single-branch contingencies in the 39-bus system. . . 41
15 ∆EB of the most critical single-bus contingency in IEEE 118-Bus system according to (a) DC-PTDF and (b) AC-PTDF model. . . 61
16 ∆EB of the most vulnerable branches under (a) DC-PTDF and (b)
AC-PTDF models, respectively. The most vulnerable branch IDs
Figure Page
17 Potential attacks on the status/analog data in the smart grid. . . 71
18 Illustration of a cascading tree following an attack. . . 80
19 Texas grid shown in (a) ArcMap 10.0 and (b) normalized substation
coordinates. . . 82
20 Performance of the most effective SOM-based 4-victim attack
schemes . . . 84
21 Performance of the most effective SOM-based 9-victim attack
schemes . . . 85
22 Comparing the most vulnerable set with two initialization methods:
(a) 4-victim attack and (b) 9-victim attack. . . 87
23 Comparing SOM and K-means: the most vulnerable set in (a)
4-node attack and (b) 9-4-node attack. . . 88
24 Clusters of (a) SOM and (b) K-means approach corresponding to
the most vulnerable set in 4-node attack. . . 90
25 The intermediate states in cascading blackouts of electrical power
grid. . . 96
26 Flowchart of reinforcement learning process. . . 99
27 The flowchart of Q-learning based vulnerability analysis for
sequen-tial attacks. . . 102
28 (a) IEEE 5-bus test system and (b) IEEE RTS-79 test system. . . 105
29 Results from the IEEE 5-bus system: (a) the Q(s, a)values of
ac-tions taken in each attack; (b) the number of line outages after each
attack. . . 108
30 Results of the IEEE RTS-79 system: (a) the Q(s, a) values of the
chosen action for each attack in the sequence and (b) the number of line outages after each attack. . . 110
31 Results from the IEEE 300-bus system: (a) theQ(s, a)values of the
chosen action for each attack in the sequence and (b) the number of line outages after each attack. . . 111
Figure Page
32 The number of attacks taken to achieve the objective blackout size
(dashed line) for the IEEE 5-bus, RTS-79, and 300-bus systems. The numbers reduced by the Q-learning exhibited the effectiveness of Q-learning in identifying more vulnerable attack sequences. . . . 112
33 Flowchart of false data injection assessment. The dashed line
indi-cates data flow. . . 130
34 The IEEE 30-bus test system. . . 131
35 Effectiveness of FDI attacks with (a) fixed ρ = 1.0 and (b) fixed
α = 0.05. . . 134
36 Grid resilience with different (a) magnitudes of FDI atρ= 1.0, and
(b) severeness of FDI atα = 0.05. . . 136
37 Detection accuracy on balanced data: (a)α = 0.1, (b)α= 1.0, and
(c)α= 10.0in direct FDI attacks; (d)α= 0.1, (e)α= 1.0, and (f)
α = 10.0in stealth FDI attacks. . . 138
38 F1 score on imbalanced data: (a) α = 0.1, (b) α = 1.0, and (c)
α = 10.0in direct FDI attacks; (d) α = 0.1, (e) α = 1.0, and (f)
α = 10.0in stealth FDI attacks. . . 140
39 Example of interdependent sectors vulnerable to cyber-physical
LIST OF TABLES
Table Page
1 Critical Moments of Top-10 Contingencies in the 68-Bus System. . 43
2 Extended Betweenness based Cascading Failure Simulator . . . 55
3 The capacity of all 179 branches in IEEE 118-bus Benchmark . . . 57
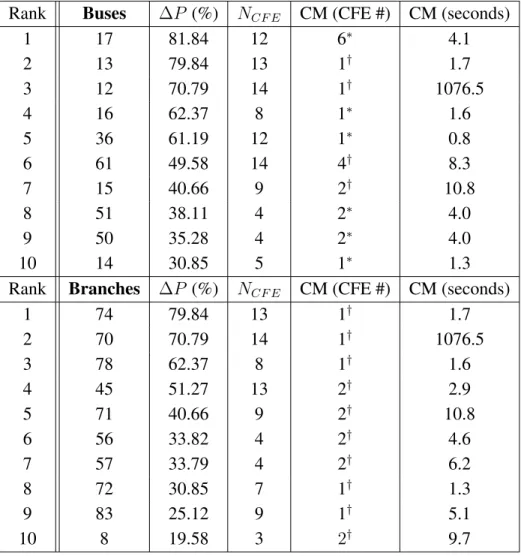
4 Number of cascade-initiating contingencies under different tolerances. 59 5 The most vulnerable buses inN −1contingencies . . . 60
6 The most vulnerable branches inN −1contingencies . . . 63
7 Average run-time of EB-CFS for single-contingencies. . . 67
8 Validation results of the EB-CFS . . . 68
9 Load- and SOM-based 4-bus attack schemes . . . 85
10 Load- and SOM-based 9-bus attack schemes . . . 89
11 Pseudo Code of Q-learning Based Multi-Contingency Analysis . . 103
12 Benchmark system information . . . 106
13 Number of Line Outages from Sequential Attacks on the IEEE 5-bus System Increased by Q-learning . . . 107
CHAPTER 1
Introduction to Cyber-Physical Security of Smart Grid
1.1 Overview of the Smart Grid
1.1.1 The Existing Electrical Power Infrastructure
Electricity is one of the substantial foundations of the modern life. Playing an expanding critical role in maintaining the functioning of our society and sustaining its prosperity, the electrical power infrastructure has gradually evolved over the last cen-tury into a transcontinental network of interconnected and interacting systems. Shown in Figure 1, the cyber-physical power grid in North American has become one of the largest systems humans have ever built [1] and arguably one of the most complex and challenging to operate.
According to the National Institute of Standards and Technologies (NIST), the monolithic electrical power infrastructure can be categorized into seven domains: gen-eration, transmission, distribution, opgen-eration, electricity markets, service providers, and customers [2]. In a traditional model of physical power systems, power plants generate the electricity from various resources, and the electricity is delivered to the customers via the transmission and distribution networks, where substations and transmission/power lines constitute the major components in such networks. Regional power grids have been constructed, operated, and networked geographically in the major interconnections that ensure the delivery of electricity for customers across the continent.
On top of this physical systems, a cyber infrastructure for the monitoring, control, and communication of the grid has been established, mostly on proprietary facilities, to maintain and regulate power grid operations. Control centers host energy manage-ment systems (EMS) that monitor and control the grid through the supervisory control and data acquisition (SCADA) system. The SCADA is composed of master and re-mote terminal units, i.e., MTUs and RTUs, which are located at the control center and
field substations, respectively. The MTUs and RTUs exchange control commands and sensory measurements through an array of communication networks to maintain and op-erate the grid. The sensory measurements, primarily consisting of raw data of voltage, current, and frequency in the field, are collected by deployed sensors, pre-processed and aggregated at the RTUs, and transmitted to MTUs. The information is further processed in control rooms and visualized through the human-machine interface (HMI), based on which control commands are determined and issued. The MTUs then send down the commands to the RTUs, which execute the code to operate actuators and adjust dynam-ics of the system. In this process, regional grids, predominantly owned and operated by local utility providers, are supervised and coordinated by regional transmission or-ganizations (RTO) and independent system operators (ISO). The hierarchical collective efforts ensure overall system reliability, social utility, and economic benefits through the production, delivery, and consumption of electricity.
1.1.2 The Emerging Smart Grid
Since the millennium, increasing challenges as well as innovative solutions in both the physical and the cyber spaces have been transforming the electrical power
infras-tructure into a new generation known as thesmart grid [3, 4, 5]. Evolving along with
the emerging challenges and advancements, the smart grid stands out as an advanced infrastructure to supply electrical power with significantly increased efficiency, reliabil-ity, and sustainability. One of the key innovations therein is the incorporation of modern information and communication technologies (ICT) to computerize and network the ex-isting power systems. This incorporation, or integration, allows better accommodation of a combination of latest changes and challenges across generation supply, transmission operation, demand variation, energy storage, renewable energies, distributed resources, and market deregulation, among others. Consequently, the critical electrical power in-frastructure has become a cyber-physically integrated network of systems, as illustrated in Figure 2 [6].
From the power engineering perspective, the physical power grids are undergoing radical transformations. On the generation side, the growing integration of renewable energies (RES) brings one of the most significant improvements of the sustainability and economics of electrical power generation. According to the U.S. Energy Information Administration [7], the percentage of renewable energies has grown from to 8.5% in 2007 to 14.9% in 2016 over the last decade. This growth, contributed by installation and operation of utility-scale renewable generations like wind farms, solar photovoltaic, and solar thermal plants, is projected to continue in the years to come thanks to efforts in states like New York, Texas, and California [8].
In the transmission systems, long-distance transmission lines are being planned and installed to deliver electricity from remote generation sites to populated metropoli-tans as well as to increase interchange between different balancing authorities. A 2016
Internet / e-Business Distribution Distribution Substations IED PLC RTU DG ES Transmission Bulk Energy Storage Transmission Substations IED PMU RTU Operation Generation Generation Ops Generation SCADA Service Providers Utility Providers Third-Party Providers CIS Biling WAN FAN/LAN Customers Smart Homes & Buildings ES EV DG Smart Meters NAN HAN Transmission Transmission Ops Transmission SCADA Distribution Distribution Ops Distribution SCADA Electricity Markets ISO/RTO/ Wholesale Market Clearing-house Satellites
AMI: Advanced Metering Infrastructure BSM: Bulk Storage Management CIS: Customer Information System DG: Distributed Generation
DMS: Distributed Management Systems DR: Demand Response
ED: Economic Dispatch
EMS: Energy Management Systems ES: Energy Storage
FAN: Field Area Networks HAN: Home Area Networks IED: Intelligent Electronic Devices ISO: Independent System Operator LAN: Local Area Networks LFC: Load Frequency Control
MDMS: Meter Data Management Systems NAN: Neighbourhood Area Networks OMS: Outage Management Systems
PLC: Programmable Logic Circuits PMU: Phasor Measurement Units RTO: Regional Transmission Organization RTU: Remote Terminal Units
SCADA: Supervisory Control And Data Acquisition UC: Unit Commitment
WAMS: Wide-Area Monitoring Systems WAN: Wide Area Networks
ED LFC UC ... OMS EMS BSM WAMS ... AMI MDMS DMS DR ... Legends Electricity Information Domains Features Generation Generation Substations Generating Units
Figure 2. Cyber-physical architecture of the smart grid.
report from Edison Electric Institute showed a record-breaking investment of at least $41 billion in transmission from 2016 to 2019 [9]. Meanwhile, short-distance and local transmission are also being developed to compensate the loss and cost of long-distance transmission. Advancements in transmission technologies have also been driven by the industry and the government, particularly with the installment of over 1,100 phasor measurement units (PMUs) [10]. The PMUs utilize global positioning system (GPS) to provide high-resolution, accurate, and reliable synchronous measurements of inter-connected transmission systems, a key that paves the way for wide-area monitoring, protection, and control (WAMPAC) systems [11].
On the distribution and customer side, the advanced metering infrastructure (AMI) is been developed and deployed. Millions of smart meters are being installed in the AMI to provide two-way, real-time monitoring and communications with an unprecedented spatial-temporal resolution of the grid. Such granularity promises prosperous benefits to the grid, ranging from peak energy reduction (with demand response) to wide-area real-time situation awareness, outage management, and consumer engagements. Fur-thermore, distributed energy resources (DER) enable customer-side power generation and management with augmented flexibility and reliability, which will reshape the uni-directional power flow into a biuni-directional pattern. Moreover, recent progress in energy storage, electrical vehicles, and other emerging technologies are also transforming vari-ous stages of electricity delivery in physical power grids.
1.2 Cyber-Physical Security of the Smart Grid
The smart grid encompasses complex cyber-physical energy systems hosted in a heterogeneous network of power, energy, control, sensory, computing, and communica-tion. The emerging smart grid incorporates systems of legacy hardware and software, operates under multiple entities and regulations, faces increasing system stress and un-certainty, and attracts parties of malicious intentions. The reality underscores the chal-lenges to the security and resilience of smart grid that have been on the rise within and across physical and cyber domains [12, 6]. On one hand, the intrinsic complexity and dynamics of bulk power systems have complicated the protection against inherent phys-ical vulnerabilities in the grid. On the other, the cyber-integration also requires substan-tial efforts on adapted security designs and upgrades against unforeseen exposure and threats to the electrical power grid.
The electrical power grids are complex networked systems vulnerable to internal and external disturbances, including load stress, equipment failure, misoperation, and natural disasters [13]. In smart grid, increasing RES introduces new non-linearity,
un-certainty, time-variance when the grid embraces their sustainability [14]. The DER shapes new, less predictable patterns in power generation, transmission, and distribu-tion with expectable, significant impacts on grid stability [15]. Furthermore, power lines and substations are mostly deployed in the field with limited surveillance or pro-tection, rendering them vulnerable to physical sabotages as reported in the past few years [16, 17, 18].
The cyber-integration inevitably increases the risk of attacks on critical power sys-tems and processes from the cyberspace [12]. Tremendous threats arise from the cyber-attacker’s ability to launch a range of anonymous, remote, simultaneous, and coordi-nated intrusions. From crimes to terrorism and warfare, the fragility of computer and communication networks has been frequently exploited. As inter-networking of devices and services continue to grow, emerging cyber-physical systems raise grand security concerns. Recent incidences, including Stuxnet on nuclear control systems [19], Black-Energy on power control centers [20], and Botnet on the internet-of-things [21], revealed unforeseen threats that explicitly target the networked physical systems and processes.
Research on the cyber-physical security of the smart grid advances on a multi-disciplinary frontier, converging the physical security of power and energy systems and the cybersecurity of information, control, sensory, and communication systems [22]. The incorporation of knowledge and strengths on physical and cyber security is essential to enhance the security and resilience of smart grid, while neither direction along can secure the critical infrastructure for our modern society.
1.2.1 Physical Security of the Smart Grid
Physical security of power systems focuses on the survivability and reliability of power systems after contingencies. As the core of power system security, the contin-gency analysis (CA) evaluates the power system stability after credible inadvertent con-tingencies to minimize interruptions to the delivery of electricity [13]. CA typically runs
on a selection of operating points and covers events including faults, disturbances, and planned outages of inadvertent nature. Security constraints are established by the CA in subsequent modules of the EMS, e.g., optimal power flow, economic dispatch, and unit commitment, to ensure the stable operation of power grids. Under different mod-eling accuracies and timeframes, steady-state and transient analyses both serve the grid
operators to assure the physical security [23, 24]. In practice, theN −1security, i.e.,
the grid remains in secure operation after the loss of any single components, has been enforced as a standard for major transmission grids across the United States [25].
However, the interconnected power and energy systems have presented challenges to the physical security analysis. Both the complexity and the runtime of CA increase dramatically when the system scales up, rendering it difficult to conduct or implement
N −ksecurity in bulk power systems. The heterogeneity and complexity of hardware,
software, and operations also limit the accurate and timely evaluation of remote contin-gencies whose impact could propagate through a long distance in an instant. Without sufficient wiarea situation awareness and coordination, multiple remedial actions de-termined locally may compete, instead of collaborating, with each other, resulting in degraded conditions and/or cascading failures [26]. Last but not least, while large-scale physical sabotages are rare, they still pose threats to most power facilities and devices not equipped with sufficient surveillance and protection systems [27].
Moreover, the cyber-threats introduces new challenges. Legacy field devices and systems are not designed or equipped with sufficient security features against malignant events from the cyberspace. Concerning about the cyber-exposure of critical informa-tion, access, and process, investigations have revealed vulnerabilities, both unknown and zero-day, in the emerging smart grid. The lack of sufficient protection against co-ordinated cyber-attacks could be catastrophic, as demonstrated by the cyber-attack on a Ukraine regional grid [28]. Meanwhile, intelligent and automated systems, which
have been designed to enhance the system security and reliability, may also be turned into weapons against the smart grid itself. With all these emerging threats, securing the smart grid will require new insights beyond the traditional physical security approaches in power systems.
1.2.2 Cybersecurity of the Smart Grid
Cybersecurity has been widely recognized as a major feature and challenge in the development of smart grid [29]. Utilities have followed the principles of confidentiality, integrity, and availability to install secure public and corporate networks. Firewalls and intrusion detection systems (IDSs) have been deployed to protect control centers and critical field assets against external intrusions. New protocols with security features have also emerged to protect SCADA communications within and among control centers, substations, and user-end devices.
Meanwhile, the smart grid is still far from immunity against cyber-penetrations. Cybersecurity features are often insufficient, obsolete, or absent in legacy power sys-tems, both in control centers as well as field devices. Adoption of existing technologies for the Internet and computer security also needs to proactively accommodate physical properties, requirements, and dependencies of the physical power systems. For instance, multiple log-ins shall not result in denied or delayed access to an operator’s account even after a number of failed attempts: attackers may utilize this mechanism to lock operators out of the control system that can result in disastrous consequences. Moreover, anomaly-based and signature-anomaly-based IDSs also need to adapt to emerging and diversifying patterns in the smart grid to effectively identify traces of malicious behavior from data streams of normal monitoring and control; these real-time data streams will also pose challenges, in terms of both volume and complexity, to the cybersecurity analysis of smart grid. Last but not least, the security mechanisms implemented on physical electronic devices could still suffer from tempering and damages directly, and their dependence on
elec-tricity may also be exploited. As a result, similar to the status of physical security, there is an urgent need to incorporate physical aspects into the cybersecurity of the smart grid. In short, the security and resilience of the smart grid are contingent upon the effec-tive combination of the strength in both physical and cyber security analysis and against both inadvertent and malignant events. Vulnerabilities and contingencies shall be in-vestigated on a broader spectrum. The causes, processes, and consequences across the cyber-physical spaces shall be comprehensively analyzed with consideration of interde-pendence and interoperability therein. Operators of the grid should be aware of the risks both externally and internally, while mitigation and restoration efforts need to be guided by adequate security awareness to avoid secondary damages in the post-attack systems.
1.2.3 Threats of Massive Blackouts
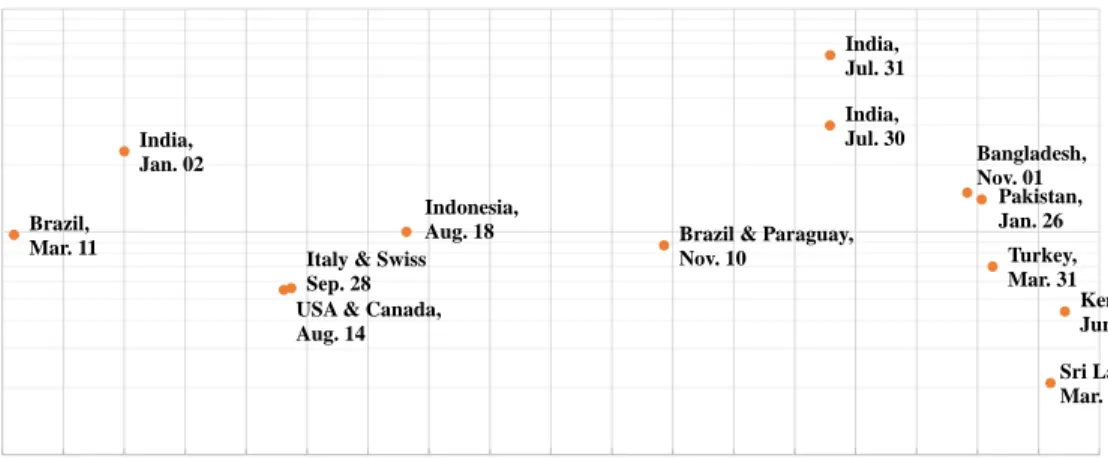
Massive blackouts, i.e., the complete interruption of electrical power delivery, are rare but disastrous events in the power grids. Though uncommonly seen, blackouts can affect a large population and area for an extended amount of time and incur sig-nificant operational, economic, and social disruptions. Illustrated in Figure 3 [30], the population affected by massive blackouts since 1999 unambiguously demonstrated the catastrophic impacts of blackouts in electrical power grids.
Historically, blackouts are consequences of complex disturbances and dynamics. The cascades often start from a small number of contingencies before propagating to a large area through unexpected protection system failures. Initiating events of black-outs range from software bugs (U.S. Northeast, 2003), extreme load stress (India, 2012), physical sabotage (Pakistan, 2015), to cyber-penetration (Ukraine, 2015). While most of these events were not expected to cause major outages during normal operations, unexpected operating conditions, insufficient situation awareness, or malicious outsider
attempts triggered the epidemic process known as the cascading failures. Often due
pro-Brazil, Mar. 11
India, Jan. 02
USA & Canada, Aug. 14
Italy & Swiss Sep. 28
Indonesia,
Aug. 18 Brazil & Paraguay,
Nov. 10 India, Jul. 30 India, Jul. 31 Bangladesh, Nov. 01 Pakistan, Jan. 26 Turkey, Mar. 31 Sri Lanka, Mar. 13 Kenya, Jun. 07 10 100 1000 1999 2000 2001 2002 2003 2004 2005 2006 2007 2008 2009 2010 2011 2012 2013 2014 2015 2016 2017 Popul a ti o n Affected (m il li o n) Year
Figure 3. The population affected by major blackouts since 1999.
tection efforts after the initiating events could result in reduced reliability of the entire grid, leading to overloading lines, insufficient generation supply, or instant load loss. For interconnected power grids, although every effort has been made to ensure the grid security, when some situations are not monitored or responded promptly and properly, what could have been a small-scale outage may turn into a massive cascading blackout within minutes, leaving a large population without power for hours or days unexpect-edly.
Both the frequency and size of blackouts have been increasing in interconnected power grids of the United States [31]. Aware of the impact of as well as the unpre-paredness against potential major blackouts in the future, there have been significant attentions and efforts from the government, industry, and academia to investigate into this challenge. The task force formed by the Institute of Electrical and Electronic Engi-neers (IEEE) have directed extensive studies to discuss, evaluate, and advise the progress towards a cascade-resilient infrastructure [32, 33, 34]. However, understanding of large-scale cascades are far from mature and our solutions are limited by the complexity of the spatial-temporal system behaviors, the availability of history records and analytic tools, as well as the applicability of effective prevention and mitigation strategies [34].
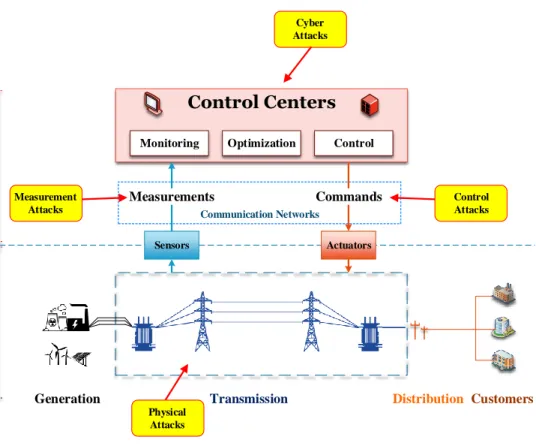
Communication Networks
Control Centers Monitoring Optimization Control
Sensors
Measurements
Actuators
Commands
Generation Transmission Distribution Customers
Control Attacks Measurement Attacks Physical Attacks Cyber Attacks Physical Systems Cyber Systems
Figure 4. Cyber-physical attacks targeting the transmission grid.
1.3 Significance and Organization
1.3.1 Significance of the Research
Securing the smart grid against massive cascading blackouts requires significant research advancement and end-to-end engineering solutions on both physical and cyber security. Although there have been extensive research efforts that investigated the cyber-physical attack threats and defense strategies in the smart grid, the risk and complexity of cascading blackouts remain a major challenge to securing the smart grid to date [6]. To this end, this dissertation has aimed to systematically assess the grid vulnerability under cascading failures from both complex network and power flow perspectives, efficiently identify the critical cascade-initiating components with machine learning approach, and facilitate the understanding of grid resilience under malicious cyber-physical attacks.
with topological approaches [35], some would date back in the early 2000s [36, 37, 38]. While these approaches provide powerful tools developed in the field of computer and network security, to adopt them in the smart grid requires the further inclusion of power system properties and corresponding models. Such incorporation, while intuitive, is not trivial due to the heterogeneity, complexity, and uncertainty of the cyber-physically integrated smart grid [6]. To this end, this dissertation has investigated and proposed complex network based topological and integrative assessment of cascading failure vul-nerability in bulk power grids. The proposed models and metrics effectively identify the system vulnerabilities and critical components in the bulk grids, and the methods have been further extended to both steady-state and transient stability analyses based on more detailed and accurate power flow models [39, 40, 41].
Another challenge to secure the smart grid arises from the scale and dynamics of the interconnected components in the context of cybersecurity. Contingency screening with fast search or heuristic methods have been the effective approaches to identify
crit-ical components in a N −k setting [42, 43, 44, 45, 46, 47, 48]. However, they may
still fall short to include all credible scenarios for all possible target sets in a wide-area interconnected grid. The grid may fail in cyber or physical space as well as the inter-face in-between; the failure can occur concurrently or sequentially at distant locations; the impacts can vary significantly due to the combined effect of operating points, fail-ure locations, timing, and order, among others. These factors result in a large search space for the grid operators to create a profile of credible, critical contingencies that require the most attention and emergency plan. To this end, the dissertation resorts to machine learning, particularly unsupervised and reinforcement learning approaches that have been expanding recently, to develop data-driven, self-adaptive methods that can help grid operators to identify the critical component sets more efficiently and accu-rately. Through adaptive and effective assessment, the proposed research may benefit
the development of advanced real-time monitoring, communication, and control systems for the early detection and prevention of cascading blackouts.
1.3.2 Organization of the Dissertation
The dissertation is organized into 7 chapters with an overall structure illustrated in Figure 5. Following Chapter 1 of introductions, Chapter 2 and Chapter 3 present vul-nerability analyses from operational (Chapter 2) and structural perspectives (Chapter 3), respectively. Based on the proposed cascading failure models and metrics in these two chapters, Chapter 4 to 6 investigates cyber-physical attack schemes on control (Chapter 4 and 5) and measurement (Chapter 6) in the smart grid. The conclusions are drawn in Chapter 7 with discussions on future challenges and opportunities.
Structural Vulnerability Assessment Chapter 3 Operational Vulnerability Assessment Chapter 2
Conclusions, Challenges, and Opportunities
Chapter 7
Multi-Contingency Analysis Against Sequential Attacks
Chapter 5 Multi-Contingency Analysis
Against Concurrent Attacks Chapter 4
Resilience and Detection Against False Data Injection
Chapter 6 Introduction to Cyber-Physical
Security of Smart Grid Chapter 1
Vulnerability Analysis
Cyber-Physical Attacks Overview
Summary And Outlook
Figure 5. Overall structure of the dissertation.
Among the technical contents, Chapter 2 and 3 proposed complex network and power flow based metrics to identify critical components and processes in the
develop-ment of blackouts. The assessdevelop-ments also develop simulation environdevelop-ments to analyze the impact of potential initiating events, based on which further security analysis can look into the potential attack threats. Chapter 4 and 5 presented coordinated multi-target control attacks launched concurrently (Chapter 4) and sequentially (Chapter 5) utilizing machine learning algorithms. Chapter 6 presented cascading failubased re-silience analysis and supervised learning-based detection methods against well-known false data injection attacks on the measurement inputs of power system state estima-tors. Each chapter features an overview, detailed description of problem formulation, proposed methodology, simulation results, and respective summaries. The references are provided at the end of all chapters, followed by the bibliography of the disserta-tion. Collectively, the chapters represent a series of interdependent investigations and publications of the author on the topic of cascading blackouts in the smart grid under malicious attacks.
Specifically, Chapter 2 investigates the effect of overloading and hidden failures in the power grid after the initiating event of relay tripping. A steady-state power flow based model (DC-CFS) is developed to analyze the system behaviors during the cascad-ing process. Based on the model, factors contributcascad-ing to the massive blackouts will be decomposed and analyzed. A novel metric, the critical moment, is proposed to identify critical consistency and discrepancy between steady-state and transient stability analysis in the cascading blackouts. The investigation will reveal how failures propagate in the grid through due to power flow redistribution and provide insights on how to prevent the failure at its early stage.
Chapter 3 proposed a complex network based model (EB-CFS) to analyze the in-herent vulnerability in the structure of power transmission systems. The proposed EB-CFS model, based on the concept of extended betweenness centrality, integrated the topology and property of electrical power grids to effectively identify potential structural
vulnerabilities in the interconnected grid that will lead to a massive blackout. Influence of different loading and overloading situations on cascading failures was also evaluated under different tolerance factors of the system. Simulation results from a standard IEEE 118-bus test system revealed the vulnerability of network components, which was then validated on a DC power flow simulator with comparisons to other topological measure-ments.
Chapter 4 presents the investigation of cyber-physical attacks launched concur-rently on the control commands sent from the control centers to field devices. To address the large search space of potential victims and subsequent computational costs, a self-organizing map based approach was proposed to identify strong attack vectors in the Texas grid with over 5,000 substations. The chapter will introduce how self-organized clusters are formed to identify the combination of vulnerable components in bulk power grids that, when attacked concurrently from the cyberspace, would result in a massive blackout. The proposed approach will assist the grid operator in raising awareness and preparedness against major cyber-intrusions that cause multi-contingencies concurrently in this critical infrastructure.
Chapter 5 presents the investigation into control attacks launched sequentially. Fol-lowing the preliminary work that identifies this new vulnerability of smart grid, the re-search proposed a Q-learning based adaptive re-search strategy to effectively and efficiently identify critical attack sequences that will result in a massive blackout. The Chapter will review the threat of sequential attacks and formulate the search for critical attack se-quence as a reinforcement learning problem. Similar to Chapter 4, the proposed scheme addressed the challenge of a large, complex search space in the context of massive black-outs and will provide information to grid operators for better security enhancement in multi-contingency scenarios.
measure-ment signals. The chapter will first review the prominent threat posed by the recently revealed false data injection attacks on power system state estimator. The DC-CFS is then utilized to examine the grid resilience against this stealth attack that can bypass the traditional bad data detectors. As the simulation results indicated, the grid demon-strated significant robustness as the false data did not pose a major threat in triggering the blackouts. A supervised learning based approach was proposed to detect the stealth false data, in which three light-weight classifiers effectively identified false data from the normal measurements.
Finally, Chapter 7 summarizes the research and discusses future challenges and opportunities along the direction. The problems, methods, and impacts along each phase of investigation in this research will be reviewed along with the contribution of the work. The remaining challenges to further address potential attack threats with effective defense strategies will be discussed in the closing, with which the author hopes to shed some lights on the future endeavors along the way.
CHAPTER 2
Operational Vulnerability Assessment of Massive Blackouts
2.1 Chapter Overview
Being aware of the critical threat of massive blackouts, researchers from the indus-try and academia have collectively developed a large number of assessment approaches and tools to comprehensively understand the mechanisms and factors behind a black-out [32, 33]. These efforts provide the foundation to further analyze potential cyber-physical attack threats and impacts practically present in the smart grid. This research also follows this path to first establish a validated simulation platform for the vulnera-bility assessment and security analysis in the context of cascading blackouts.
Meanwhile, modeling and prediction of massive blackouts still remain a grand chal-lenge due to the complexities and difficulties of diverse grid dynamics, system uncertain-ties, and attack schemes. To approach a solution to this multi-factor, multi-timescale, and multi-system challenge, investigations often decompose the mechanisms and fo-cus on specific aspects of the blackout with corresponding assumptions and simplifica-tions [34, 49]. While investigasimplifica-tions based on different types of models provide respec-tive insights into the cause and process of massive blackouts, they also lead to potential (and frequent) discrepancies, resulting in different precision, conflicting results, as well as distinct requirement of system information and computational resources. However, there are few studies on their discrepancy and consistency in the context of cascading failures. The apparent distinctions in-between can not delineate that to what degree these two methodologies are consistent with each other. While the steady state models are widely used in the cascading failure analysis, this chapter aims at not only investi-gating the physical process revealed by a specific model, but also providing a reference, through illustrative comparative studies, to help determine a more appropriate model for the analysis of power grid cascading failures from case to case.
Given the considerations above, this chapter will investigate both the operational vulnerability of bulk power grids via a time-efficient steady-state cascading failure sim-ulator (CFS) as well as a comparative study of the steady-state model with the transient stability analysis. For the vulnerability assessment, a DC power flow based CFS will be established based on the state-of-the-art. For the discrepancy comparison, a new metric, the critical moment (CM), will be proposed based on the rotor angle stability and volt-age stability principles of power grids to quantitatively analyze the discrepancies. For the dissertation, the validated DC power flow based cascading failure simulator (CFS) will also serve as the platform for topological model validation as well as cyber-physical attack analyses. In addition, this chapter is also expected to narrow the knowledge gap between two well-developed models and to facilitate understanding of cascading failures in power systems.
The rest of this chapter is organized as follows: Section 2.2 describes the power flow based DC-CFS platform for cascading failure analysis. Section 2.3 presents single-contingency assessments of cascading failures simulated with the DC-CFS. Section 2.4 compares the steady-state model with TSA model on two benchmarks, where the new concept critical moment (CM) is proposed to assess the discrepancy between two mod-els as well as the validity of DC-CFS. Finally, Section 2.5 provides a summary of the chapter with some future directions.
2.2 DC-CFS for Cascading Failure Analysis
2.2.1 Cascading Failure Simulators (CFSs)
Simulation models are one of the centerpieces of cascading failure analysis, which aim to integrate physical properties to predict system behaviors and develop correspond-ing solutions. The IEEE PES CAMS Task Force on Understandcorrespond-ing, Prediction, Mitiga-tion and RestoraMitiga-tion of Cascading Failures [34] has reported a variety of simulaMitiga-tion models developed for cascading failure analysis. These models focus on certain sets
of assumptions to approximate the real power system, yet a well-accepted model is still absent due to the complexity of interconnected power grids and cascading failure themselves. Meanwhile, there is limited literature comparing the validity of using dif-ferent power system models to approximate system behavior in cascading failures. This chapter is thus motivated to investigate the discrepancy of two well-established types of cascading failure model, i.e., the DC power flow based steady-state model versus the transient stability model.
The steady-state models have been widely used to approximate power system be-haviors for various purposes. For cascading failure analysis, the stochastic ORNL-PSerc-Alaska (OPA) model [50, 51, 52] is among the earliest and most established models for cascading failure analysis. Comprehensive work on self-organized criti-cality in cascading failures [53, 54, 55] have also been developed using the Manchester model [56, 57] and CASCADE model [58]. In general, the DC power flow based models are powerful for the balance between model complexity and system behavior approx-imation [34, 59], as they utilize the assumptions of power flow equations [60, 61] for efficient cascading failure simulation and assessment. In this chapter, we have imple-mented a well-defined CFS [45] with further modifications and analyses that serve as the baseline cascading failure simulator.
In contrast to the steady-state models, transient stability models have also been built on more accurate yet complex equations [24]. Based on the differential algebraic equa-tions (DAE), they have been widely used in power system control design and served as the primary tool for contingency and stability analysis. Although the transient stability analysis (TSA) provides higher precisions to reproduce systems events in reality [62], the time-domain simulations are often cost-prohibitive for the exhaustive screening of all possible situations after contingencies. In practices, only credible contingency sets are chosen to simulate and provide dynamic information alongside the results from
steady-state models.
The steady-state models exhibit significant popularity in smart grid research con-cerning the cascading failures. There are two typical DC power flow based CFSs distin-guished by their time-frame. Some studies [52, 63] focus on long-term effects to eval-uate temperature and line-expansion to determine the vulnerability of a branch. Then proper control measures, e.g., vegetation management, can be applied to reduce the risk of blackouts. Meanwhile, other research places a focus on relays [45], because they are critical factors in major blackouts due to the automatic branch tripping mechanism operated by relays [26]. The relay-based CFS usually focuses on short-term effects oc-curring in seconds or minutes, in contrast to the long-term models that run from less than an hour to a few days. For a fair comparison between the two methodologies, this chap-ter will compare the relay-based CFS with the transient stability models for cascading failure analysis.
In this chapter, we refer to the original cascading failure simulator in [45] as the CFS, and its modified version in this chapter as the DC-CFS, respectively. In addition,
the DC power generation and load are denoted asPg andPd, respectively, whereg
de-notes a generation bus andda load bus; correspondingly, the complete sets of generators
and load buses are denoted asGandD, respectively. Similarly,lrefers to a branch and
B is the set of branches, while the DC branch power flow is denoted byF. The voltage
magnitude and angles are denoted asV andθ, respectively.
2.2.2 The DC Power Flow based CFS
The DC-CFS in this chapter is developed based on [45], a steady-state cascading failure simulator for multi-contingency analysis. It belongs to a family of models of cascading failure based on DC power flow assumptions without consideration of reactive power and transmission loss [64, 65, 66]. In this chapter, modifications of modeling and implementation are made to the original CFS for cascading failure analysis and
comparison, and an overview is provided as follows with a flowchart shown in Figure 6: 1. The DC-CFS implemented an additional trigger of bus contingency so that cas-cading failure of both bus and branch contingencies can be simulated to validate the use of DC-CFS compared to the TSA approach;
2. In the generation and load re-dispatch process of the DC-CFS, we introduced weight vectors to the generation and load buses, which can be determined empir-ically in advance, or adjusted adaptively according to the feedback of simulated blackout size with proper algorithms;
3. A dedicated module is designed in the DC-CFS to handle the islanding issue so that the simulation can be implemented in parallel and further islanding technique and policy can be incorporated;
4. The system failure criterion of 10% in blackout size in original CFS is canceled in the DC-CFS so that we can explore and compare the full development of a potential cascading failure process in both models. Moreover, we can also justify if this criterion is appropriate in the simulation of cascading failures;
5. Last but not least, more implementation details, including the ramping rate, the ramping period, are provided to further improve this DC-CFS dedicated for cas-cading failure analysis.
While these modifications are the major contribution of this chapter, the adjust-ments to the original CFS enable a fair comparison between the DC-CFS and TSA model in cascading failure analysis. The detailed simulation can be divided into four
steps below (Steps A-D) to elaborate on initial events, dispatch policy, cascading
Generation Dispatch and Load Shedding All Sub-Grid Processed? Overloading Identified? Update of Power Grid
Status
Cascading Failure Ends
N Y Trigger An Initial Contingency Solution of Power Flow Initialize Power System States Calculation of Tf(l), Tramp and T Tripping of Dangerous Branch Calculation of O(l,t) N Y Figure 6. Flowchart of DC-CFS A. Initial Events
In the DC-CFS we consider potential cascading failures initiated by both branch and bus contingencies in the system. A branch contingency is the tripping of transmis-sion lines typically analyzed in traditional contingency analyses [43, 67, 68]. A bus contingency, similar to the case of a branch, is the tripping of a bus (substation) from the grid, after which no power flow is transmitted through the given bus.
In reality, bus contingencies, e.g., the outage of substations or power plants, oc-curred less frequently and thus were less studied in contrast to branch contingencies. Nevertheless, a cascading failure can still be triggered by a bus contingency, after which
all branches connecting to the failed bus are tripped [69, 70]. Since at least one branch
will be connected to a bus, any single-bus contingency will be at least anN −1event
and thus more likely to result in cascading failures or greater damages to the grid,
partic-ularly after the violation ofN−1security. Therefore, both scenarios will be considered
to better understand cascading failures in power systems.
B. Relay-based Overloading Branch Tripping
Branch tripping is one of the most common factors responsible for the cascading
failures after the initial event [34]. Therefore, we refer to each tripping as acascading
failure event (CFE), and the whole process of cascading failure is then represented by
a series of CFEs. The initial contingency is numbered as CFE 0, while the following CFEs occurred during a cascading failure are numbered by positive integers thereafter.
When a CFE occurs, overloading may be found on a branch l whose power flow Fl
exceeds its thermal rating of power flow, denoted as Cl. As critical or long-lasting
overloading can cause great damage to the power transmission, the relays will respond to these overloadings by tripping dangerously overloading branches from the grid. For
an overloaded branch denoted as l0, the following accumulative functionO(l0, t)from
[45] determines the severeness of overloading on a branchlat timet:
O(l, t) =
Z t
t0
[Fl(τ)−Cl]dτ, Fl(τ)> Cl (1)
whereFl(τ) is the branch power flow at timeτ. Theoretically, under the steady-state
assumption, O(l, t) of a branch l is integrated over the duration when it is overloaded
while the system remains in a steady state. As the power flowFl will be changed by
the generation and load re-dispatch after the occurrence of a CFE,t0 andt in practice
will have to be changed accordingly, which will be described later in the next subsection
following Eqn. (2). If the accumulationO(l, t)exceeds a dangerous thresholdOlimit(l)
at timeTf(l), the relays will automatically trip off the corresponding branchl. This
O(l, t) is not the actual heat accumulated on the branch, but an accumulative function of overloading evaluated by the relays to trip dangerous branches accordingly.
C. Generation and Load Redispatch
When a new failure occurs, the power transmission can be disrupted, and the bal-ance of load and generation has to be restored via re-dispatch process [71]. Specifically, between two consecutive cascading failures in a fully-connected grid, the following re-dispatching steps are performed:
C.1Generation ramping
The generation ramping involves two scenarios:
1. If there is a generation surplus, i.e., P
Pg > PPd, ramp down all generators’
output with a given ramping rater.
2. If there is a generation deficit, i.e.,P
Pg <
P
Pd, ramp up all generators’ output
with the given ramping rateruntil ramping is terminated;
The ramping is terminated when any of these two following conditions is met:
i)P
Pg ≥PPd; or ii) the output of a given generator reaches its capacityPmax(g);
C.2Generator tripping/load shedding
Similar to the generation dispatch, there are also two corresponding processes to handle the surplus and deficit, respectively:
1. If the surplus still exists after ramping, then the generators with minimal non-zero
importance will be instantly tripped one by one in the grid untilP
Pg ≤
P
Pd;
2. If the desired balance (P
Pg = PPd) is still not met after a certain amount of
time Tramp, the load on the bus with the minimal non-zero importance will be
shed one by one until the load-generation balance is established;
After the ramping and shedding process, the power flow on each branch is instantly recalculated and redistributed to set up a new system operating point.
In this procedure, the ramping in Step C.1tries to resolve any imbalance between
generation and load caused by cascading failure. In both scenarios, we assumed all
generators ramp up or down with a uniformed maximal ramping rate r with respect
to their capacity. As this ramping process can be interrupted by a new CFE in the
system, the duration of generation ramping period between two CFEs, denoted asTramp,
is determined by the following equation:
Tramp = min
l∈L{Tf(l)} (2)
where Tf(l) corresponds to the dangerous threshold Olimit(l) as aforementioned. No
failure occurs during this periodTramp, and the power grid is assumed to stay in a
steady-state. Therefore, the accumulative overloadO(l, t)in Eqn. (1) is integrated fromt0, the
moment when a new CFE is observed, tot0 +Tramp, the moment when the next CFE
occurs in the system. In this way, if a new CFE occurs in the system, the actual value
oft0 is automatically reset to the time when this CFE occurs, andt is set tot0 +Tramp
whenTrampis calculated by Eqn. (2). This allows the DC-CFS to directly useTramp as
a step time in simulation instead of using small, unit step intervals in classic transient stability models, which can be computationally expensive otherwise.
During the ramping period, a system can resume stable if the generation deficit or surplus is eliminated; however, if the desired balance is not met after ramping, then a
generator tripping and/or load shedding is performed inStep C.2to ensure the system
stability. The importance of a generation bus Yg is determined by the product of its
generationPg and a weight vectorWg, i.e.,Yg =Wg·Pg; similarly, the importance of a
load bus is calculated byYd =Wd·Pd.
Afterward, the system operation point is updated in Step C.3to continue the
adjustment on the generation side while minimizing the impact on the load/consumer’s side as long as the power system remains stable.
D. Islanded Sub-grids Processing
During the process of a cascading failure, an originally fully connected grid can be disintegrated into several islands, which can still maintain independent operation. Each island has independent topology, operating point, and potential cascading failures that continue to propagate therein. Instead of assigning a new CFS for each new island, in this implementation we used an alternative tactic to efficiently simulate cascading failure in islands of a power grid without increasing the implementation complexity.
Specifically, an island emerged when a CFE breaks down the grid is rendered as a new fully-connected sub-grid that carries the most recent system operating point in the corresponding segment. If generation and load are not balanced in an island, the
simula-tor re-dispatches the load and generation and recalculates power flow throughStep C.1
toStep C.3to establish a new balanced operating point, and obtains the corresponding
value ofTramp in each island if a new CFE occurs.
As islands may be further broken down when failure continues to propagate, it is necessary to synchronize different cascading failure processes in different sub-grids
during simulation. Therefore, when the values of Tramp for all current sub-grids are
obtained, we will use the minimum of them as a global time step ∆T to advance the
simulation:
∆T = min
i {Tramp(i)} (3)
wherei= 1,2, ..., K, andK is the number of existing sub-grids. It is notable that two
consecutive values of∆T may be obtained from different islands during the simulation,
so the sequence and location of the events are also recorded accordingly. Also, because
∆T is the minimum ofTramp across different islands, by definition every island still
This sub-grid handling is beneficial because the number of islands emerging during a cascading failure is unknown in advance. This uncertainty causes a high computation overhead for the simulator to process a time-variant number of islands simultaneously.
FromStep AtoStep D, cascading failures in all existing islands will be simulated
recur-sively until no overloading is further observed.
2.2.3 Assessment Metric
To assess the impact of cascading failures with DC-CFS, we choose theblackout
size as the assessment metric of a cascading failure. Denoted as∆P, it is defined as
thepercentageof the overall loss of load (measured in real power) with respect to the
original loading: ∆P = " X d∈D0 PD0 − X d∈D0 PD00 # /X d∈D0 PD0 (4)
whereD0 andD0are the sets of load buses in the original grid and the final grid,
respec-tively. PD0 andPD0 0 are the corresponding load remaining in each grid, respectively. It
is also notable that the final load loss, as a result of generation and load re-dispatch in
Step C, is equivalent to the loss of generation as the system is designed to be balanced
afterStep C.
According to the model described above, we decompose the final blackout size∆P
into three parts. First, if a contingency is initially triggered on a load bus that has a non-zero load, the load on that bus will be instantly lost, which is referred to as the direct loss of real power. Secondly, immediately after the initial contingency, the blackout
size is contributed by the system’s first re-dispatch and shedding process in Step Cas
an emergent response. Since there is limited time to react to the abrupt contingency, some load will be shed in this emergent response. Third and last, after the re-balance of load and generation, a potential cascading failure triggered by overloading branches will further increase the loss of load.
cascading failure (∆NL) is also assessed as comparative metrics of the cascading failure impact. It is measured as the number of load buses whose load is either completely or
partially shed during the cascading. The correlation efficient of∆NL and∆P will be
evaluated for comparison in following simulations.
2.3 Vulnerability Assessment with DC-CFS
2.3.1 Simulation Setup
In this chapter, the DC-CFS is implemented in MATLAB and the MATPOWER toolbox [60] is used to calculate DC power flow in the benchmark. The standard IEEE 39-bus system is also chosen from MATPOWER as the benchmark to evaluate the DC-CFS. This system has a total load of 62.54 p.u.; it contains 39 buses (10 of which are
generation buses) and 46 branches with specified capacity Cl. The benchmark is an
abstract representation of the New England test system, in which a single bus (Bus 39) represents the regional system’s interconnection to the rest of US/Canada. As one of the most widely used benchmarks in power system studies, it is a suitable general representation of typical regional power transmission networks.
The ramping raterof all generateors are set as5%/min with respect to each
gener-ator’s capacity. Since we do not have a practical reference of the importance of buses,
all generation buses are assigned equal importance (Wg = 1/NG); the same for all load
buses (Wd= 1/ND). As a result,Yg andYdare proportional to the generation and load
of corresponding types of buses, respectively, and so the simulator trips the generator with minimum non-zero generation and then sheds the non-zero load in the grid when
necessary. These values of r, Wg and Wd can be adjusted accordingly when detailed
information is obtained in real power system applications. If such information is not available, these weights can also be adjusted heuristically according to the blackout size simulated in the DC-CFS as well as other stability constraints in consideration. This allows better approximation of a real power system to minimize the impact of
cascad-ing. Finally, as mentioned before, we refer to [45] to determine the critical threshold
Olimit(l)withTref = 5sand Fl = 150%×Cl. With all these settings, the DC power
flow based simulation results are presented as follows.
2.3.2 Vulnerability Assessment
First, we illustrate the histograms of the final blackout size of both single bus and single branch contingency in Figure 7. As discussed in Section 2.2.2, given the same number of simultaneous contingencies, single-bus contingencies should in general yield greater cascading failure damage than branch contingencies. The distributions in Fig-ure 7 are consistent with this assumption. Roughly 61% of the 39-single bus contingen-cies and 24% of the 46 single-branch contingencontingen-cies lead to a blackout size greater than 10% of the overall load in the system. It is also notable that while the majority of the blackout sizes are no greater than 25%, some critical contingencies still result in the loss greater than 40%. 0 0.1 0.2 0.3 0.4 0.5 0.6 0.7 0.8 0.9 1 0 5 10 15 20 25 30 Blackout Size Number of Contingencies Single−bus contingencies Single−branch contingencies
Figure 7. Blackout size distribution in the IEEE 39-bus system.
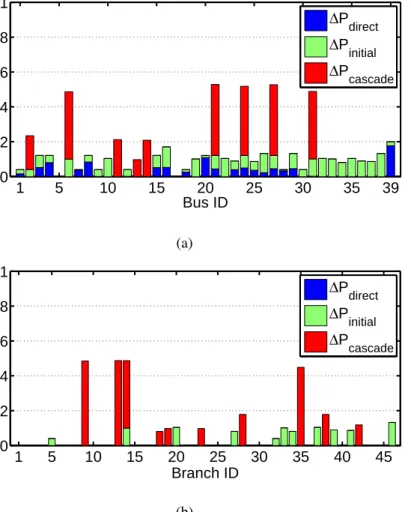
In addition to the overall blackout size, Figure 8 illustrates the decomposition of overall blackout size in single-bus and single-branch contingencies, respectively, where different components of a blackout size are shown as stacked bars representing
differ-ent compondiffer-ents in final blackout sizes. The first type of bars∆Pdirect on the bottom is
represents the load loss after the initial emergent re-dispatch right after the attack;
fi-nally, the last type of bars∆Pcascadeon top corresponds to the fraction of blackout sizes
contributed by the triggered cascading failures.
1 5 10 15 20 25 30 35 39 0 0.2 0.4 0.6 0.8 1 Bus ID Blackout Size ΔP direct ΔP initial ΔP cascade (a) 1 5 10 15 20 25 30 35 40 45 0 0.2 0.4 0.6 0.8 1 Branch ID Blackout Size ΔP direct ΔP initial ΔPcascade (b)
Figure 8. Decomposition of blackout sizes from single-bus and single-branch contin-gencies.
As shown in Figure 8(a), in single-bus contingencies the initial re-dispatch adds a significant amount to the blackout size to the direct loss of load buses, which is observed on most generation buses (Bus 30 to 38) and some load buses (Bus 6, 10, 16, etc). The generation-load combined Bus 39 is the only exception as it carries the largest genera-tion and load simultaneously in the system. As an equivalent bus of interconnecgenera-tion to the rest of US/Canada, Bus 39 in this benchmark provides 15.88% of the generation and
consumes 17.65% of the power in this system, resulting in a significant direct impact on the system when it fails even without a cascading failure. Nonetheless, from Figure 8(a) it is still shown that the cascading failure triggered by less loaded buses is responsible for the most severe single-bus contingencies blackouts. Meanwhile, the type of bus is not closely related to the eventual blackout size, as the most severe single-bus
contin-gencies (∆P > 20%) can be found on both load-only buses (Bus 6, 21, 24, 27) and
load-generator bus (Bus 31). In fact, because the type of a bus can be defined inter-changeably by altering the net injection of the given bus without changing the overall system dynamics, it does not have a definite influence on the eventual blackout size.
Instead, the decomposition of∆P in Figure 8(a) has shown that cascading failure plays
a more important role in the final impact.
Similar observation can be found in Figure 8(b) for single-branch contingencies.
Although for branch contingencies, there is no direct loss of power∆Pdirecton branches,
the re-dispatch still contributes to some blackout sizes that reach the similar scale as the bus-contingency blackouts without a cascading failure. However, in the most severe cases, the cascading failure is still the major factor in severe blackouts, which raises
some∆P to nearly 50%. For both types of triggers, we have observed that cascading
failures contribute significantly in the major blackouts caused by a single-component contingency.
In addition to the blackout size ∆P, we have also evaluated the number of load
buses affected in the cascading failures using DC-CFS. The number of load buses
af-fected by a cascading failure(∆NL) is shown in Figure 9 with both types of triggers.
The correlation coefficients of ∆P and ∆NL are ρpl,bus = +0.9365 for buses and
ρpl,branch = +0.9278 for branches, respectively. The results indicate a relatively high
correlation between the blackout size and the number of buses that subject to load shed-ding during the cascashed-ding failures, which is reasonable as the bus with the minimal load