Efficient pathway enrichment and network analysis of
GWAS summary data using GSA-SNP2
Sora Yoon
1,†, Hai C. T. Nguyen
1,†, Yun J. Yoo
2,3, Jinhwan Kim
1, Bukyung Baik
1,
Sounkou Kim
1, Jin Kim
4, Sangsoo Kim
5and Dougu Nam
1,6,*1School of Life Sciences, Ulsan National Institute of Science and Technology, Ulsan 44919, Republic of Korea, 2Interdisciplinary Program in Bioinformatics, Seoul National University, Seoul 08826, South Korea,3Department of Mathematics Education, Seoul National University, Seoul 08826, Republic of Korea,4SK Telecom, Seoul 04539, Republic of Korea,5School of Systems Biomedical Science, Soongsil University, Seoul 06978, Republic of Korea and 6Department of Mathematical Sciences, Ulsan National Institute of Science and Technology, Ulsan 44919, Republic of Korea
Received March 09, 2017; Revised February 19, 2018; Editorial Decision February 23, 2018; Accepted March 13, 2018
ABSTRACT
Pathway-based analysis in genome-wide association study (GWAS) is being widely used to uncover novel multi-genic functional associations. Many of these pathway-based methods have been used to test the enrichment of the associated genes in the pathways, but exhibited low powers and were highly affected by free parameters. We present the novel method and software GSA-SNP2 for pathway enrichment analy-sis of GWASP-value data. GSA-SNP2 provides high power, decent type I error control and fast computa-tion by incorporating the random set model and SNP-count adjusted gene score. In a comparative study using simulated and real GWAS data, GSA-SNP2 ex-hibited high power and best prioritized gold stan-dard positive pathways compared with six existing enrichment-based methods and two self-contained methods (alternative pathway analysis approach). Based on these results, the difference between path-way analysis approaches was investigated and the effects of the gene correlation structures on the path-way enrichment analysis were also discussed. In ad-dition, GSA-SNP2 is able to visualize protein interac-tion networks within and across the significant path-ways so that the user can prioritize the core subnet-works for further studies. GSA-SNP2 is freely avail-able athttps://sourceforge.net/projects/gsasnp2. INTRODUCTION
Improving the power of genome-wide association study (GWAS) has been a major challenge for the last decade. The multiple testing correction in GWAS typically resulted
in only a handful of single nucleotide polymorphism (SNP) markers. Analysis of such top-ranked SNPs discarding all except ‘the tip of the iceberg’ was capable of revealing only a small number of associated functions. As the sequencing cost keeps dropping, whole genome sequencing data have
come to be used for GWAS (1), which poses a much greater
multiple testing burden. A number of multi-loci (gene or pathway)-based association analysis methods were devel-oped to address the problem. These methods substantially increased the statistical power, and revealed many novel genes and pathways that were not found by the SNP-based
approach (2–4). In particular, pathway-based association
analysis methods directly provide biological interpretations and are capable of detecting aggregate association of mul-tiple genes even when the individual genes are only moder-ately associated.
In earlier efforts, most of the pathway-based GWAS
anal-ysis methods incorporated thecompetitive null hypothesis
(5), and tested the relative enrichment of the associated
genes in each pathway gene set. GenGen (6), GSEA-SNP
(7), iGSEA4GWAS (8), SSEA (9) and MAGENTA (10)
implemented modified GSEA algorithms which were orig-inally developed for the pathway analysis of gene
expres-sion data; GSA-SNP (11) implemented a modified Z-test as
well as two GSEA algorithms; Aligator (12) and Gowinda
(13) provided Gene Ontology over-representation analysis
accounting for the gene size (or SNP count); INRICH (14)
tested enrichment of pathway gene-sets across independent
genomic intervals; and MAGMA (15) exploited multiple
regression models for gene and gene-set analysis. Whereas competitive methods for GWAS data provide fast and sim-ple imsim-plementations, many of them exhibit low powers and are susceptible to some free parameters.
The pathway-based association analysis methods were
then developed for theself-containednull hypothesis in
re-*To whom correspondence should be addressed. Tel: +82 52 217 2525; Fax: +82 52 217 2639; Email: [email protected]
†The authors wish it to be known that, in their opinion, the first two authors should be regarded as joint First Authors.
C
The Author(s) 2018. Published by Oxford University Press on behalf of Nucleic Acids Research.
This is an Open Access article distributed under the terms of the Creative Commons Attribution Non-Commercial License
cent years (3,5,16,17). Competitive methods directly target
pathway-level aberrations by testing theenrichmentof the
associated genes in each pathway, whereas self-contained
methods test the existence of an associated gene therein
(18). Thus, self-contained methods are in general highly
sen-sitive and therefore are useful in discovering novel pathways. However, genes typically have multiple functions and the mere existence of an associated gene does not always
im-ply apathway-levelaberration. Thus, both approaches are
useful and complement each other.
Furthermore, protein–protein interaction (PPI) networks have also been considered for analyzing GWAS summary data to identify large modules of associated proteins beyond
the pre-defined pathway gene-sets (19,20). Overall,
interro-gation of GWAS data from different levels of biologic ob-jects (SNP, gene, pathway and network) has proven useful for revealing novel associations with a phenotype of inter-est.
Here, we present the novel method and C++ standalone
tool GSA-SNP2. It accepts GWAS SNPP-values and
im-plements a powerful competitive pathway analysis as well as PPI network visualization in the significant pathways.
Com-pared with the previous version (11), GSA-SNP2 provides
a greatly improved type I error control by using the SNP-count adjusted gene scores, while nevertheless preserving high statistical power. The gene scores are adjusted for the SNP counts in each gene using monotone cubic spline trend curve. It was critical to remove high scoring (potentially associated) genes before the curve fitting to achieve high power. The performance of GSA-SNP2 was compared with those of six existing competitive pathway analysis meth-ods and two recently developed self-contained methmeth-ods
us-ing GWAS data simulated under linear model (21) and
three publicly available GWAS summary datasets. GSA-SNP2 exhibited high power and surpassed other methods
in prioritizing the curatedgold standardpathways. Based on
these results, the different pathway analysis approaches for GWAS data are compared and discussed. Furthermore, the difference in the gene correlation structures between GWAS and gene expression data, and their effects on competi-tive pathway analysis are investigated. In addition, GSA-SNP2 is able to visualize the PPI networks within (local) and across (global) the significant pathways. These net-works suggest how the key proteins interact with each other and affect their neighbors in the aberrant pathways. The global network, in particular, shows the core PPI struc-ture that cannot be capstruc-tured by single pathways guiding a
mechanistic study. GSA-SNP2 is freely available at https:
//sourceforge.net/projects/gsasnp2.
MATERIALS AND METHODS Methods used in GSA-SNP2
GSA-SNP2 employs theZ-statistic of the random set model
(22) for evaluating gene-sets (pathways). The critical
im-provement from the previous version (11) is obtained from
the usage of the gene scores adjusted for the SNP counts for
each gene using a monotone cubic spline trend (23).
Adjusted gene scores. SNPs that are located in the range
of a gene [gene start−padding, gene end+padding] are
as-0 50 100 150 200 250 300 0 1 2 3 4 The number of SNPs
Gene score (−log best p)
Curve fitting (blue) Curve fitting (all)
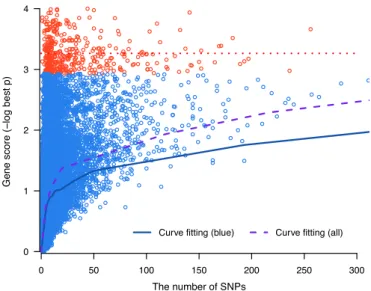
Figure 1. The monotone cubic spline trend curves. Red circles represent high scoring genes that have zero correlation coefficient (red dotted line). Both the trend curves with (purple dash) or without (blue solid) red circles are depicted. The blue curve is used for calculating the adjusted gene scores.
signed to the gene. The padding size of a gene is chosen among 0, 10 000 and 20 000 (default) and the same padding
size is applied to all genes. According to Pickrell et al.
(24), 90% of SNPs affecting expression quantitative trait
loci were observed within 15 kb from the 5 and 3-end of
a gene. Thus, padding sizes around 15 kb (10 or 20 kb) may be reasonable. Then, the initial gene score is given as
the maximum of –log(SNPP-value) for those SNPs. These
gene scores in general tend to increase as the number of as-signed SNPs is increased. Thus, the initial gene scores are adjusted for the number of assigned SNPs using monotone
cubic spline trend as shown in Figure1. Note that a number
of genes have very high scores irrespective of the increas-ing trend for the SNP counts. Therefore, such high scor-ing (presumably associated) genes are removed before fittscor-ing the trend curve. In other words, a range of top gene scores where their correlation coefficient becomes zero (red circles) is searched and the corresponding genes are removed. And then, a monotone cubic spline curve (blue solid curve) is fit-ted for the remaining genes (blue circles). We note that if such high scoring genes are not removed, the trend curve rather moves up (purple dash), which considerably lowers the power of our method. The meaning of these high scoring ‘uncorrelated’ genes is discussed in Supplementary Data.
The adjusted gene score forith genegiis given as:
Ad j(gi) = −log(pi)−C(gi),
where pi is the bestP-value among the SNPs assigned to
giandC(gi) is the estimated gene score on the trend curve.
Note that the removal of the high scoring genes is only for the curve fitting and they are all restored when calculating the adjusted gene scores. See ‘Supplementary Data’ section for the detailed description of the algorithms for the outlier treatment, the novel algorithms for data sampling and
con-version to monotonic data usingdual cubic splines for the
Pathway statistic. Each pathway gene-set Pj (1≤j≤K)
can be assessed byZ-statistic as follows:
ZPj
= Pj− m
σ/Nj
,
where Pj is the average of the adjusted gene scores in the
gene-setPj,mandσare respectively the mean and standard
deviation of all the adjusted gene scores,Njis the number
of genes in Pj. In this method, each pathway gene-set is
as-sumed to be a random collection of genes from the genome;
hence the pathway statistic Z(Pj) is assumed to have
stan-dard normal distribution. The pathwayP-value is obtained
from the right-tailed test and Benjamini–Hochberg method
is used for the multiple testing correction (25). It was also
shown that one-tailed Z-test (used for GWAS data) bet-ter controls false positives compared with two-tailed Z-test (used for gene expression data), rendering our Z-
Z-test-based approach more attractive (26). GSA-SNP2 uses a
modified Z-statistic (22) to capture more closely the
im-pact of the set size on the set statistic by replacingσ with
σ∗ = σ·(|G|−Nj
|G|−1)
1
2, where|G|is the total number of genes
analyzed. This modification slightly increases the power of our method by amplifying the original statistic. This Z-statistic indeed had standard normal distribution (Supple-mentary Figure S1).
Adjacent gene filtering. Some genes in a pathway can be closely located on the genome or highly overlapping fam-ily genes, and some of those genes may also belong to the same linkage disequilibrium (LD) block. Such genes exhibit
a positive correlation in theirP-values and may contribute
to increasing false positive pathways. To prevent this possi-bility, the adjacently located genes within a pathway are al-ternatively removed if they also have high positive genotype
correlations (>0.5) in the 1000 Genomes data. See
‘Sup-plementary Data’ section for the detailed algorithm and test results for different correlation thresholds (Supplemen-tary Table S4). However, in practice, only a small portion of genes in a pathway were adjacently located while at the
same time having high correlations (<1% on average even
for lower correlation threshold 0.3). Thus, this filtering pro-cess seems to have a limited effect in reducing false positives.
Pathway analysis methods compared with GSA-SNP2
The type I error rate control and statistical power of GSA-SNP2 were compared with those of six existing competitive pathway analysis methods that analyze GWAS summary data as follows: Z-test of GSA-SNP (denoted GSA-SNP1), iGSEA4GWAS, MAGMA, INRICH, Gowinda and MA-GENTA. MAGMA was tested for mean, top 1 SNP statistic, as well as their combination (denoted MAGMA-mean, MAGMA-top1 and MAGMA-multi, respectively). For MAGENTA, two default enrichment cutoffs (75 and 95 percentiles of all gene scores) were used. For INRICH, the SNP intervals were constructed for top 1% association
P-values. Using other larger percentages resulted in a very
long computation time in the simulation test.R2=0.5 was
used for the LD-clumping parameter. Gowinda was tested for gene-mode, and candidate SNPs were selected for the
top 1, 5 or 10% ofP-values. For other parameters, the
de-fault values were used.
In the power simulation test, the relative ‘enrichment’ of associated genes in the target pathway was simulated; there-fore, only the competitive methods described above were compared. In analyzing public GWAS datasets, however, two self-contained methods, sARTP and self-contained ver-sions of MAGMA were also compared.
Simulation of GWAS data based on linear model
We simulated the genotypes of 10 000 individuals by ran-domly pairing the haplotypes of 1000 Genomes European
samples. The phenotypeYof each individual was calculated
based on linear model (quantitative trait) (21). For testing
the type I error rate control, the following model was used.
Y=β1X1+ · · ·βkXk+ε
where X1,· · ·,Xkare normalized additive genotypes ofk
effective SNPs,β1,· · · , βkare SNP effects (set as one in this
study) andεis the residual withε∼N(0, σ2). In the type
I error rate test, 300 effective SNPs were randomly selected within gene regions (including the padding parts). The
phe-notype varianceσ2is determined by the narrow-sense
heri-tability (h2). In this case, the simulation data were generated
forh2=25 or 50%.
For testing the statistical power, the following model was used.
Y=β1X1+ · · ·βkXk+γ(G1+ · · · +GM)+ε
whereγ is the gene-set effect andG1,· · ·,GM are the
ef-fects of M causal genes in the target pathway. The target pathway is randomly selected among the pathway gene-set
database. The effect of a genegis defined as Gg=(Xg1+
· · · +XgL)/ √
LwhereXg1,· · ·,XgLare normalized additive
genotypes of Lcausal SNPs within gene g. In this case,
the total heritability was decomposed into the background
heritability h2
b =
Var(β1X1+···βkXk)
Var(Y) and gene-set specific
her-itability h2
g =
Var(γ(G1+···+GM))
Var(Y) , assuming that X1,· · · ,Xk
andG1,· · · ,GMhave no correlation. The gene-set effectγ
and phenotype varianceσ2are determined by the
combina-tion ofh2
bandh2g. The power simulation data were generated
forh2
b= 25% or 50% andh2g = 4% or 8%. A hundred of
background SNPs were randomly selected within gene re-gions, and 10–40% of causal genes in the target pathway were randomly chosen. For each causal gene, one causal SNP was randomly assigned. The 674 Reactome pathway gene-sets (set size: 10–200) were used for both type I error
rate and power simulation tests (27,28).
RESULTS AND DISCUSSION
Simulation results for type I error rate control
False discovery rate (FDR) control simulation was
re-peated 20 times for two conditions h2 =25 or 50%, and
the numbers of significant gene-sets (FDR < 0.05)
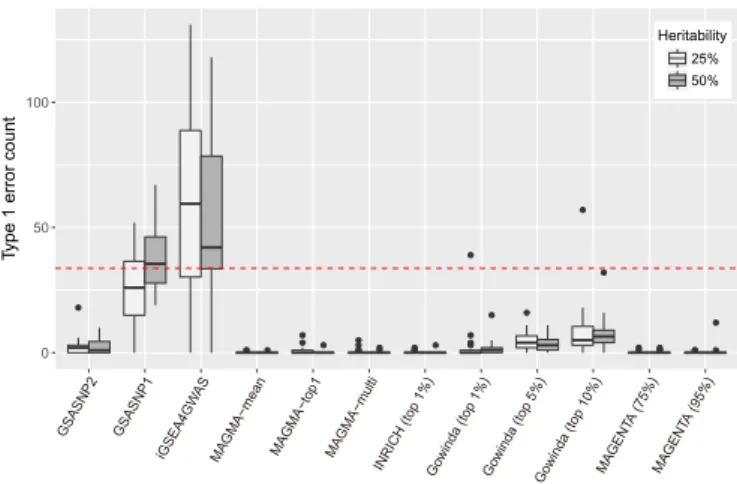
de-tected by each method were depicted in Figure 2.
*6$613 *6$613 L*6($* :$ 6 0$ *0$PHDQ 0$ *0$WRS 0$ *0$P XOWL ,15,&+WRS*RZLQGDW RS *RZLQGDWRS*RZLQGDWRS 0$ *(1 7$ 0$* (1 7$ 7\ SHHUURUFRXQW +HULWDELOLW\
Figure 2. Comparison of false discovery controls. False discovery counts (FDR<0.05) for competitive pathway analysis methods are shown. The simulation was performed for two heritability values (25 and 50%) and each simulation was repeated 20 times. MAGMA was tested for three gene models; INRICH was tested for approximately top 1% SNPs; Gowinda was tested for approximately top 1, 5 and 10% SNPs; and MAGENTA was tested for 75 and 95% of enrichment cutoffs. The red dashed line indicates the 5% of the total pathways.
genome, iGSEA4GWAS and GSA-SNP1 detected a num-ber of significant gene-sets (median false discovery counts
for iGSEA4GWAS: 59.5 forh2 =25%, 42 for h2 =50%;
GSA-SNP1: 26 forh2=25%, 35.5 forh2=50% out of 674
pathway gene-sets). GSA-SNP2 showed greatly improved FDR control compared with GSA-SNP1 (Median false
dis-covery: 2 for h2 = 25% and 1 for h2 = 50%). INRICH,
MAGMA and MAGENTA exhibited strict FDR controls (almost zero false discoveries), whereas Gowinda exhibited
rather varied FDR controls depending on the SNPP-value
cutoff.
Simulation results for statistical power
The statistical power of each method was tested for
com-binations of two background heritability values ( h2
b=
25%, 50%) and two set-specific heritability values ( h2
g=
4%, 8%). In each parameter setting, simulations were re-peated 50 times and we counted the cases where the
tar-get pathway was successfully detected (FDR<0.05).
GSA-SNP1 and iGSEA4GWAS were not included because they
exhibited poor FDR controls. Figure 3 shows the
pow-ers of each method for the four different parameter set-tings. GSA-SNP2 exhibited outstanding powers for all the test conditions among the competitive pathway analysis
methods (78.0% for h2
b= 25%, h2g= 8%; 60.0% for h2b=
25%, h2
g= 4%; 65.3% for h2b = 50%, h2g= 8%; 44.0%
forh2
b= 50%, h2g = 4%). MAGMA exhibited varied
pow-ers depending on the gene scoring method and the simu-lation parameters. For three out of four cases, MAGMA-mean had slightly better powers than MAGMA-top1. Their combination, MAGMA-multi, showed an improved power
whenh2
b = 25% and h2g= 8%. INRICH and MAGENTA
exhibited low powers compared with other methods; the best powers of INRICH, MAGENTA (75%) and MA-GENTA (95%) were only 16.3, 12.2 and 14.3%, respectively.
*6$613 0$ *0$PHDQ 0$ *0$WRS 0$ *0$P XOWL ,15,&+ WRS *R ZLQG DW RS *RZ LQGDWRS *RZLQG DW RS 0$ *(17 $ 0$ *(17 $ 3R Z H U +HULWDELOLW\ +E +J +E +J +E +J +E +J
Figure 3. Comparison of statistical powers. Powers of competitive path-way analysis methods under the four different simulation settings (h2
b= 25%, h2
g= 8%; h2b= 25%, h2g= 4%; h2b= 50%, h2g= 8%; and h2b= 50%, h2g= 4%) are represented. In each method, the same param-eters as used in the false discovery control test were used.
Gowinda exhibited varied powers depending on the SNPP
-value cutoff.
Performance comparison using real GWAS summary data
GSA-SNP2, six other competitive methods, as well as two self-contained methods were tested for three public GWAS
summary datasets (DIAGRAM (29), GIANT height (30)
and KARE height (31)), and their performances were
com-pared based on curated gold standard pathways. In addi-tion, we tested hybrid methods where the adjusted gene
scores in GSA-SNP2 are replaced with VEGAS (3,32) or
GATES (4) gene scores. VEGAS provides empirical P
-values for each gene using multivariate normal distribution,
and GATES also provides gene-basedP-values taking into
account the effective number of SNPs in each gene. Be-tween them, only VEGAS provided reasonably good path-way analysis results, so was included in the performance comparison. For VEGAS, two options of using all SNPs in each gene (denoted GS2VEGAS-all) and only the top
SNP (denoted GS2VEGAS-top1) were tested. INRICH (P
=1E-6 andP=1E-8), Gowinda (P=1E-3,P=1E-2 andP
=5E-2) and MAGENTA (enrichment cutoff: 75 and 95%
gene scores) were tested for a couple of free parameter val-ues.
First, the type 2 diabetes (T2D) GWAS summary P
-values (stage 1 metadata; case 12 171 and control 56 862 samples) were downloaded from the DIAGRAM
consor-tium site (http://www.diagram-consortium.org/). Morriset
al. have curated 16 hallmark pathways for T2D (29). These
pathways as well as those including the word ‘diabetes’ in the pathway name were regarded as gold standard (GS)
pos-itives and were summarized into 15GS categories(Table1
and Supplementary Data). Among the 1264 MSigDB C2
canonical pathways (28,33), 136 pathways were found to
belong to one of these categories (denoted GS pathways)
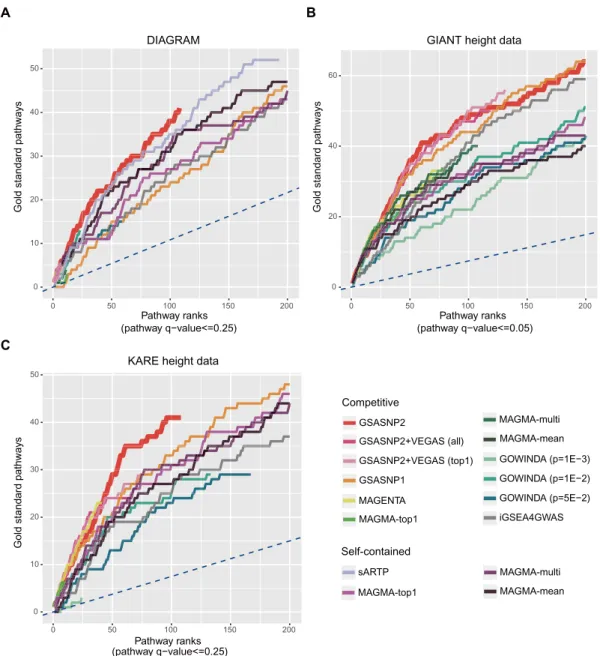
and are listed in Supplementary Data. Figure 4A shows
the comparison results between different methods; the cu-mulative GS pathway counts corresponding to the
path-way ranks were depicted for each method up toq-value<
*6$6139(*$6DOO *6$6139(*$6WRS *6$613 *2:,1'$S ( *2:,1'$S ( *2:,1'$S ( L*6($*:$6 0$*(17$ 0$*0$WRS 0$*0$PXOWL 0$*0$WRS 0$*0$PXOWL 0$*0$PHDQ V$573 0$*0$PHDQ *6$613 3DWKZD\UDQNV SDWKZD\TYDOXH *,$17KHLJKWGDWD 3DWKZD\UDQNV SDWKZD\TYDOXH 3DWKZD\UDQNV SDWKZD\TYDOXH ',$*5$0 &RPSHWLWLYH 6HOIFRQWDLQHG .$5(KHLJKWGDWD *ROGVWDQGDUGSDWKZD\V *ROGVWDQGDUGSDWKZD\V *ROGVWDQGDUGSDWKZD\V A B C
Figure 4. Performance comparison using real data. For three public GWAS summary datasets from (A) DIAGRAM, (B) GIANT height and (C) KARE height data, the cumulative gold standard pathway counts for competitive and self-contained pathway analysis methods were plotted. The results from INRICH were not represented because it detected only one GS pathway. The blue dashed lines indicate the expected cumulative gold standard pathway counts for random prediction.
the GS pathways. The graphs corresponding to a stricter
cut-off (q-value <0.05) are also shown in Supplementary
Figure S2. See also Supplementary Table S1 for detailed analysis results of each method. GSA-SNP2 exhibited a high power and outperformed the other competitive and MAGMA self-contained methods in the overall GS path-way ranks. It also showed slightly better performance com-pared with sARTP. Except for GSA-SNP2, GSA-SNP1 and iGSEA4GWAS, most competitive methods detected only
a small number of GS pathways (≤15) due to their low
powers. GSA-SNP2, GSA-SNP1 and iGSEA4GWAS de-tected 41, 47 and 49 GS pathways out of the 108, 232 and
240 significant pathways (FDR < 0.25), respectively. All
the self-contained methods exhibited high powers as ex-pected. sARTP detected 52 GS pathways out of 193
sig-nificant pathways, and self-contained MAGMA-mean that showed the best result among the MAGMA methods de-tected 85 GS pathways out of 552 significant pathways.
Then, we compared the GS categories detected by each method. Here, we focused on four methods that de-tected more than 25 GS pathways within the top 100 ranks (GSA-SNP2, iGSEA4GWAS, sARTP and the self-contained MAGMA-mean). These four methods success-fully detected all the three GS pathways in the ‘regula-tion of beta cell’ category. Among the other categories, GSA-SNP2 predicted the largest number of GS pathways in the ‘diabetes’, ‘blood glucose regulation’, ‘branched chain amino acid metabolism’, ‘inflammation’ and ‘Notch signal-ing’ categories. iGSEA4GWAS best predicted in the ‘un-folded protein response’ and ‘glycolysis and
gluconeoge-Table 1 Power comparison for the 15 gold standard categories for type 2 diabetes Category GSASNP2 GS2VEGAS (best P) GSASNP1 iGSEA 4GWAS MAGMA-multi MAGENTA (75%) GOWINDA (P=0.01) sARTP MAGMA-mean-sc* Diabetes 3/4 1/4 3/4 2/4 0/4 1/4 2/4 3/4 3/4
Regulation of beta cell 3/3 3/3 1/3 3/3 0/3 2/3 3/3 3/3 3/3
Insulin/blood glucose level 10/25 0/25 8/25 2/25 0/25 0/25 1/25 4/25 7/25 Adipocytokine signaling 1/6 0/6 0/6 0/6 0/6 0/6 0/6 2/6 1/6 Cell cycle 4/22 1/22 1/22 5/22 2/22 0/22 1/22 4/22 6/22
Circadian rhythm 0/6 0/6 0/6 0/6 0/6 0/6 0/6 0/6 0/6 Unfolded protein response 0/2 0/2 0/2 2/2 2/2 0/2 0/2 2/2 2/2
Branched-chain a.a.** metabolism 1/2 0/2 1/2 0/2 0/2 0/2 1/2 0/2 0/2 Fatty acid metabolism 2/10 0/10 3/10 1/10 0/10 1/10 0/10 5/10 3/10 Glycolysis and Gluconeogenesis 0/3 0/3 0/3 2/3 0/3 0/3 1/3 0/3 0/3 Inflammation 8/22 0/22 2/22 3/22 0/22 0/22 0/22 4/22 0/22 NOTCH signaling 6/14 0/14 3/14 5/14 0/14 0/14 4/14 5/14 5/14 PPARG signaling 0/1 0/1 0/1 0/1 0/1 0/1 0/1 1/1 0/1 WNT signaling 0/11 0/11 2/11 1/11 0/11 0/11 0/11 2/11 0/11 Mitochondrial dysfunction 0/5 0/5 0/5 0/5 0/5 0/5 0/5 0/5 1/5 Total GS pathways 38/100 5/7 24/100 26/100 4/11 4/9 13/23 35/100 31/100 Gold standard pathways detected within the top 100 pathways were counted for each category. Insignificant pathways (FDR>0.25) were excluded. Total counts are shown in the bottom. The best counts in each category were marked in bold. *sc: self-contained method, **a.a.: amino acid.
nesis’ categories. Self-contained MAGMA-mean best pdicted in the ‘diabetes’, ‘cell cycle’, ‘unfolded protein re-sponse’, ‘Notch signaling’ and ‘mitochondrial dysfunction’ categories. sARTP best predicted in as many as seven cat-egories such as ’diabetes’, ‘adipocytokine signaling’, ‘un-folded protein response’, ‘fatty acid metabolism’, ‘PPARG signaling’ and ‘WNT signaling’. Some pathways showed the characteristics of self-contained methods. For exam-ple, the ‘KEGG PPAR signaling pathway’ contained only one strongly associated gene (PPARG) and was detected
only by the self-contained methods (q-value: 0.05 and 0.002
for sARTP and self-contained MAGMA-top1, respectively) demonstrating their high sensitivity. These results indicate that different pathway analysis methods exhibit different preferences for GS categories. Overall, GSA-SNP2 detected the largest number of GS pathways within the top 100 path-ways, and also showed a wide coverage of GS categories that is comparable to two powerful self-contained methods.
Next, the human height GWAS meta-analysis P-values
from the GIANT consortium 2010 (total sample size 183
727) were analyzed (30). In total, 15 GS categories
as-sociated with height and bone regulation were curated
from three independent studies. First, Perset al. performed
DEPICT pathway analysis using the height GWAS meta-analysis summary data from the GIANT consortium 2012–
2015 (total sample size: 253 288) (34,35). Because the large
sample size increases the statistical power, and DEPICT is shown to properly control the type I error rate and account for confounding factors, we regarded the DEPICT anal-ysis result as a good source for interrogating the height-associated pathways. From 183 significant pathways
ob-tained using a rather strict cutoff FDR <0.01, we found
12 GS categories that are supported in the literature such as
skeletal system development and epigenetics (36,37).
Sec-ond, Marouli et al. analyzed the rare and low-frequency
coding variants that affect human height, and suggested
several height-associated genes and pathways (38). Among
them, ‘proteoglycan’ and ‘reactive oxygen species (ROS)’ were experimentally validated in other studies, so we
in-cluded them in the GS categories (39,40). Third, ‘telomerase
activity’ is known to have an important role in chondrocyte proliferation during bone elongation, and thus was also
in-cluded in the GS categories (41). These 15 height-related GS
categories, supports in the literature, as well as all the corre-sponding GS pathways from the MSigDB C5 gene ontology
terms (v 6.0) (28,33) are listed in the Supplementary Data.
Based on these GS pathways, performances of the pathway analysis methods except sARTP were compared; sARTP cannot be applied without effect values. Because of the high powers caused by the large sample size, the
cumu-lative GS pathway counts were plotted up toq-value<0.05
in each method (Figure4B). With the GIANT height data,
GSA-SNP2 still exhibited a high power and best prioritized the GS pathways. It detected 50 GS pathways within the top 100 significant pathways. The other GSA-SNP methods including GSA-SNP1, all and GS2VEGAS-top1 also showed similar high performances except that GS2VEGAS-all and GS2VEGAS-top1 exhibited relatively less powers (i.e. lower upper bounds of the curves) com-pared with GSA-SNP1 and GSA-SNP2. Such a power re-duction is attributed to the empirical approach of VEGAS
which only provides geneP-values>10E-6. However, their
precisions do not seem to be reduced; within the top 100 significant pathways, mean and GS2VEGAS-top1 detected 50 and 53 GS pathways, respectively. Due to the large sample size, most competitive methods includ-ing MAGMA, MAGENTA (95%) and Gowinda showed greater powers compared with the T2D case. MAGENTA and MAGMA better prioritized GS pathways compared with the self-contained MAGMA methods (MAGENTA detected 35 GS pathways out of 73 significant pathways; MAGMA-multi detected 40 out of top 100 pathways; and self-contained MAGMA-multi detected 37 out of top 100 pathways).
In addition, there were clear differences in the prefer-ence of GS categories between the pathway analysis meth-ods. For example, the competitive MAGMA methods de-tected the largest number of ‘skeletal system development’ pathways such as ‘cartilage and chondrocyte development’ (e.g. MAGMA-multi detected 23 related terms), and many of them were in the top ranks. They were also top-ranked in the MAGENTA result. In contrast, GSA-SNP methods detected relatively more ‘epigenetics’ pathways (21–22 re-lated terms) in the top ranks. GSA-SNP methods
specifi-cally detected four ‘telomerase activity’ pathways within the top 100 ranks, whereas the other competitive methods de-tected only one or no telomerase related term. Addition-ally, GSA-SNP2 detected two ‘ROS’ pathways within the top 100 ranks, which were reported from a large-scale rare
and low-frequency variant analysis (38), whereas most of
the other methods failed to detected these pathways; only
GS2VEGAS-top1 and Gowinda (P= 0.05) detected one
of the ROS pathways. GS2VEGAS-all detected as many as six ‘insulin-like growth factor and growth hormone’ path-ways, whereas the other methods detected three or less cor-responding terms. All the detailed analysis results for each method are available in Supplementary Table S2.
Lastly, we analyzed the Korean height GWASP-values
from the KARE consortium where much smaller samples (8842) were used compared with the GIANT height data
(31). Comparison of pathway analysis methods using
rela-tively small-sample data is particularly important, because pathway analysis has been applied to GWAS to overcome the low powers of the conventional SNP-based analysis. In this case, the cumulative GS pathway counts were plotted
up to q-value < 0.25 due to the lowered powers in each
method (See Supplementary Figure S2 for the graphs
corre-sponding toq-value<0.05). GSA-SNP2 still showed high
power and outperformed the other methods in prioritizing the GS pathways. It detected 41 GS pathways out of top 100 terms. Here, GS2VEGAS and MAGENTA (75%) methods showed slightly better rank distributions than GSA-SNP2 in the former part (up to 40th rank). Although MAGENTA had a relatively low power, it exhibited the highest density of GS pathways (25 GS pathways within top 41 pathways: 61.0%) demonstrating its strict false positive control. The powers of MAGMA methods were severely decreased com-pared with the GIANT height case. MAGMA-mean and MAGMA-multi detected no significant pathways and only MAGMA-top1 detected five ‘skeletal system development’ and one ‘epigenetics’ pathways. It seems that MAGMA is very sensitive to GWAS sample size. The preferred GS cate-gories in each method were similar to the GIANT height case. For example, self-contained MAGMA methods de-tected many ‘skeletal system development’ pathways (13– 16 pathways; GSA-SNP2 detected 11 and the other meth-ods detected eight or less corresponding pathways), whereas GSA-SNP2 and two GS2VEGAS methods detected many ‘epigenetics’ pathways (17 pathways) and four ‘telomerase’ pathways. Among the rare and low-frequency variant asso-ciated pathways, only GSA-SNP1 and GSA-SNP2 detected four and one ‘proteoglycan’ pathways within the top 100 ranks, respectively. None of the tested methods detected an ROS pathway within the top 100 ranks. See Supplementary Table S3 for detailed analysis results for each method.
Comparison of competitive and self-contained pathway anal-ysis results
GSA-SNP2 and sARTP results for the DIAGRAM data were further compared by the pathways exclusively detected by either method. The top 10 pathways that were signifi-cant with GSA-SNP2 but were not signifisignifi-cant with sARTP, andvice versawere selected and the distributions of geneP
-values (VEGAS bestpoption) were compared in Figure5.
In the former case, several genes had similar lowP-values
which seemed to collectively represent the pathway-level aberrations. On the other hand, in the latter case, most
path-ways contained one or two extreme gene P-values which
seemed to dominate those pathways. If such extreme genes also belong to many other pathways, the association of the corresponding pathway may not be very reliable. We note that competitive methods are also affected by such outlier genes and self-contained methods are also capable of de-tecting pathways composed of moderately associated genes only; however, this example demonstrates the difference of the two GWAS pathway analysis approaches.
Comparison with the competitive pathway analysis for gene expression data
The core algorithms used for competitive pathway analy-sis of GWAS data are virtually the same as those used for gene expression data. It is well known that the competi-tive methods for gene expression data suffer from inflated type I errors caused by the inter-gene correlations in each
pathway (5,18,42). Interestingly, in our test for GWAS
sum-mary data, many competitive methods yielded little false positives. There is a substantial difference in the inter-gene correlation structure in each pathway between the two data types. In the gene expression case, many genes in each path-way are involved in the same biological process and exhibit positive correlations. However, in the GWAS case, only ad-jacently located genes in each pathway that belong to the same LD block exhibit positive correlations. Indeed, only a small portion of genes were adjacently located in each
MSigDB C2 canonical pathway (median=1.4%, mean=
4.3%), and only a portion of them had meaningful
corre-lations (median=0.0%, mean=0.9% for the correlation
threshold 0.3). Therefore, inter-gene correlations in GWAS data seem to exert very limited effect on false positive gen-eration. Note that GSA-SNP2 removes those highly corre-lated adjacent genes in calculating pathway scores to further reduce false positives (Supplementary Data). Many com-petitive methods for GWAS data based on GSEA
proce-dure (6,7,9) perform sample label permutation of genotype
data in order to control false positives. Our results suggest that the simple competitive methods that randomize gene or SNP labels reasonably control false positives without the heavy permutation of genotype data.
Comparison of running times
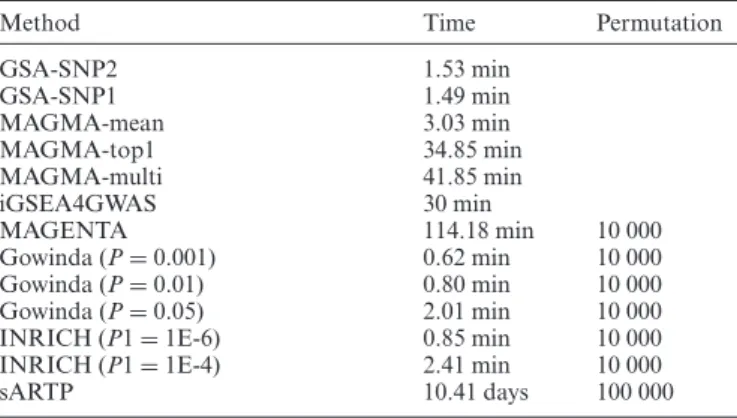
At last, the running times for each software were compared for the DIAGRAM data and the C2 canonical pathway sets
(Table 2). GSA-SNP1, GSA-SNP2, MAGMA-mean,
IN-RICH and Gowinda were quite fast taking only a few min-utes, while sARTP took over 10 days run on the same PC (Intel Xeon Processor X5670 @ 2.93GHz, 12 CPUs and 24GB of RAM).
Network visualization
GSA-SNP2 is able to visualize protein interaction networks within individual and across significant pathways. Network
0 2 4 6 8 −log10(vegas p−value) KEGG_CALCIUM_SIGNALING_PATHWAY. sARTP:0.687, GS2: 0.0441 BIOCARTA_TID_PATHWAY. sARTP:0.593, GS2: 0.0451 REACTOME_ION_TRANSPORT_BY_P_TYPE_ATPASES. sARTP:0.583, GS2: 0.0336 BIOCARTA_G1_PATHWAY. sARTP:0.564, GS2: 0.0441 KEGG_DILATED_CARDIOMYOPATHY. sARTP:0.495, GS2: 0.0434 KEGG_TYPE_I_DIABETES_MELLITUS. sARTP:0.423, GS2: 0.00621 BIOCARTA_AKAP95_PATHWAY. sARTP:0.37, GS2: 0.0259 KEGG_GRAFT_VERSUS_HOST_DISEASE. sARTP:0.346, GS2: 0.00534 KEGG_ALLOGRAFT_REJECTION. sARTP:0.335, GS2: 0.00534 KEGG_VALINE_LEUCINE_AND_ISOLEUCINE_BIOSYNTHESIS. sARTP:0.203, GS2: 0.00534
GSA−SNP 2−specific gene−sets
0 2 4 6 8 −log10(vegas p−value) REACTOME_METAL_ION_SLC_TRANSPORTERS. sARTP:0.00541, GS2: 0.938 REACTOME_ZINC_TRANSPORTERS. sARTP:0.00541, GS2: 0.932 KEGG_THYROID_CANCER. sARTP:0.00541, GS2: 0.774 REACTOME_KINESINS. sARTP:0.021, GS2: 0.764 BIOCARTA_41BB_PATHWAY. sARTP:0.0377, GS2: 0.46 REACTOME_FATTY_ACID_TRIACYLGLYCEROL_AND_KETONE_BODY. sARTP:0.00947, GS2: 0.423 REACTOME_ACTIVATION_OF_CHAPERONE_GENES_BY_XBP1S. sARTP:0.00821, GS2: 0.403 REACTOME_UNFOLDED_PROTEIN_RESPONSE. sARTP:0.0341, GS2: 0.33 REACTOME_DIABETES_PATHWAYS. sARTP:0.0108, GS2: 0.252 ST_GA13_PATHWAY. sARTP:0.0142, GS2: 0.225 sARTP−specific gene−sets A B
Figure 5. Comparison of geneP-value distributions in the pathways that are only significant with (A) GSA-SNP2 or (B) sARTP. The gray vertical line indicates the significance cutoff (VEGAS2P-value=0.05). GS2 represents GSA-SNP2. PathwayP-values for sARTP and GSA-SNP2 are also represented.
Table 2 Running times for eight pathway analysis programs for GWAS summary data
Method Time Permutation
GSA-SNP2 1.53 min GSA-SNP1 1.49 min MAGMA-mean 3.03 min MAGMA-top1 34.85 min MAGMA-multi 41.85 min iGSEA4GWAS 30 min MAGENTA 114.18 min 10 000 Gowinda (P=0.001) 0.62 min 10 000 Gowinda (P=0.01) 0.80 min 10 000 Gowinda (P=0.05) 2.01 min 10 000
INRICH (P1=1E-6) 0.85 min 10 000
INRICH (P1=1E-4) 2.41 min 10 000
sARTP 10.41 days 100 000
networks, and the cut-offs for gene and pathway scores for visualization are selected by the user. Clicking on the gene node pops up a table which shows the gene name, mapped SNPs, the neighboring genes, their association scores as well as further detailed information via the hyperlink to outer
databases such as GeneCards (45) and dbSNP (46). The
net-work data are also provided as a text file which also shows the pathways that contain the interacting protein pairs.
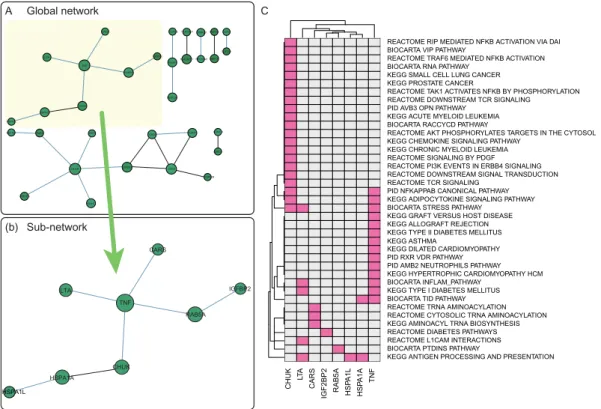
In particular, the global networks are able to show
in-teracting protein pairs that do not belong to any of the
single pathways. Such protein pairs may have drawn rela-tively less attention, but can provide useful information for mechanistic study. For example, the global networks (ex-tracted from HIPPIE networks) of the significant pathways
(FDR <25%, gene score < 0.01) obtained by analyzing
DIAGRAM data contained a sub-network composed of eight genes such as TNF, RAB5A, CHUK, LTA, CARS,
IGF2BP2, HSPA1L and HSPA1A (Figure6). Among them,
TNF and RAB5A have been individually studied and both are known to regulate the insulin-responsive glucose
trans-porter (GLUT4) (47–49), a key protein that regulates the
concentration of blood glucose by transporting it to mus-cle or fat cell. Thus, the deregulation of GLUT4 can lead
to insulin-resistance and T2D (50,51). The global networks
show the two proteins have a medium level of interaction score 0.63 (affinity chromatography technology), and their interaction may have an important implication in T2D.
The DIAGRAM data were also analyzed using STRING networks. It provided much denser interaction networks among the high scoring proteins than those for HIPPIE net-works, and the key T2D proteins TNF and PPARG were represented as hub proteins. Note that many of the interac-tion edges in the STRING networks were generated from the text-mining of the literature including GWAS papers, and should be carefully analyzed to avoid circular argu-ment.
CONCLUSION
GSA-SNP2 is a powerful and efficient tool for pathway en-richment analysis of GWAS summary data. It provides both local and global protein interaction networks in the associ-ated pathways, and may facilitate integrassoci-ated pathway and network analysis of GWAS data. Five features of GSA-SNP2 are summarized as follows:
i) Decent type I error controlby incorporating gene scores adjusted to the corresponding SNP counts using mono-tone cubic spline trend.
ii) High powerandfast computationbased on the random set model.
iii) Without any critical free parameter
iv) Protein interaction networksare visualized for the signif-icant pathways. This function enables the user to priori-tize core sub-networks within and across significant path-ways.
v) Easy to use: only requires GWAS summary data (or
gene P-values) and takes only a minute or two to get
D 6XEQHWZRUN $ E *OREDOQHWZRUN &+8. /7 $ &$56 ,*)%3 5$%$ +63 $ / +63 $ $ 71) .(**$17,*(1352&(66,1*$1'35(6(17$7,21 %,2&$57$37',163$7+:$< 5($&720(/&$0,17(5$&7,216 5($&720(',$%(7(63$7+:$<6 .(**$0,12$&</751$%,26<17+(6,6 5($&720(&<7262/,&751$$0,12$&</$7,21 5($&720(751$$0,12$&</$7,21 %,2&$57$7,'3$7+:$< .(**7<3(,',$%(7(60(//,786 %,2&$57$,1)/$0B3$7+:$< .(**+<3(57523+,&&$5',20<23$7+<+&0 3,'$0%1(87523+,/63$7+:$< 3,'5;59'53$7+:$< .(**',/$7('&$5',20<23$7+< .(**7<3(,,',$%(7(60(//,786 .(**$//2*5$)75(-(&7,21 .(***5$)79(5686+267',6($6( %,2&$57$675(663$7+:$< .(**$',32&<72.,1(6,*1$/,1*3$7+:$< 3,'1).$33$%&$121,&$/3$7+:$< 5($&720(7&56,*1$/,1* 5($&720('2:1675($06,*1$/75$16'8&7,21 5($&720(3,.(9(176,1(5%%6,*1$/,1* 5($&720(6,*1$/,1*%<3'*) .(**&+521,&0<(/2,'/(8.(0,$ .(**&+(02.,1(6,*1$/,1*3$7+:$< 5($&720($.73+263+25</$7(67$5*(76,17+(&<7262/ %,2&$57$5$&&<&'3$7+:$< .(**$&87(0<(/2,'/(8.(0,$ 3,'$9%2313$7+:$< 5($&720('2:1675($07&56,*1$/,1* 5($&720(7$.$&7,9$7(61).%%<3+263+25</$7,21 .(**35267$7(&$1&(5 .(**60$//&(///81*&$1&(5 %,2&$57$51$3$7+:$< 5($&720(75$)0(',$7('1).%$&7,9$7,21 %,2&$57$9,33$7+:$< 5($&720(5,30(',$7('1).%$&7,9$7,219,$'$, & /7$ 71) &$56 5$%$ ,*)%3 &&1(+/$'5$&61.%+1)%() 7&)/ +1)$ 536.$ +/$'5% )%;: 127&+ &+8. +63$$ +63$/ (()( 5$56 665 +/$% 8%(' +/$& &'.1$ &&1' 581; &'. &'.1% $%&& .&1-/7$ 71) &$56 5$%$ ,*)%3 &+8. +63$$ +63$/ .(**$67+0$
Figure 6.Gene network (HIPPIE) derived from DIAGRAM data analysis. (A) Global network from significant gene-sets (FDR<0.25; gene score<0.01). (B) A sub-network composed of eight nodes from the global network. (C) A heatmap representing the membership of each gene node in the significant pathways.
tools also require SNP correlation input and take much longer time.
DATA AVAILABILITY
GSA-SNP2 is available athttps://sourceforge.net/projects/
gsasnp2.
SUPPLEMENTARY DATA
Supplementary Dataare available at NAR Online.
FUNDING
National Research Foundation (NRF) of Korea, Genomics Program [2014M3C9A3068555]; Korean government, Ba-sic Science Research Program (NRF) [2017R1E1A1A030 70107, 2015R1A1A3A04001269]. Funding for open access charge: NRF [2014M3C9A3068555].
Conflict of interest statement.None declared.
REFERENCES
1. Yano,K., Yamamoto,E., Aya,K., Takeuchi,H., Lo,P.C., Hu,L., Yamasaki,M., Yoshida,S., Kitano,H., Hirano,K.et al.(2016) Genome-wide association study using whole-genome sequencing rapidly identifies new genes influencing agronomic traits in rice.Nat. Genet.,48, 927–934.
2. Wang,K., Li,M. and Hakonarson,H. (2010) Analysing biological pathways in genome-wide association studies.Nat. Rev. Genet.,11, 843–854.
3. Liu,J.Z., McRae,A.F., Nyholt,D.R., Medland,S.E., Wray,N.R., Brown,K.M., Hayward,N.K., Montgomery,G.W., Visscher,P.M., Martin,N.G.et al.(2010) A versatile gene-based test for genome-wide association studies.Am. J. Hum. Genet.,87, 139–145.
4. Li,M.X., Gui,H.S., Kwan,J.S. and Sham,P.C. (2011) GATES: a rapid and powerful gene-based association test using extended Simes procedure.Am. J. Hum. Genet.,88, 283–293.
5. Goeman,J.J. and Buhlmann,P. (2007) Analyzing gene expression data in terms of gene sets: methodological issues.Bioinformatics,23, 980–987.
6. Wang,K., Li,M. and Bucan,M. (2007) Pathway-based approaches for analysis of genomewide association studies.Am. J. Hum. Genet.,81, 1278–1283.
7. Holden,M., Deng,S., Wojnowski,L. and Kulle,B. (2008) GSEA-SNP: applying gene set enrichment analysis to SNP data from genome-wide association studies.Bioinformatics,24, 2784–2785.
8. Zhang,K., Cui,S., Chang,S., Zhang,L. and Wang,J. (2010)
i-GSEA4GWAS: a web server for identification of pathways/gene sets associated with traits by applying an improved gene set enrichment analysis to genome-wide association study.Nucleic Acids Res.,38, W90–W95.
9. Weng,L., Macciardi,F., Subramanian,A., Guffanti,G., Potkin,S.G., Yu,Z. and Xie,X. (2011) SNP-based pathway enrichment analysis for genome-wide association studies.BMC Bioinformatics,12, 99. 10. Segre,A.V., Groop,L., Mootha,V.K., Daly,M.J. and Altshuler,D.
(2010) Common inherited variation in mitochondrial genes is not enriched for associations with type 2 diabetes or related glycemic traits.PLoS Genet.,6, e1001058.
11. Nam,D., Kim,J., Kim,S.Y. and Kim,S. (2010) GSA-SNP: a general approach for gene set analysis of polymorphisms.Nucleic Acids Res., 38, W749–W754.
12. Holmans,P., Green,E.K., Pahwa,J.S., Ferreira,M.A., Purcell,S.M., Sklar,P., Owen,M.J., O’Donovan,M.C. and Craddock,N. (2009) Gene ontology analysis of GWA study data sets provides insights into the biology of bipolar disorder.Am. J. Hum. Genet.,85, 13–24.
13. Kofler,R. and Schlotterer,C. (2012) Gowinda: unbiased analysis of gene set enrichment for genome-wide association studies. Bioinformatics,28, 2084–2085.
14. Lee,P.H., O’Dushlaine,C., Thomas,B. and Purcell,S.M. (2012) INRICH: interval-based enrichment analysis for genome-wide association studies.Bioinformatics,28, 1797–1799.
15. de Leeuw,C.A., Mooij,J.M., Heskes,T. and Posthuma,D. (2015) MAGMA: generalized gene-set analysis of GWAS data.PLoS Comput. Biol.,11, e1004219.
16. Kwak,I.Y. and Pan,W. (2016) Adaptive gene- and pathway-trait association testing with GWAS summary statistics.Bioinformatics, 32, 1178–1184.
17. Zhang,H., Wheeler,W., Hyland,P.L., Yang,Y., Shi,J., Chatterjee,N. and Yu,K. (2016) A Powerful Procedure for Pathway-Based Meta-analysis Using Summary Statistics Identifies 43 Pathways Associated with Type II Diabetes in European Populations.PLoS Genet,12, e1006122.
18. Nam,D. and Kim,S.Y. (2008) Gene-set approach for expression pattern analysis.Brief. Bioinform.,9, 189–197.
19. Wang,Q., Yu,H., Zhao,Z. and Jia,P. (2015) EW dmGWAS: edge-weighted dense module search for genome-wide association studies and gene expression profiles.Bioinformatics,31, 2591–2594. 20. Rossin,E.J., Lage,K., Raychaudhuri,S., Xavier,R.J., Tatar,D.,
Benita,Y., Cotsapas,C. and Daly,M.J. (2011) Proteins encoded in genomic regions associated with immune-mediated disease physically interact and suggest underlying biology.PLoS Genet.,7, e1001273. 21. de Leeuw,C.A., Neale,B.M., Heskes,T. and Posthuma,D. (2016) The
statistical properties of gene-set analysis.Nat. Rev. Genet.,17, 353–364.
22. Newton,M.A., Quintana,F.A., Den Boon,J.A., Sengupta,S. and Ahlquist,P. (2007) Random-set methods identify distinct aspects of the enrichment signal in gene-set analysis.Ann. Appl. Stat.,1, 85–106. 23. Young,M.D., Wakefield,M.J., Smyth,G.K. and Oshlack,A. (2010)
Gene ontology analysis for RNA-seq: accounting for selection bias. Genome Biol.,11, R14.
24. Pickrell,J.K., Marioni,J.C., Pai,A.A., Degner,J.F., Engelhardt,B.E., Nkadori,E., Veyrieras,J.B., Stephens,M., Gilad,Y. and Pritchard,J.K. (2010) Understanding mechanisms underlying human gene expression variation with RNA sequencing.Nature,464, 768–772. 25. Benjamini,Y. and Hochberg,Y. (1995) Controlling the false discovery
rate: a practical and powerful approach to multiple testing.J. R. Stat. Soc. B. Stat. Methodol.,57, 289–300.
26. Nam,D. (2017) Effect of the absolute statistic on gene-sampling gene-set analysis methods.Stat. Methods Med. Res.,26, 1248–1260. 27. Croft,D., O’Kelly,G., Wu,G., Haw,R., Gillespie,M., Matthews,L.,
Caudy,M., Garapati,P., Gopinath,G., Jassal,B.et al.(2011) Reactome: a database of reactions, pathways and biological processes.Nucleic Acids Res.,39, D691–D697.
28. Liberzon,A. (2014) A description of the Molecular Signatures Database (MSigDB) web site.Methods Mol. Biol.,1150, 153–160. 29. Morris,A.P., Voight,B.F., Teslovich,T.M., Ferreira,T., Segre,A.V.,
Steinthorsdottir,V., Strawbridge,R.J., Khan,H., Grallert,H., Mahajan,A.et al.(2012) Large-scale association analysis provides insights into the genetic architecture and pathophysiology of type 2 diabetes.Nat. Genet.,44, 981–990.
30. Lango Allen,H., Estrada,K., Lettre,G., Berndt,S.I., Weedon,M.N., Rivadeneira,F., Willer,C.J., Jackson,A.U., Vedantam,S.,
Raychaudhuri,S.et al.(2010) Hundreds of variants clustered in genomic loci and biological pathways affect human height.Nature, 467, 832–838.
31. Cho,Y.S., Go,M.J., Kim,Y.J., Heo,J.Y., Oh,J.H., Ban,H.J., Yoon,D., Lee,M.H., Kim,D.J., Park,M.et al.(2009) A large-scale genome-wide association study of Asian populations uncovers genetic factors influencing eight quantitative traits.Nat. Genet.,41, 527–534. 32. Mishra,A., Macgregor,S., Liu,J.Z., McRae,A.F., Nyholt,D.R.,
Medland,S.E., Wray,N.R., Brown,K.M., Hayward,N.K.,
Montgomery,G.W.et al.(2015) VEGAS2: software for more flexible gene-based testing.Twin Res. Hum. Genet.,18, 86–91.
33. Subramanian,A., Tamayo,P., Mootha,V.K., Mukherjee,S., Ebert,B.L., Gillette,M.A., Paulovich,A., Pomeroy,S.L., Golub,T.R., Lander,E.S.et al.(2005) Gene set enrichment analysis: a
knowledge-based approach for interpreting genome-wide expression profiles.Proc. Natl. Acad. Sci. U.S.A.,102, 15545–15550.
34. Wood,A.R., Esko,T., Yang,J., Vedantam,S., Pers,T.H., Gustafsson,S., Chu,A.Y., Estrada,K., Luan,J., Kutalik,Z.et al.(2014) Defining the role of common variation in the genomic and biological architecture of adult human height.Nat. Genet.,46, 1173–1186.
35. Pers,T.H., Karjalainen,J.M., Chan,Y., Westra,H.J., Wood,A.R., Yang,J., Lui,J.C., Vedantam,S., Gustafsson,S., Esko,T.et al.(2015) Biological interpretation of genome-wide association studies using predicted gene functions.Nat. Commun.,6, 5890.
36. Klingseisen,A. and Jackson,A.P. (2011) Mechanisms and pathways of growth failure in primordial dwarfism.Genes Dev.,25, 2011–2024. 37. Bartholdi,D., Krajewska-Walasek,M., Ounap,K., Gaspar,H.,
Chrzanowska,K.H., Ilyana,H., Kayserili,H., Lurie,I.W., Schinzel,A. and Baumer,A. (2009) Epigenetic mutations of the imprinted IGF2-H19 domain in Silver-Russell syndrome (SRS): results from a large cohort of patients with SRS and SRS-like phenotypes.J. Med. Genet.,46, 192–197.
38. Marouli,E., Graff,M., Medina-Gomez,C., Lo,K.S., Wood,A.R., Kjaer,T.R., Fine,R.S., Lu,Y., Schurmann,C., Highland,H.M.et al. (2017) Rare and low-frequency coding variants alter human adult height.Nature,542, 186–190.
39. Schwartz,N.B. and Domowicz,M. (2002) Chondrodysplasias due to proteoglycan defects.Glycobiology,12, 57r–68r.
40. Kim,H., Kim,I.Y., Lee,S.Y. and Jeong,D. (2006) Bimodal actions of reactive oxygen species in the differentiation and bone-resorbing functions of osteoclasts.FEBS Lett.,580, 5661–5665.
41. Smith,L.B., Belanger,J.M. and Oberbauer,A.M. (2012) Fibroblast growth factor receptor 3 effects on proliferation and telomerase activity in sheep growth plate chondrocytes.J. Anim. Sci. Biotechnol., 3, 39.
42. Wu,D. and Smyth,G.K. (2012) Camera: a competitive gene set test accounting for inter-gene correlation.Nucleic Acids Res.,40, e133. 43. Szklarczyk,D., Franceschini,A., Wyder,S., Forslund,K., Heller,D., Huerta-Cepas,J., Simonovic,M., Roth,A., Santos,A., Tsafou,K.P. et al.(2015) STRING v10: protein-protein interaction networks, integrated over the tree of life.Nucleic Acids Res.,43, D447–D452. 44. Alanis-Lobato,G., Andrade-Navarro,M.A. and Schaefer,M.H.
(2017) HIPPIE v2.0: enhancing meaningfulness and reliability of protein-protein interaction networks.Nucleic Acids Res.,45, D408–D414.
45. Safran,M., Dalah,I., Alexander,J., Rosen,N., Iny Stein,T., Shmoish,M., Nativ,N., Bahir,I., Doniger,T., Krug,H.et al.(2010) GeneCards Version 3: the human gene integrator.Database,2010, baq020.
46. Sherry,S.T., Ward,M.H., Kholodov,M., Baker,J., Phan,L., Smigielski,E.M. and Sirotkin,K. (2001) dbSNP: the NCBI database of genetic variation.Nucleic Acids Res.,29, 308–311.
47. Tessneer,K.L., Jackson,R.M., Griesel,B.A. and Olson,A.L. (2014) Rab5 activity regulates GLUT4 sorting into insulin-responsive and non-insulin-responsive endosomal compartments: a potential mechanism for development of insulin resistance.Endocrinology,155, 3315–3328.
48. Huang,J., Imamura,T. and Olefsky,J.M. (2001) Insulin can regulate GLUT4 internalization by signaling to Rab5 and the motor protein dynein.Proc. Natl. Acad. Sci. U.S.A.,98, 13084–13089.
49. Moller,D.E. (2000) Potential role of TNF-alpha in the pathogenesis of insulin resistance and type 2 diabetes.Trends Endocrinol. Metab., 11, 212–217.
50. Huang,S.H. and Czech,M.P. (2007) The GLUT4 glucose transporter. Cell Metab.,5, 237–252.
51. Gaster,M., Staehr,P., Beck-Nielsen,H., Schroder,H.D. and
Handberg,A. (2001) GLUT4 is reduced in slow muscle fibers of type 2 diabetic patients––is insulin resistance in type 2 diabetes a slow, type 1 fiber disease?Diabetes,50, 1324–1329.