P
UBLIC
D
EBT IN
D
EVELOPING
C
OUNTRIES
:
H
AS
T
HE
M
ARKET
-B
ASED
M
ODEL
W
ORKED
?
Indermit Gill and Brian Pinto
Abstract
Over the past 25 years, significant levels of public debt and external finance are more likely to have enhanced macroeconomic vulnerability than economic growth in developing countries. This conclusion applies not just to countries with a history of high inflation and past default, but also to those in East Asia, with a long tradition of prudent macroeconomic policies and rapid growth. We examine why with the help of a conceptual framework drawn from the growth, capital flows and crisis literature for developing countries with access to the international capital markets ('market access countries' or MACs). We find that, while the chances of another generalized debt crisis have receded since the turbulence of the late 1990s, sovereign debt is indeed constraining growth in MACs, especially those with debt sustainability problems. Several prominent MACs have sought to address the debt and external finance problem by generating large primary fiscal surpluses, switching to flexible exchange rates and reforming fiscal and financial institutions. Such country-led initiatives completely dominate attempts to overhaul the international financial architecture or launch new lending instruments, which have so far met with little success. While the initial results of the countries’ initiatives have been encouraging, serious questions remain about the viability of the model of market-based external development finance. Beyond crisis resolution, which has received attention in the form of the proposed sovereign debt restructuring mechanism, the international financial institutions may need to ramp up their role as providers of stable long-run development finance to MACs instead of exiting from them.
World Bank Policy Research Working Paper 3674, August 2005
The Policy Research Working Paper Series disseminates the findings of work in progress to encourage the exchange of ideas about development issues. An objective of the series is to get the findings out quickly, even if the presentations are less than fully polished. The papers carry the names of the authors and should be cited accordingly. The findings, interpretations, and conclusions expressed in this paper are entirely those of the authors. They do not necessarily represent the view of the World Bank, its Executive Directors, or the countries they represent. Policy Research Working Papers are available online at
http://econ.worldbank.org.
Both authors are at the World Bank. This paper is drawn from a larger work program on sovereign debt and development in the Economic Policy and Debt Department, Poverty Reduction and Economic Management Anchor, of the World Bank. An abridged version will be appearing in a volume dedicated to an April 2005 conference on “The Financial Sector Post-Crisis: Challenges and Vulnerabilities”, organized jointly by the World Bank and The Brookings Institution. We thank Joshua Aizenman, Amar
Bhattacharya, Nina Budina, Craig Burnside, Christophe Chamley, Ajay Chhibber, Gautam Datta, Norbert Fiess, Jim Hanson, Olivier Jeanne, Himmat Kalsi, Homi Kharas, Gobind Nankani, Vikram Nehru, Anand Rajaram, Luis Serven, John Williamson, Holger Wolf, and many others for useful comments or
contributions.
WPS3674
Public Disclosure Authorized
Public Disclosure Authorized
Public Disclosure Authorized
1. INTRODUCTION
Sovereign debt can help developing countries. It enables their governments to facilitate growth take-offs by investing in a critical mass of infrastructure projects and in the social sectors when taxation capacity is limited, or when the alternative would be to print money and
compromise macroeconomic stability.1 Debt also facilitates tax smoothing and counter-cyclical fiscal policies, essential for reducing output volatility; and it permits an equitable alignment of benefits and costs for long-gestation projects by shifting taxation away from current generations.
This is what theory tells us. And there is every reason to believe that governments which borrow and spend prudently will reap these benefits in practice. But we also know that in
practice, there has been a profusion of costly macroeconomic crises during the 1990s with public debt either being a central cause, e.g., Russia 1998 and Argentina 2001, or else absorbing the brunt of the impact, e.g., Indonesia, Korea, Malaysia, and Thailand during 1997-98. And the external debt crisis of the 1980s and the now-controversial financial liberalization of the early 1990s have raised serious questions about the benefits of market-based external finance for developing countries with access to the international capital markets , called 'market access countries' or MACs. These are the countries we look at in this paper (see Annex Table A).
In the face of mounting evidence that access to the international capital markets and rising public debt are more likely to have enhanced vulnerability than growth, we take a closer look at public debt in MACs and attempt to answer three questions:
• What are the chances of a generalized debt crisis as in the 1980s? • Is public debt constraining economic growth?
• What should be done about public debt in developing countries?
Governments borrow in principle to finance public goods that increase welfare and promote growth. The spending has to be financed by taxation, through seignorage, or with debt. As Box 1 explains, there are circumstances in which sovereign debt makes sense. The optimal debt literature treats debt and taxes as intertemporal substitutes with Ponzi games ruled out.2 This is done by constraining the present value of debt to be less than that of taxes, which excludes unsustainable debt paths and crises. The optimality of debt is derived from that of taxation.3 Where taxes are nondistortionary (viz., do not alter the incentives embedded in relative prices) and satisfy Ricardian equivalence (viz., only the present value of taxes matters), the level and path of debt are indeterminate. When taxes are distorting (viz., change incentives and involve collection and enforcement costs), the path of taxes and hence that of debt matters. In this case, tax rates may have to be smoothed to minimize deadweight losses, and debt is a balancing item subject to the present value constraint mentioned above. If there is uncertainty, then tax rates may have to be smoothed over different states of nature, and debt with state-contingent payoffs may be needed.
1
We don’t know exactly how growth takeoffs occur; but it is reasonable to believe that a minimum amount of infrastructure and human capital would be necessary.
2
An example of a Ponzi game is a government running primary deficits and rolling over debt while real interest rates exceed growth rates, so that the debt-to-GDP ratio grows without bound. This is
unsustainable and will eventually result either in a burst of inflation—the unpleasant monetarist arithmetic of Sargent and Wallace (1981)—or default.
3
Growth seldom enters the picture explicitly; indeed, most theoretical models do not include a direct link between government debt and growth. Long-run growth is typically taken as exogenous and, with insolvency ruled out, the problem becomes one of allocating taxes over time to minimize deadweight losses from taxation given initial debt. However, unsustainable debt levels can lower growth by raising real interest rates and crowding out the private sector. And sovereign debt can facilitate the achievement of growth, for example, by enabling the optimal social provision of public goods such as education and infrastructure when taxation capacity is limited today but expected to be higher in the future. It also helps when public investments spur private investment through complementarities. But this critically assumes that only those public projects with economic returns exceeding the cost of borrowing are selected; and that the government subsidizes such projects when their financial return is lower than the cost of funds through redistributive taxation (as opposed to further borrowing): in other words, that
governments play their assigned role.
Box 1. Why Governments Borrow
A government can finance its spending and development efforts by borrowing, by taxing output, or by printing money (the so-called “inflation tax” or seignorage)1/. Three reasons explain why public debt may be better than taxation:
Tilting: Allowing a more equitable manner in which country can exploit investment opportunities with long gestation periods. In a growing economy, it would be inequitable to tax current (poorer) generations to pay for investments that will benefit future (richer) generations.
Smoothing: Allowing a more efficient manner for conducting counter-cyclical policies or meeting emergency spending needs. Raising and lowering taxes frequently may entail efficiency losses and generate economic uncertainty.
Stability: Excessive reliance on printing money could lead to high and volatile inflation, which obscures the information content of relative prices and hurts investment.
But debt has eventually to be repaid—borrowing is simply postponed taxation. Hence, the use to which funds are put and the returns relative to the cost of borrowing become crucial. Computing these returns is not easy. For example, if the government invests in infrastructure, the returns include not just the user fees but also higher future taxes if the infrastructure investments lead to faster growth.
1/ Printing money is not always inflationary, as in a growing economy where real income is rising.
The only explicit debt-growth theoretical link is that between external borrowing (public or private) and growth, the assumption being that if the marginal product of capital is higher than the world interest rate for developing countries, then such countries would benefit from external borrowing (Eaton (1993)). But even here, external debt helps to exploit the existinggrowth potential of the country; it does not enhance it. Theoretically, therefore, the only guideline one finds is that the rate of return on spending should exceed the marginal cost of borrowing on the assumption that debt is eventually repaid.4
A more recent debate stimulated by the growth slowdown in the European Monetary Union (EMU) focuses on the composition of government spending. Blanchard and Giavazzi (2003) argue that if the EMU’s Stability and Growth Pact targets of a fiscal deficit of 3 percent of GDP and public debt of 60 percent of GDP are achieved by cutting public investment, this would reduce long-run growth and eventually lead to rising fiscal deficits and debt—as observed in key EMU countries. Their point is that the pact “puts no pressure on EMU members to reduce current government spending, so as to lower tax rates and make room for higher public investment”. In
4
The economic rate of return (ROR) on some types of public spending, e.g., on power plants, is easier to compute than on others, e.g., education—which is not to say that the economic ROR on power plants is easy to compute.
this framework, taxes must eventually cover both government primary current spending (i.e., non-interest spending unrelated to public investments) and the subsidy on public investment needed for projects where the economic rate of return (ROR) exceeds the interest rate, but the financial ROR does not. In particular, the subsidy for such projects should not be financed by additional borrowing, which might put public debt on an unsustainable course. The implicit assumptions are that there is no waste in government current spending, that borrowing is only for worthwhile public investment projects (economic ROR exceeds the interest rate) and that any investment subsidy required (difference between the interest rate and the net financial ROR) comes strictly from taxation. Meeting these conditions is likely to require higher public saving. These ideas are applicable to the concept of ‘fiscal space’ that has been raised in the context of some MACs.
Table 1 lists the top ten MACs—India, China, Brazil, Mexico, Korea, Turkey, Indonesia, Russia, Argentina and Poland—in terms of public debt (external plus domestic). In 2002, their combined public debt was $2.2 trillion or more than two-thirds of total MAC public debt. These countries also accounted for about $1.4 trillion in external debt—that is, public plus private debt, held by external creditors. When public debt is expressed as a ratio of GDP, the top eleven MAC debtors in 2002 were Lebanon, Jamaica, Argentina, Uruguay, Jordan, Turkey, India, Pakistan, Morocco, the Philippines and Indonesia, with ratios ranging between 90 and 180 percent.5 All but three countries had higher public debt-to-GDP ratios than a decade earlier in 1992, the year by which the Brady Plan resolution of the 1980s debt crisis had been implemented for the major participating countries. In the three exceptions, Jamaica, Jordan and Morocco, the public debt-to-GDP ratio was exceptionally high in 1992 and had come down only modestly by 2002.
Interestingly, of the 17 countries in Table 1, China was the only one not to experience a debt or balance-of-payments crisis during the 1980s or later.6 The paper pays special attention to many of the countries listed in the table.
Table 1. Sovereign Debt—Big MACs and Debt Majors
Total Public Debt ($ Billions) Public Debt to GDP (%)
1992 2002 1992 2002 India 156 380 Lebanon 70 177 China 68 366 Jamaica 181 149 Brazil 165 284 Argentina 26 126 México 118 280 Uruguay 48 109 Korea 61 232 1/ Jordan 167 100 Turkey 65 173 Turkey 40 94 Indonesia 56 149 India 74 81 Russia 12 118 Pakistan 81 90 Argentina 59 117 Morocco 102 90 Poland 44 72 Philippines 81 89 Indonesia 40 86 1/Data for 2001.
Note: Public debt is defined to be public and publicly guaranteed external debt plus domestic public debt. Source: Global Development Finance (World Bank), World Economic Outlook (IMF) and staff estimates.
5
There are varying definitions of the numerator and the denominator across countries. Turkey’s debt ratios are reported as a share of GNP, and Brazil and Turkey both report public debt net of central bank assets.
6
Lebanon remains an enigma. In spite of being an outlier in its public debt-to-GDP ratio, it did not suffer a debt default or financial system crisis. But its exchange rate collapsed during 1986-87 and 1992 as a result of domestic credit-financed expansions in government spending which depleted reserves, akin to a first generation crisis (see Box 3 below). It also benefited from a pubic debt reprofiling under the auspices of the Paris II Conference held in November 2002 (“One-Year Progress After Paris II”, Special Report, Ministry of Finance, Republic of Lebanon, December 2003.)
The next section presents a framework for examining sovereign debt and external finance from the perspective of vulnerability and growth. This is followed by a discussion of the main factors explaining episodes of either large and abrupt increases or decreases in the public debt-to-GDP ratio in MACs. This feeds into answers to the three questions posed at the outset. The last section concludes and questions the viability of market-based development finance.
2. A CONCEPTUAL FRAMEWORK FOR DEBT AND DEVELOPMENT The analytical framework for MACs presented here surveys three strands of the economic literature: (i) neoclassical growth theory and its progeny, endogenous growth theory; (ii) an empirically-inspired literature on external capital flows; and (iii) an empirically-driven literature on macroeconomic crises. The survey leads to the following main findings:
• MACs have not proved adept at using sovereign debt, either because of weaknesses in the countries themselves or deficiencies in the market. With official finance shrinking as a share of the total, one has to ask if reliance on external market-based sources of finance constitutes a viable model of development.
• The crises of the 1980s and 1990s, even when day-to-day macroeconomic policies have been conservative as in many East Asian countries, have highlighted the importance of the
government’s intertemporal budget constraint. This is where the chickens come home to roost, even if their origin is in the private sector. Governments must be ready to play a shock-absorbing role, in part because of unanticipated shocks, in part because of missing insurance markets. This has a corollary: the government needs a strong balance sheet and debt headroom.
• Political economy factors explain much better why countries overborrow and end up in crises. It is difficult to think of pure economic reasons why crises occur.
Following the survey, we discuss conceptual links between public debt and growth, and alternative ways of interpreting MAC debt.
2.1 Growth Theory, Capital Flows and Crises Growth Theory: Neoclassical and Endogenous
In neoclassical growth theory, e.g., the Solow-Swan model, the long-run growth rate is constant and is equal to the growth rate of the population or labor force under the assumptions of exogenously given technology, constant returns to scale and, critically, diminishing marginal returns to capital. In this framework, similar countries will converge to the same steady state marked by zero per capita growth—because all variables grow at the same rate as population. The challenge is to find and adhere to the so-called “golden rule” of capital accumulation, i.e., find that savings rate which maximizes per capita consumption across generations.7
An implication is that countries with lower capital per worker will grow faster and eventually converge to the same steady state as countries with higher capital per worker, the so-called “absolute convergence hypothesis”. As rich countries tend to have higher capital per worker, and therefore a lower marginal product of capital under the neoclassical assumptions, freeing up capital movements will lead to a mutually beneficial movement of capital from rich to poor countries, facilitating convergence. This idea is expressed succinctly in Eichengreen and Mussa (1998).
“The classic case for international capital mobility is well-known but worth restating. Flows from capital-abundant to capital-scarce countries raise welfare in the sending and receiving countries alike on the assumption that the marginal product of capital is higher in the latter than in the former. Free capital movements thus permit a more efficient global allocation of savings and direct resources toward their most productive uses.”
7
Absolute convergence has not been supported by the data, leading to the notion of conditional convergence, that is, once the differences in steady-states across countries are controlled for, poorer countries will grow faster. Hence, one might still hold out hope that in a world of liberalized capital flows, capital would flow from rich to poor countries, augmenting their capital base and spurring growth. However, empirical evidence is to the contrary. Even though capital flows to middle income countries increased rapidly during the 1990s, “..from less than $40 billion per year over the period 1983-1990 to an average of about $200 billion a year”
8
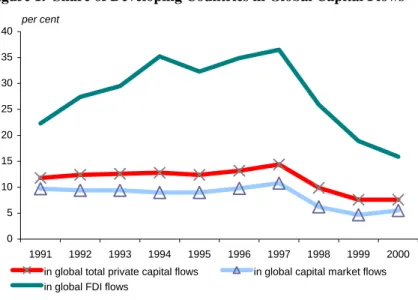
during the first half of the 1990s—the lion’s share of capital flows are among rich countries, not from rich to developing countries. Developing countries’ share in global private capital flows was just 12 percent in 1991, and fell to 8 percent by 2000 (see Figure 1). 9
Figure 1. Share of Developing Countries in Global Capital Flows
One explanation for this unexpected pattern of capital flows is that the assumed
diminishing marginal returns to capital posited by neoclassical growth theory may not obtain in practice. This is the core idea of endogenous growth theory, namely, that technological progress may be linked to capital accumulation, and that human capital should also be included, both of which favor rich countries. The upshot is that the income gap between rich and poor countries may not narrow. This is a simplistic statement of a complex debate about economic growth. The point is that many factors, economic and non-economic, could intervene to lower returns to capital in poorer countries below those in richer ones, a theme that is pursued below. Higher Capital Flows: Enhanced Growth versus Enhanced Vulnerability
The observation that rich-to-poor capital flows are minor compared to those among rich countries has spawned a number of explanations, which are summarized in Box 2. The
explanations center on the idea that risk-adjusted returns in the poorer countries may actually be lower than those in the richer countries because of institutions, incentives and productivity.
8
Keynote address by the General Manager of the Bank for International Settlements, Mr. Andrew Crockett, to the 33rd Seacen Governors’ Conference in Bali on 13/2/98.
9
Global Development Finance (2001).
0 5 10 15 20 25 30 35 40 1991 1992 1993 1994 1995 1996 1997 1998 1999 2000 per cent
in global total private capital flows in global capital market flows in global FDI flows
Box 2. Why Capital Flows Diverge From Their Predicted Direction and Volumes
Theory says capital should flow from capital-abundant, rich countries to capital-scarce, poor countries. In practice, however, capital flows among rich countries dwarf those from rich to poor countries in volume. Why? Because of factors reducing risk-adjusted returns in poor countries, the default problem, and the limited range of instruments available in international financial markets.
• Risk-adjusted returns to capital in poor countries may be lower than in rich countries, contradicting the law of diminishing returns. Factors such as human capital, the quality of institutions and political and policy predictability may operate to lower returns and raise risks notwithstanding relative capital capital-scarcity.1/ Practice highlights the key role of institutions, incentives and productivity.
• Default risk, and the difficulty of securing legal redress against both foreign private and especially sovereign borrowers for enforcement of property rights, might also explain the home bias in lending and portfolio allocations of rich countries.
• The virtual absence of debt instruments that would adjust payments to shocks stemming from the terms-of-trade or world interest rates might appear surprising in view of the high levels of
sophistication in world financial markets today. GDP-indexed bonds do not as yet exist while currency risk is typically borne by the borrower. One impediment might be moral hazard stemming from the ability of sovereign borrowers to influence the indexation variable, although this can be overcome by appropriate choice of an exogenous variable. Yet such instruments do not exist.
1/ See, for example, Lucas (1988) and Mankiw, Romer and Weil (1992).
Source: Sturzenegger and Wolf (2004).
Moreover, even the spurt of capital flows into MACs following the Brady Plan resolution of the 1980s debt crisis, and subsequent widespread liberalization of capital markets during the 1990s, may not have boosted investment and growth. Using a sample of 60 developing countries, one study found that, while the growing financial integration with the rest of the world has increased access to foreign private capital, the relationship between foreign capital and domestic investment has weakened, reflecting changes in the composition of inflows, offsetting outflows, and increased foreign currency reserve requirements.10 Another study found that a substantial share of the surge in capital inflows has been channeled into reserve accumulation, and that an equal share found its way back out of the country. Using investment regressions, this study found that FDI shows the strongest link with aggregate investment, with a coefficient close to one.11
A third study fails to find persuasive evidence of a “growth bonus” associated with an increased share of foreign saving in financing the domestic capital stock in a wide range of developing countries. The evidence suggests the opposite: in a sample of 47 countries, those which relied more on national savings (a higher “self-financing ratio”) grew much faster
throughout the 1990s.12 This result persists even when the impact of the quality of institutions on growth is allowed for. These findings are consistent with the idea that financial integration may have facilitated diversification of assets and liabilities, but failed to offer net new sources of financing capital in developing countries.13
10
Mody and Murshid (2002).
11
Bosworth and Collins (1999).
12
Aizenman, Pinto and Radziwill (2004). See also Aizenman (2005), which contains a comparison of Korea and Chile.
13
Based on a regression of average per capita growth rates during the 1990s on the level, square and cube of the average self-financing ratio and its standard deviation.
Two other recent, related studies are worth mentioning. One finds that moving from complete financial autarky to complete financial openness would augment consumption by about 1 percent per year or 10-20 percent of initial GDP depending upon the discount rate; the actual benefit would be smaller as most countries are not financially autarkic to start with.14 On the other hand, if a developing country were able to achieve 50 percent of the total factor productivity level of the USA, the effect would be of the order of 200-300 percent of initial GDP. The
mechanism through which financial liberalization enables this is not obvious, unless financial globalization results in countries becoming irrelevant for asset prices, portfolios and firm
financial policies, the so-called “country irrelevance” proposition. This would presumably speed up convergence of TFP levels and not just growth rates. The other study argues that such financial globalization is limited by agency problems that arise because rulers of sovereign states and corporate insiders pursue their own objectives at the cost of outside investors.15
Table 2. Major recipients of net international resource flows Country (Year of Crisis)*
Total net resource flows
1990-1996 Share of total flows, %
US$ billion
Share of 1996 GDP
%
Debt FDI Equity
portfolio China 234 29 29 67 3 México (1994/1995) 118 36 35 39 26 Brazil (1999) 90 12 45 27 28 Argentina (2001/2002) 71 26 45 39 16 Korea (1997) 68 13 59 12 29 Malaysia (1997) 63 63 18 47 35 Indonesia (1997) 55 24 50 35 13 Thailand (1997) 52 29 58 27 13 India 43 11 46 16 30 Russia (1998) 32 8 57 16 7 Poland 26 20 6 49 4 Chile 25 37 29 56 13 Turkey (2000/2001) 22 12 49 23 11 Hungary 20 45 25 68 3
* Year(s) of macroeconomic crisis are indicated in brackets. Source: World Bank (2005).
Lastly, there is a high correlation among the major country recipients of capital flows during the 1990s and the occurrence of crises, as seen in Table 2.
Crisis Literature: Three Generations and Counting
There is a close link between the actual unfolding of macroeconomic crises with their growing complexity and the theoretical literature, leading so far to three generations of crisis models. These are described in Box 3.
14
Gourinchas and Jeanne (2004) develop a simulation model to calculate the benefits from financial liberalization to a developing country in a neoclassical setting.
15
Box 3: Three Generations of Crisis Models
The first generation model attributes balance of payments crises to budget deficits financed by domestic credit in a fixed exchange rate regime with perfect capital mobility. This leads to current account deficits and a steady loss of reserves at a rate equal to the pace of credit creation; but a speculative attack resulting in a discrete exhaustion of remaining reserves occurs before these would have been used up based on credit expansion alone. A float will then be forced. Such macroeconomic overexpansion and overvaluation were the standard diagnoses of balance of payments crises in developing countries before 1993, and were the basis of most adjustment programs administered by the International Monetary Fund. The international debt crisis of the 1980s is an example.
The second generation argues that there are “crisis” and “no-crisis” multiple equilibria consistent with unchanged fundamentals. This approach was inspired the European Exchange Rate Mechanism (ERM) crises of 1992--93. The speculative attack on France in 1993 was puzzling, because the government had over the preceding years succeeded in attaining a level of macroeconomic discipline comparable to that of Germany, its partner in the ERM. Moreover, after the bands were widened, the crisis passed without a substantial further depreciation of the franc, even though there had been no tightening of macroeconomic policy in the meantime. How then could the fundamentals have been responsible for the earlier speculative pressure? The second generation argument is most simply illustrated by a “prisoners’ dilemma.” Consider two speculators. Each realizes that if the other sells, the resulting depreciation will reduce the value of his holdings of domestic currency. Neither wants to stand pat if the other might sell. One equilibrium is for both to sell, even though the economy may be worse off after the devaluation.
The third generation model was developed as an explanation of the East Asian crisis of 1997-98, where expansionary macroeconomic policy was not the problem, but a different kind of weakness in fundamentals appeared: structural distortions in the financial system combined with implicit exchange rate guarantees. Well-connected banks and businessmen are able to borrow in foreign currency to finance risky projects, including those in the non-traded sector such as real estate development or construction of new factories in the already-glutted steel industry. They are aware of the risk, but reasonably confident they will be bailed out by the government if things go badly. The timing of the attack again stems from the calculations of speculators who worry that if they wait too long, there will not be enough foreign exchange reserves to go around. But there is a key difference from the first generation model, where reserves fall in the run-up to crisis. In this case, liabilities artificially encouraged by moral hazard rise to a point at which investors suddenly cash in their investments, fearful that if they wait any longer, they might not be able to get their money out. The speculative attack forces the central bank to abandon the exchange rate.
Source: Frankel and Wei (2004).
The models have three implications for MACs:
• First, it is difficult to predict exactly when and, equally importantly, why the next crisis will occur and what shape it will assume. For example, the Lawson Doctrine posited that private external debt did not pose the same threat that public external debt did, presumably on the assumption that private-to-private flows would be better monitored and used. But this doctrine was proved wrong by the East Asian crisis of 1997-98. Similarly, how crises will be resolved is not clear. The comprehensive Brady Plan response to the 1980s debt crisis has given way to an ad hoc country-by-country approach.
• Second, crises of the first and third generations, which might be regarded as the most pertinent for (non-G-7) MACs, have highlighted the importance of the government’s intertemporal budget constraint. While the 1980s debt crisis, Russia 1998 and Argentina 2001 all involved overtly expansionary macroeconomic policies and/or explicitly
unsustainable public debt dynamics, the East Asian crisis involved large fiscal costs associated with financial sector bailouts. These were contingent liabilities which became actual liabilities once the implicitly fixed exchange rate pegs were abandoned, leading to
distress in the enterprise and financial sectors as a result of their balance sheet currency mismatches. Thus, it is not enough to look at fiscal deficits and explicit public debt dynamics (which were benign in the East Asian countries). Contingent liabilities are also a factor. • Third, in view of the disappointing experience with capital flows, external debt and public
debt over the 1980s and 1990s, economists might be forgiven for being suspicious—not because debt is bad, but because either MACs do not seem equipped to use it well, and/or the international capital market is “unforgiving”, to borrow Guillermo Calvo’s expression. The literature has turned to a discussion of why debt and capital flows make countries vulnerable. These include debt intolerance and original sin, which are discussed in section 2.3 below. 2.2 Public Debt and Economic Growth
We invoke results from cross-country empirical work in three areas: macroeconomic factors in growth, volatility and growth, and debt and volatility. The problems encountered in such work are well-known: how to control for country-specific factors, endogeneity and omitted variables. Causality is hard to establish, and suitable instrumental variables are difficult to find. Subject to these caveats, we use results from these three areas to link public debt and growth.
The first result is that growth, g, is negatively related to inflation,
π
, and fiscal deficits, FD: (1) ( , ) ) ( ) (− − = g FD gπ
.The second and third are from the volatility literature: growth is negatively affected by output volatility,
g
σ ; and further, thatg
σ can be decomposed into a crisis component, i.e., deep recessions, and one that can be attributed to normal cyclical fluctuations:(2) ( ) ) (− = f gσ g ; (3)
g
σ=
g
σ,crisis+
g
σ,normal .The motivation for (3), as we shall see below, is that most of the damage to growth comes from the crisis component of volatility. The last result is from the debt literature, which says that the optimal debt-to-GDP ratio (from the perspective of consumption smoothing) increases with volatility but goes down with sovereign risk, which itself rises with volatility, leading to an ambiguous link between debt and volatility:
(4)
(
,
(
)),
) ( ) ( * σ σSR
g
g
d
d
− +=
where
d
*stands for optimal debt and SR for sovereign (or default) risk.A simple way of thinking about the link between public debt and growth is that once the debt-to-GDP ratio crosses a (country-specific) threshold, it increases the chances of a crisis and enhances volatility, lowering growth. Alternatively, the higher fiscal deficits are, and the more volatile output is (implying lower growth), the higher is the actual public debt-to-GDP ratio likely to be (for given inflation targets) and the lower the sustainable level of debt. Each of these areas is now discussed.
The macroeconomic literature argues that stability is good for growth. Fischer (1993, p. 487) notes that the “macroeconomic framework can be described as stable when inflation is low and predictable, real interest rates are appropriate, fiscal policy is stable and sustainable, the real exchange rate is competitive and predictable and the balance of payments is perceived as viable”.
His paper focused on three variables: inflation, fiscal deficits and the black market premium on foreign exchange, and their effects on growth in a cross-country study covering the period 1960-88. One finding was that a “stable macroeconomic environment, meaning a reasonably low rate of inflation and a small budget deficit, is conducive to sustained growth” (italics added). On causality, Fischer concluded that the weight of evidence pointed to a flow from high inflation to low growth, rather than vice versa. However, he also noted that low inflation is not necessary for growth, although high inflation is not consistent with sustained growth.16
Abstracting from the econometric problems, one may summarize Fischer’s main result as in equation (1) above.17 The channels through which inflation reduces growth, identified in Fischer (1993), include reduced investment as well as a reduced rate of productivity growth, while larger budget surpluses are associated with more rapid growth through greater capital accumulation and greater productivity growth. Interestingly, “debt dynamics” is mentioned only once, though crucially, in Fischer (1993), while noting that a high deficit may be consistent with low inflation for a while; but that a more detailed assessment of debt dynamics may be needed to see if the deficit is sustainable and therefore consistent with macroeconomic stability. This brings in the government’s intertemporal budget constraint (GIBC), which pulls together the fiscal deficit (primary fiscal balances and interest payments), inflation (seigniorage) and growth. It also properly measured pulls in contingent liabilities associated with state enterprise losses, borrowing guarantees and poor supervision of banks, in short, the potential impact of soft budget constraints for banks and enterprises. Box 4 illustrates these linkages with the stabilization experiences of Poland and Russia during the 1990s.
Box 4: Poland and Russia: Contrasting Stabilizations
Poland successfully stabilized between 1990 and 1999. It initially used the nominal exchange rate as an anchor for the price level but abandoned its fixed peg with the dollar after 17months when competitiveness became an issue. Rapid inflation reduction was never an obsession; it took eight years to attain single-digit inflation. Instead, the focus was on reducing the fiscal deficit and hardening enterprise budget constraints while maintaining a competitive real exchange rate. Growth rates increased and, aided by the resulting higher taxes and expenditure control, deficits and inflation came down gradually but credibly.
The importance of microeconomic hard budgets for growth and lasting stabilization is illustrated by the contrasting experience of Russia between 1995 and 1998. Russia succeeded in its quest for single-digit inflation by February 1998—its exchange-rate based stabilization was launched in mid-1995; but suffered a macroeconomic crisis six months later. The issue turned out to be the “soft budgets” implicit in the “non-payments” system, which mushroomed during the stabilization program of 1995-98. The manufacturing sector received subsidies equal to 7-10 percent of GDP, financed by a combination of government
borrowing and transfers (in the form of unpaid bills) from Gazprom, the gas monopoly and RAO UES, the electricity monopoly. Trying to stabilize in this milieu required high real interest rates, which only prodded enterprises to economize even more on cash transactions and run further arrears. The government also participated in this process. More non-payments meant lower taxes and rising government debt and interest rates and hence poor growth, which fed on each other leading to the 1998 crisis.
These experiences underline that sustainable inflation reduction ultimately depends upon keeping fiscal deficits and public debt dynamics under control. This is turn depends upon adequate generation of fiscal revenues, which requires solid micro foundations for growth, namely, healthy enterprise and financial sectors based on hard budget constraints and competition.
16
Other notable studies include de Gregorio (1993) and Bruno and Easterly (1998), who argued famously that once inflation crossed 40 percent per year, growth would not be sustained .
17
Output volatility is also known to exert a causally negative effect on long-run growth, an empirical result that is the basis of the volatility literature and its fundamental claim that business cycle volatility and the trend growth rate are not separate phenomena but causally linked. How is public debt linked to output volatility? One can think of two channels: macroeconomic
uncertainty and its effect on investment; and the greater vulnerability to crises. A highly indebted country is more likely to experience a macroeconomic crisis in the face of a terms-of-trade shock or a reversal of capital flows, other things being equal. Such crises tend to be comprehensive, typically involving exchange rate collapses, runs on banks and sometimes, sovereign default. Deep recessions often follow. This is material because when output volatility is calculated over long periods, it averages over periods of normal cyclical fluctuation and periods of crisis. When Hnatkovska and Loayza (2004) decompose volatility into a crisis component that captures the effect of deep recessions and a component that captures normal cyclical fluctuations, cross-country regressions over the period 1960-2000 show it is crisis volatility that truly harms long-run growth. These results place a premium on financial, fiscal, and institutional development and the avoidance of crisis as key factors in alleviating the negative impact of volatility on growth. 2.3 MAC Debt—Help or Hindrance?
Expressions like “debt intolerance” and “original sin” may not have found their way into the titles of recent papers on sovereign debt if the reforms of the 1980s and the liberalization of capital markets in the 1990s had led to more positive outcomes.18 The question therefore is why more positive results were not secured. The following reasons come to mind:
• Growth prospects of countries were overestimated, leading to excessive borrowing. • Access to debt led to procrastination by governments on necessary but difficult reforms. • Debt was misused, either facilitating capital flight or being invested in bad projects. • Available market-based debt instruments create a predisposition to crisis.
In short, the literature tends to be negative on debt because MACs have appeared unable or unwilling to make good use of public debt, not because debt per se is bad.19 This section assesses three related questions: Whose fault is this? Will new instruments help? Are IFIs using a flawed framework for assessing how much countries should borrow?
Debt Intolerance vs. Original Sin: Whose Fault is it?
In examining the association of poor results with MAC debt, two polar views have emerged:
• “Debt intolerance” proponents argue that it is the fault of MACs themselves, especially those with a history of default and high inflation and weak fiscal and financial institutions. These countries cannot handle debt without becoming vulnerable to a crisis once external (public plus private) debt crosses 15-25 percent of GDP—a threshold much lower than actual external debt levels for big MACs. As similar arguments would apply to public debt, the policy prescription would be to lower indebtedness. Therefore, if debt is a binding constraint
18
Reinhart, Rogoff and Savastano (2003), and Eichengreen, Hausmann and Panizza (2002), respectively. IMF (2003a), chapter III, also asks whether public debt in MACs is too high.
19
An analogy many of us may be uncomfortably familiar with: the doctor says, “Lose weight if you want to live longer.” This doesn’t mean food is bad for us, only that we need to eat less.
on growth—ruling out the possibility of “growing out of the debt problem”—countries would need to either run larger primary fiscal surpluses in the hope of lowering interest rates, or face another round of devaluation and default.
• “Original sin” proponents argue that it is not the fault of MACs, but their inability to borrow long-term in their home currency in the external markets. This creates a currency mismatch which increases output volatility and vulnerability to crisis. This mismatch would typically lead to a big increase in the debt-to-GDP ratio in the event of a real exchange rate collapse. The proponents further argue that the inability to issue long-term debt in the home currency is unrelated to domestic policies and institutions; this missing market stems instead from capital market imperfections, network externalities and transactions costs. The policy
recommendation is that the IFIs and the G-10 kick-start the market by issuing debt
denominated in an index of emerging market currencies and then arrange swaps with MACs to reduce or eliminate currency mismatches.
In assessing the original sin hypothesis, Goldstein and Turner (2004) agree that currency mismatches pose a threat, but disagree that they are exogenous to a particular country situation and therefore require an international solution. Their solution is to improve domestic policies— such as adopting flexible exchange rates to create more awareness of exchange risk, and more prudent macroeconomic policies more generally—and strengthen financial institutions in order to improve domestic financial intermediation while enabling strict oversight and control of currency mismatches. There is no quick fix; a decade may be required to secure tangible and lasting improvements. The main role for the IFIs would be to monitor and report currency mismatches in their publications, and if deemed excessive, require a reduction over the medium term as a condition for IMF loans. This set of prescriptions harks back to the debt intolerance argument, although it presents a more optimistic view in that countries can overcome the mismatch and vulnerability in a reasonable time-frame.
Liquidity versus Solvency: Will New Instruments Help?
A recent report (IMF (2004)) reinforces the relative optimism of Goldstein and Turner. It lists several MAC successes in moving from high inflation and poor sovereign debt structures to debt tolerance and better debt structures (i.e., more non-indexed, long-term local currency debt) over periods of a decade or two. It identifies credible fiscal stabilization as a key prerequisite. The success stories include Chile, Israel, Mexico and Poland. The report cautions that no amount of financial engineering can substitute for sound macroeconomic policies—fiscal policy in particular—but nevertheless argues for less risky debt instruments.
One example is GDP-indexed bonds. Interest payments would be linked to real GDP growth, rising when the growth rate exceeds its trend level and vice-versa. 20 The proponents identify three advantages: reduction in the volatility of debt/GDP ratios for debtor countries, less need for disruptive adjustments in the primary fiscal balance as interest payments adjust over the growth cycle, and diversification opportunities for global investors. Apart from the difficulty associated with creating a market for a new instrument which investors might find complex, other practical issues include deciding who will calculate GDP growth and dealing with the potential to manipulate it, although incentives for the latter are diminished by the observation that politicians like high growth.
20
In assessing such proposals, three sets of issues arise. First, what problem is being addressed, liquidity or solvency? Krugman (1988) noted that that “There is no such thing as a pure liquidity problem; it must arise because of doubts about solvency.” It is not clear why a government which has achieved credible fiscal stabilization would want to issue GDP-indexed bonds. It could simply go to the market if it faced a temporary liquidity crunch and repay the loan when times improved. Second, for such an instrument to be effective, it would need to have a long enough maturity to take advantage of both up and down cycles.21 And third, to be credible, it might have to be issued in an up-cycle, otherwise investors might fear that governments which are happy to service the debt when interest rates are low might default when the up-cycle appears, especially if it is prolonged; they might be hard put to explain politically why they are paying such high interest rates on their debt. There are thus many issues to be considered in addition to overcoming barriers to financial innovation.
Fiscal Space vs. Crowding Out: Is the IFI Macroeconomic Framework Wrong?
The ‘fiscal space’ hypothesis has grown out of the position that the design of the fiscal adjustment programs in Latin American countries which suffered debt crises over the past two decades may have been self-defeating. This is because public investment programs were cut to the bone, creating infrastructure gaps that could have hurt growth and thereby compromised the attainment of debt sustainability. The idea is succinctly expressed by Calderon, Easterly and Servén (2004), page 133: “…fiscal adjustment through public infrastructure compression can be largely self-defeating in the long-run, because of its adverse effect on growth and hence on the debt-servicing capacity of the public sector”. The authors fault the World Bank and IMF for focusing on short-run stabilization, fiscal deficits and gross public debt at the expense of long-run solvency defined by net debt and the government’s intertemporal budget constraint.
The argument is based on the idea that while public investment in infrastructure has the immediate effect of raising the primary deficit, it also raises output and hence taxes while contributing user charges. But the most important effect stems from raising the growth rate, which could happen for example if private investment and public infrastructure investment are complements. Looking at the fiscal deficit captures only the immediate impact on the primary deficit, but focusing on the government’s intertemporal budget constraint (GIBC) captures all three. The authors present evidence to show that over one third of the relative output gap
between Latin America and the East Asian tigers over 1980-97 is attributable to the emergence of an infrastructure gap, though they also note that only a small part of the decline in infrastructure spending in Latin America can be associated with cuts in fiscal deficits, and that measures of infrastructure quality and efficiency are not included in arriving at this number.
While it is correct to argue for a focus on the GIBC and to warn against the presumption that private infrastructure spending will supplant public spending, there are concerns that need to be addressed. The most important are factors other than infrastructure spending which also affect the GIBC; the role played by the market in both financing government spending and acting as an arbiter of debt sustainability; and political economy considerations. Each is now discussed.
An objection one might raise is that if the GIBC (quite rightly) is to be the focus of attention, then why not examine all its facets, including revenue mobilization—a key topic in many highly indebted countries—the pricing and regulation of infrastructure services, structural
21
Indeed, it is not obvious how one would fix the maturity of GDP-indexed bonds—they might need to be designed as perpetual instruments, much like equity.
reforms to promote growth, measures to promote creditworthiness, measures to restrict contingent liabilities in the financial and pension systems. Why single out infrastructure spending?
In the Easterly-Servén framework, there is no mention of the international debt markets and the role they play in determining the level of sustainable debt; sovereign (default) risk is abstracted from and the discount rate is taken as given. But if the debt market is signaling high levels of default risk, then a country may have to find a way to lower indebtedness before ramping up infrastructure spending. There are two reasons for doing this. First, taking on additional debt for new infrastructure investments when indebtedness and default risk are high leaves little room for error—but infrastructure projects are both long-gestation and risky. Second, a considerable amount of fiscal space can be created by improving creditworthiness and lowering bond spreads and interest rates, which has a direct impact on the GIBC as well as an indirect impact through private sector investment and growth.22
The alternative would be to cut current spending and preserve infrastructure spending. In assessing why this does not happen, the analysis would benefit from more attention to political economy.23 This could affect the GIBC and decisions on both spending composition and revenue in important ways. First, if politicians have a high subjective discount rate, they may prefer to preserve current primary spending at the expense of infrastructure, notwithstanding the long-term harmful consequences for the GIBC. They may also prefer to cut infrastructure spending than raise taxes or user charges. Second, as Easterly and Servén note, the cash return on infrastructure investments must exceed the discount rate for government net worth to go up. The corollary is that cuts in infrastructure spending will actually strengthen solvency if this condition is violated. While it is correct that “..fiscal policy can be designed to capture a share of the high social returns to infrastructure spending”24, in practice infrastructure services may be mispriced, e.g., by
providing free power for farmers and cross-subsidizing households while charging enterprises high prices. Third, politics may result in the selection of innately poor projects. The authors reason correctly that “It would be far better to cut just the white elephants….while preserving the productive new construction and maintenance projects…” But politicians may not care about economic efficiency, resulting in waste which must first be eliminated before increasing infrastructure spending. This brings us to political considerations.
Political Economy Explanations of Sovereign Borrowing
The fact that MACs experience debt crises in which solvency considerations play an important role suggest that governments are overborrowing, or violating their GIBC. Since this is not economically rational, one has to look for other explanations. Governments might borrow to postpone difficult reforms, or to promote the interests of well-connected insiders, or avoid making an immediately painful but eventually beneficial adjustment to an adverse shock. Rodrik (1999) argues that the interactions between policies, shocks and conflict management institutions play a key role in explaining debt accumulation and macroeconomic performance, emphasizing that the tendency to avoid short-run adjustment costs might have prolonged negative
consequences for future growth and equity. By-and-large, governments find it difficult to adjust,
22
If a country’s gross public debt is 80 percent of GDP, lowering spreads by 300 basis points will save 2.4 percent of GDP in interest payments.
23
While the authors discuss various tricks for window-dressing the public finances, there is no guarantee (as the authors seem to imply) that adopting a framework based on the GIBC will diminish the appetite for camouflaging accounts, bad fiscal decisions and opacity.
24
with procrastination fueling debt accumulation. Box 5 summarizes the main ideas underlying political economy explanations of debt dynamics.
Box 5. Political Economy and Overborrowing
The tendency to overborrow and its sequel of financial, currency and debt crises beg the question of why these costly events ever take place. The political economy approach highlights factors which lead to procrastination on difficult reforms, borrowing during delays caused by conflict on who will bear the costs of reform, and the myopic tendency to spend and borrow more in good times as a result of decision horizons linked to the chances of success in the next election instead of the long-run welfare of society. The following is a summary of the main ideas:
• Inadequate debt management and “benign neglect”. Ideology, lack of technical skills, human error or inadequate information all result in problems not being promptly addressed. Learning should help, but the recurrence of crises casts doubt on this view. Overborrowing may also result from “benign neglect”, when uncertainty about reform outcomes and the possibility that things may improve spontaneously lead policy maker to procrastinate on painful adjustments.
• Conflicts among competing interest groups and strategic role of debt. The “war-of-attrition” viewpoint argues that competing groups struggle over how to apportion the burden of fiscal stabilization. The group that gives in first pays more. So both groups hold out, precipitating a larger crisis later on. These delays may be so costly that anticipating a crisis and implementing reforms right away may be better, but often only with the wisdom of hindsight. Related studies explore the impact of such conflict over time depending on which group is in power. Since groups differ in their preferences about the composition and level of government spending, current policymakers might deliberately constrain the future government by issuing excessive debt today, especially if they consider their chances of re-election slim. Such behavior is intensified by political polarization. The literature concludes that economic instability is interlinked with political instability, with the two likely to reinforce each other.
• Populist strategies. This strand attributes inefficient outcomes to income distribution and the role of median voter, whose preferences determine election outcomes and hence public policies in
democracies. The would-be winners from policy reform may be uncertain of the gains, and therefore not support it. High and low income groups may form tacit coalitions favoring the accumulation of external debt, the former because they can avoid paying through capital flight and the latter because they are not expected to pay anyway. As a result, the burden is borne by the middle class. This pattern, associated with the populist economic strategies discussed by Dornbusch and Edwards (1991), leads to excessive indebtedness.
• “Common access” to government resources. This strand of literature believes that different groups will prey on government resources and that cooperation will occur only after substantial deterioration of economic conditions. The literature has dubbed this the “voracity effect”, which leads to
overborrowing whenever financing is available.
• Perverse incentives and moral hazard. Consumption booms and procyclical fiscal policy may be the result of expectations of bailouts in the event of a crisis. Foreign aid may foster perverse incentives for rent seeking, while blunting the motivation for corrective action, since success may reduce transfers. Empirical research in this area concludes that both aid and conditionality have worked relatively poorly (e.g., Kenya or Zambia in 1980s (see Dollar and Svensson, 1998)).
• Political budget cycles. This theory was motivated by the observation that the stage of the election cycle affects fiscal policy. The incumbent government tries to “buy” votes with approaching elections by expanding spending and shifting its composition towards observable consumption expenditure and away from investment. Empirical work confirms this tendency and finds that the variation in budget cycles is driven primarily by the desire of politicians to stay in power and the associated rents.
Sources: In addition to the references cited in the box, see Talvi and Vegh (1998), Sturzenegger and Wolf (2004), based on Drazen (2000,) and references therein.
3. FACTORS UNDERLYING CHANGES IN MAC DEBT LEVELS
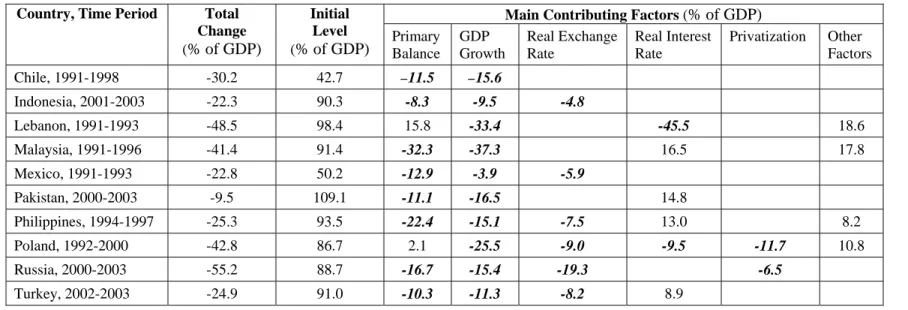
We now discuss factors explaining movements in the public debt-to-GDP ratios of prominent MACs before answering the three questions posed at the outset. This section is based on case studies for 15 “Big MACs” for which data were available (see Budina, Fiess and others, 2004).25 These case studies document trends in domestic and external public debt; decompose the changes in debt-to-GDP ratios into components attributable to GDP growth, fiscal effort,
exchange rate and interest rate fluctuations, and other factors (recognition of contingent liabilities, privatization, debt restructuring, etc); correlate debt dynamics with key economic policy changes; and extract lessons. Of particular interest are episodes during which debt ratios increased or decreased by large amounts. Table 3 provides a summary of decompositions for ten episodes of reductions in the public debt-to-GDP ratio ranging between 15 and 60 percentage points. The numbers in bold italics identify the main factors reducing the debt-to-GDP ratio. We see that: • All episodes involve GDP growth as one of the main contributing factors
• 80 percent of the episodes involve significant primary surpluses; in only one episode, Lebanon 1991-93, were debt ratios reduced while running significant primary deficits • 60 percent of the episodes involve real exchange rate appreciation.
While a real appreciation of the currency helps reduce the debt-to-GDP ratio especially when the share of foreign currency-denominated debt is high, this may not last if the real exchange rate becomes overvalued. Russia between mid-1995 and the meltdown of 1998 is an example. The debt-to-GDP ratio stayed roughly constant in spite of large primary deficits, zero or negative growth and high real interest rates on ruble debt. The reason was the high initial share of dollar-denominated debt plus the real appreciation of the ruble during the stabilization program, which relied on fixing the nominal exchange rate. The real exchange rate became overvalued, and when it collapsed following the August 1998 crisis, the public debt-to-GDP ratio rose by a large amount (KPU (2001)). Real appreciation was also a factor in the debt-to-GDP reduction over 2000-2003; but in this case, it was an equilibrium movement as it coincided with high oil prices, rapid growth and fiscal and institutional reform.
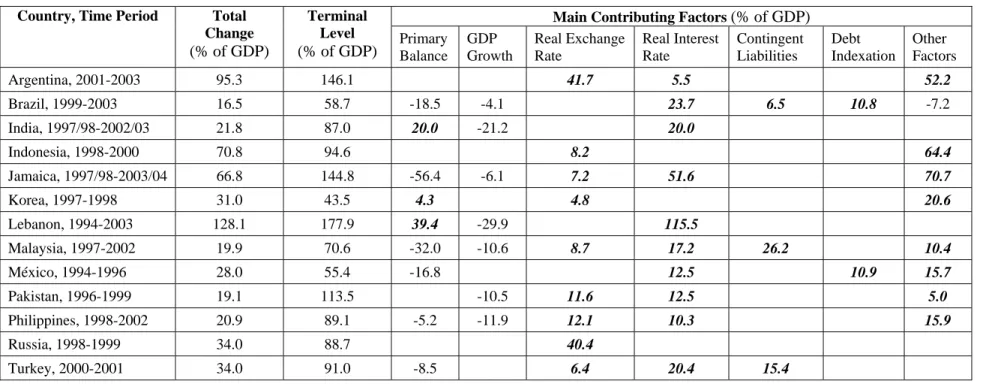
Table 4 summarizes thirteen episodes of increases in the public debt-to-GDP ratios ranging between 20 and 130 percentage points. The numbers in bold italics identify the main factors raising the debt-to-GDP ratio. We see that:
• All episodes involve real interest or exchange rate changes or both as significant factors; more than 75 percent of the episodes involve interest rate increases, and more than 50 percent involve real exchange rate devaluations
• Over 75 percent of the episodes involve contingent liabilities or "other factors" such as financial sector bailouts, a major factor during the East Asian crisis of 1997-98 26
• In more than half the cases, the countries ran primary surpluses during these debt run-ups; only in three cases (India, Lebanon and Korea) did countries run primary deficits
• An important finding is that economic growth collapses did not play an important part in the debt-to-GDP increase episodes.27
25
Argentina, Brazil, Chile, México, and Jamaica in LAC, Lebanon in MNA, India and Pakistan in SAR, Poland, Russia, and Turkey in ECA, and Indonesia, Korea, Malaysia and Philippines in EAP.
26
In Table 4, “contingent liabilities” refers to those identified as such in the data. “Other factors” also includes the impact of contingent liabilities, such as bank bailouts. In Brazil and Mexico, “debt indexation” of local currency debt to the exchange rate, inflation or short-run interest rates also played a role.
27
In India, Lebanon, Pakistan and Philippines, GDP growth was a significant factor dampening the increase in the debt-to-GDP ratio.
Table 3 Main Factors Underlying Debt Reductions, 1990-2003
Main Contributing Factors (% of GDP)
Country, Time Period Total Change
(% of GDP)
Initial Level
(% of GDP) Primary Balance GDP Growth Real Exchange Rate Real Interest Rate Privatization Other Factors
Chile, 1991-1998 -30.2 42.7 –11.5 –15.6 Indonesia, 2001-2003 -22.3 90.3 -8.3 -9.5 -4.8 Lebanon, 1991-1993 -48.5 98.4 15.8 -33.4 -45.5 18.6 Malaysia, 1991-1996 -41.4 91.4 -32.3 -37.3 16.5 17.8 Mexico, 1991-1993 -22.8 50.2 -12.9 -3.9 -5.9 Pakistan, 2000-2003 -9.5 109.1 -11.1 -16.5 14.8 Philippines, 1994-1997 -25.3 93.5 -22.4 -15.1 -7.5 13.0 8.2 Poland, 1992-2000 -42.8 86.7 2.1 -25.5 -9.0 -9.5 -11.7 10.8 Russia, 2000-2003 -55.2 88.7 -16.7 -15.4 -19.3 -6.5 Turkey, 2002-2003 -24.9 91.0 -10.3 -11.3 -8.2 8.9
Table 4 Main Factors Underlying Debt Increases, 1990-2003
Main Contributing Factors (% of GDP)
Country, Time Period Total Change
(% of GDP)
Terminal Level
(% of GDP) Primary Balance GDP Growth Real Exchange Rate Real Interest Rate Contingent Liabilities Debt Indexation Other Factors
Argentina, 2001-2003 95.3 146.1 41.7 5.5 52.2 Brazil, 1999-2003 16.5 58.7 -18.5 -4.1 23.7 6.5 10.8 -7.2 India, 1997/98-2002/03 21.8 87.0 20.0 -21.2 20.0 Indonesia, 1998-2000 70.8 94.6 8.2 64.4 Jamaica, 1997/98-2003/04 66.8 144.8 -56.4 -6.1 7.2 51.6 70.7 Korea, 1997-1998 31.0 43.5 4.3 4.8 20.6 Lebanon, 1994-2003 128.1 177.9 39.4 -29.9 115.5 Malaysia, 1997-2002 19.9 70.6 -32.0 -10.6 8.7 17.2 26.2 10.4 México, 1994-1996 28.0 55.4 -16.8 12.5 10.9 15.7 Pakistan, 1996-1999 19.1 113.5 -10.5 11.6 12.5 5.0 Philippines, 1998-2002 20.9 89.1 -5.2 -11.9 12.1 10.3 15.9 Russia, 1998-1999 34.0 88.7 40.4 Turkey, 2000-2001 34.0 91.0 -8.5 6.4 20.4 15.4
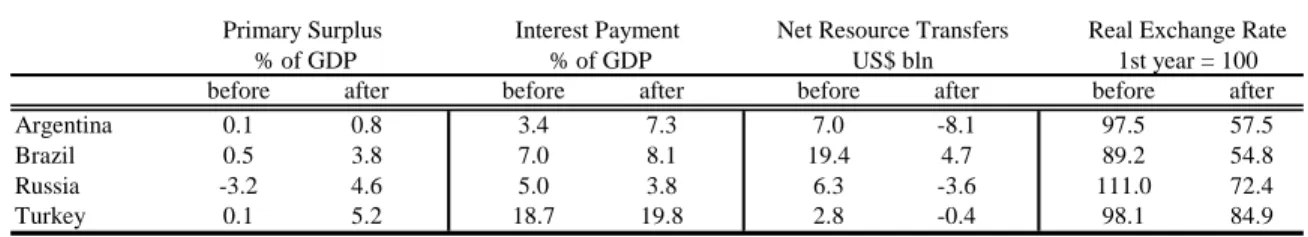
The results in Table 3 and 4 illustrate the big swings in both directions of the debt-to-GDP ratios for individual MACs, but there is an asymmetry. Debt levels rise suddenly and by large amounts following crises; achieving subsequent reductions is slow. What these tables do not show is that the timing of the fiscal adjustment, i.e., a big increase in the primary fiscal surplus, is typically forced by the crisis itself. The impact of the market is demonstrated by the large role played by the real interest rate and the real exchange rate during the debt increase episodes. These often force large knock-on costs in connection with financial sector bailouts as a result of balance sheet currency mismatches and the impact of high real interest rates. In contrast, debt reduction episodes involve growth and fiscal effort, which typically require more time to yield tangible benefits. The results are similar to those found in IMF (2003).28
With this background, the next three sections attempt answers to the questions posed at the outset: Is the world on the verge of a debt crisis? Is public debt helping or hurting growth? What is being done—by developing countries and by international institutions—about this? 4. WHAT IS THE LIKELIHOOD OF ANOTHER 1980s-TYPE DEBT CRISIS?
What are the risks of another generalized debt crisis as in 1982? Our answer is “Such risks have receded since the late 1990s, but this doesn’t mean that such a crisis will not appear in the future.” One would be at odds with history for saying otherwise—as noted in Easterly, Islam and Stiglitz (2000), “Crises have been a constant of market capitalism…”, including not just financial shocks, but also wars, pestilence and natural disasters. One might also add that crises rarely tend to be similar—witness the successive generations of crisis models—making them difficult to predict.
Nevertheless, some guidance may be extracted from recent financial contagion episodes. Kaminsky, Reinhart and Vegh (2003) [KRV] compare cases where an exchange rate collapse or sovereign default in one country led to immediate and widespread cross-border contagion with cases where this did not happen. They conclude that the first set of cases is distinguished by three key factors: (i) a rapid build up of capital flows in the period preceding the currency collapse or default announcement (this is an obvious pre-requisite for a sudden stop); (ii) a surprise
announcement of a float or default; (iii) presence of a common leveraged creditor.
These three factors certainly applied to the 1982 crisis, where petrodollars were recycled by the money center banks to MACs, those in Latin America in particular. The surprise
announcement was the Mexican default in August 1982. The affected countries were hurt by commodity price declines and a big rise in US interest rates over 1980-85. The US banks, which were heavily exposed to Mexico, withdrew from emerging markets, and with the exception of Chile, Colombia and Costa Rica, all the Latin American countries defaulted. The wave of crises in MACs after Thailand announced the flotation of the baht in July 1997 was also preceded by substantial capital flows into the affected countries, as shown in Table 2. The common external shock identified by KRV was the large depreciation of the yen against the dollar, to which most of the East Asian currencies were pegged, between April 1995 and April 1997. Japanese banks retreated from East Asia; the Korean crisis prompted European banks to do so as well. Likewise, the Russian default and devaluation of August 17, 1998, led to ripple effects in Brazil and eventually in Argentina, and possibly Turkey. The Russian crisis precipitated the bailout of Long-Term Capital Management (LTCM), a heavily leveraged hedge fund with systemic links to
28
IMF (2003a), Chapter III, notes: “The rise (in public debt in MACs since the mid-1990s) appears to be largely accounted for by interest and exchange rate movements and the recognition of off-balance-sheet and contingent liabilities…”