Ateneo de Manila University Ateneo de Manila University
Arch
ī
um Ateneo
Arch um Ateneo
Economics Department Faculty Publications Economics Department 3-2010
Crafting Coherent Policy Responses to the Crisis in the
Crafting Coherent Policy Responses to the Crisis in the
Philippines
Philippines
Fernando T. Aldaba Reuel R. Hermoso
Follow this and additional works at: https://archium.ateneo.edu/economics-faculty-pubs
International Labour Office
Policy Integration Department
Crafting Coherent Policy Responses to the Crisis
in the Philippines
Fernando Aldaba and Reuel Hermoso
1Paper for the Policy Coherence Forum
Overcoming the jobs crisis and shaping an inclusive recovery: The Philippines in the Aftermath of the global economic turmoil 11 – 12 March 2010, Makati City, Philippines
March 2010
Crafting Coherent Policy Responses to the Crisis in the Philippines (DRAFT: 03 March 2010) 2
Table of Contents
Content Page
Abbreviations 3
I. Introduction 4
II. Background and Objectives of the Study 5
III.A Framework for Analysis: Transmission Channels and the Response 5
IV.The Macroeconomic and Labour Impact of the Crisis 8
V. Government Responses to the Crisis 39
VI.Assessing the Government Response 43
VII. Responses of the Other Major Stakeholders 53
VIII. Recommendations for Coherent Policy Response and Addressing Decent Work Deficits
56
Selected References 62
Key Officials Interviewed 63
Annex A: Timeline of the Government Response 64
ABBREVIATIONS
4Ps Pantawid Pamilyang Pilipino Program
ADB Asian Development Bank
APL Alliance of Progressive Labour
BPO Business Process Outsourcing
BSP Bangko Sentral ng Pilipinas
CLEEP Comprehensive Livelihood and Emergency Employment Program
CAS Cabinet Assistance System
CFO Commission on Filipinos Overseas
DepEd Department of Education
DILG Department of the Interior and Local Government
DOH Department of Health
DOLE Department of Labour and Employment
DSWD Department of Social Welfare and Development
DTI Department of Trade and Industry
ERP Economic Resiliency Plan
FFW Federation of Free Workers
FGD Focus group discussion
FIES Family Income and Expenditure Survey
GFC Global Financial Crisis
GDP gross domestic product
GNP gross national product
GRIM Global Recession Impact Monitor
GRIN Global Recession Impact News
ILO International Labour Organization
IPD Institute for Popular Democracy
KALAHI-CIDDS KALAHI Comprehensive and Integrated Delivery of Social Services Project
LBES labor-based, equipment supported system
LGU local government unit
MDG Millennium Development Goal
MFI Microfinance Institutions
NAPC National Anti-Poverty Commission
NCR National Capital Region (i.e., Metro Manila)
NEDA National Economic and Development Authority
NFA National Food Authority
NGO nongovernment organization
NSCB National Statistical Coordination Board
NSO National Statistics Office
OFW Overseas Filipino Workers
PHILEXPORT Philippine Exporter Association
PIDS Philippine Institute for Development Studies
PPI Producer Price Index
PSE Philippine Stock Exchange
SMEs Small and Medium Enterprises
TESDA Technical Education and Skills Development Authority
Crafting Coherent Policy Responses to the Crisis in the Philippines (DRAFT: 03 March 2010) 4
I.
Introduction
The onslaught of the global economic crisis has thrown many workers in different parts of the world out of their jobs and many in the developing economies have fallen into situations of poverty. In search for the proper response to the crisis, various governments have turned to stimulus spending as a strategy to preserve and create jobs for their affected citizenry.
The ILO tripartite constituents – government, workers and employers – designed a Global Jobs Pact (GJP) during the International Labour Conference in 2009. The GJP serves as a guiding framework to national and international policies aimed at stimulating economic recovery, generating jobs and providing protection to working people and their families. It seeks to promote a job-intensive recovery from the crisis.
The Pact is built around the principles of the ILO’s Decent Work agenda. It looks at the issues of employment generation and sustainable enterprises. It emphasizes the need for a basic social protection floor. It calls attention to the importance of protecting and promoting rights at work in a crisis situation. It encourages the practice of social dialogue and collective bargaining as critical tools to identify priorities and assist in policy design and implementation. It calls for implementing measures quickly in a coordinated manner, and for integrating gender concerns throughout. The GJP is the response of the ILO and its tripartite constituency to the global crisis. The Pact contains a package of crisis-response and recovery measures. It is not a one-size-fits-all solution, but a portfolio of policy options that countries can adapt to their specific needs and situation. Indeed, a coherent and credible agenda for a rich-job recovery can only result from an in-depth national policy debate and consultation among policy makers and key stakeholders. Since 2001, the Philippines has adopted the Decent Work Common Agenda outlining projects and activities that will help workers, employers and government, achieve the major objectives of Decent Work. The current global crisis could be seen as an opportunity to craft stronger short term and long term responses that can incorporate key elements from the framework of the Global Jobs Pact and help the country restore viable economic growth, employment generation and poverty eradication.
II. Background and Objectives of the Study
This study is part of an ILO-Norway project on Policy Coherence for Growth, Employment and Decent Work – Promoting Decent Work responses to the global economic crisis, managed by the Policy Integration Department of ILO Headquarters. The project is supporting the design of decent work intensive, gender-responsive programmes in a few selected developing countries affected by the global crisis. In particular, the study hopes to provide (i.) a rapid robust assessment of the social and labour market impact of the crisis, (ii.) a review of the policy measures taken by government to address critical Decent Work deficits resulting from the crisis or those already existing even before the crisis (iii.) proposals for the engagement of the ILO constituents, national agencies and development partners in developing suitable policy responses
and/or reorienting existing Decent Work Country Programmes and other development frameworks. The project will also emphasize issues of policy coherence between economic and social ministerial portfolios and the agencies of the multilateral system, building on work on policy coherence done under a previous phase.
In the context of the Philippines, the study will give an overview of the macroeconomy and how the global crisis affected it including the labour market. How the government responded and also, the preliminary outcomes and impact of its intervention will also be examined. During the last quarter of 2008, the Philippine Government prepared an Economic Resiliency Plan (ERP) that aimed to create new jobs and focus on quick spending of the 2009 national budget as a stimulus package that will hopefully also address the needs in health, infrastructure, agriculture, education, livelihoods and social protection. Early ILO commissioned studies i.e. “A Rapid Assessment on the Impact of the Crisis” and “A Preliminary Snapshot on the Impact of Crisis” highlighted the institutional challenges in delivering a coherent policy and programme response to both the economic and social impact of the crisis. The paper will also examine the government response in terms of policy and program measures which address critical Decent Work deficits as a result of the crisis and also those already existing even before the crisis. Finally, it will also discuss issues of timeliness, policy coherence, and institutional coordination in terms of the government’s response.
III.
A Framework for Analysis: Transmission Channels and the Response
The chart below shows a simple framework in assessing the government response to the global financial crisis. It specifically illustrates how the current crisis will affect the Philippine economy through various transmission channels, the impacts of the crisis and how the government responds through monetary, fiscal and social policies. The criteria for assessing the government response are also shown in the chart.A. The Transmission Channels of the Crisis
The Global Financial Crisis (GFC) will affect the country through:
- Asset Markets: Real estate, bond and stock prices plunge as risks increase and investor appetites decrease
- Banking System: Problems arise in local banks exposed to the toxic products sold in the financial markets in the US; this is very limited though in the case of the Philippines; credit becomes tight as banks become selective in lending
- Prices and Exchange Rates: Instability in the financial sector may also create instability in the exchange rates and prices
- Trade: Exports and imports decrease because of weak demand from developed economies resulting to closure of companies or temporary shutdowns
- Overseas employment: Value of remittances sent has also declined as OFWs get laid off from their jobs
- Foreign Direct Investments: Inflows slow down as the crisis heightens and as investors avoid risks
Crafting Coherent Policy Responses to the Crisis in the Philippines (DRAFT: 03 March 2010) 6
The government’s strategy for mitigating the impact of the crisis includes:
- Monetary Policy: Ensuring that the banking system is sound and credit continues to flow in the economy; loosening monetary policy by decreasing interest rates and using other tools available to the Central Bank and maintaining stability of prices and exchange rates - Fiscal Policy: Stimulating the economy through increased government spending in key
areas of the economy e.g. infrastructure and other services; these will generate jobs for unemployed and displaced workers and ensure vulnerable sectors survive the crisis - Social Policy: Implementing social protection measures which include various safety
nets, insurance and employment schemes for the formal and informal sectors and most especially for the vulnerable and poor sectors.
Global
Financial
Crisis
• Asset Prices • Banking System (interest rates) • Commodity Prices & Exchange Rates • Trade: Exports and Imports • Overseas Employment & Remittances • Foreign Direct Investments Macroeconomic Impact • growth • exports • inflation • forex reserves, BOP • equity markets • fiscal balance • remittances Labour Market Impact • unemployment • under-employment • quality of employment Social Impact • poverty • hunger • MDGs • Other social effects Fiscal Policy • increased spending for infrastructures, gov’t programs, etc. • increased revenue capacity Monetary Policy • sound banking system • availability of credit • stable prices • international cooperation Social Policy • social protection • emergency employmentChart 1 A Framework for Assessing the Government's Response to the Crisis
Transmission Channels Impacts on the Economy Government Response Assessment Criteria for the
Response
Planning and Design
• Consultative Processes • Timeliness • Targeting Implementation • Resources • Coordination • Coherence • Reach and Coverage • Relevance and Impact Monitoring • Feedback mechanism • M&E mechanism
Crafting Coherent Policy Responses to the Crisis in the Philippines (DRAFT: 03 March 2010) 8
C. Assessing the Response
- Planning and Design Stage:
Consultative Processes: How government solicited inputs from various takeholders Timeliness: How quick the government is able to respond to the crisis; How fast the programmes are put in place which specifically target the affected sectors
Tageting: How the government is able to determine the affected sectors - Implementation Stage
Resources Mobilized: Whether the resources mobilized by government was adequate and sufficient and whether it was able to mobilize resources from other stakeholders
Institutional Coordination: Whether government was able to successfully coordinate the various agencies (national and local) and stakeholders in responding to the response and whether the coordination mechanism actually worked during the crisis
Policy Coherence: Whether the major programs and policies for the response are coherent and do not negate/contradict each other
Reach and Coverage of Programmes
Relevance and Impact of the Programs for the Affected Sectors and the Economy as a Whole: How the programs actually mitigate the negative impact of the crisis – impact on economic growth, employment, poverty incidence, etc.
- Monitoring Stage
Mechanisms for Getting Feedback from Households: Whether government has set up mechanisms for immediate feedback among ordinary households aside from mechanisms that consult organized sectors and stakeholders
M&E mechanism: How the government assesses its programmes and adopt necessary changes for underperforming ones
IV.
The Macroeconomic and Labour Impact of the Crisis
A. The Philippine Macroeconomy Prior to the Crisis: Some Structural Issues
The Philippine macroeconomy has been confronted with several structural problems in recent years. It will be important to discuss this before examining the impact of the crisis as some of the effects of the GFC simply exacerbate what the economy is currently going through. In addition, some vulnerabilities of the economy have been highlighted because of the crisis. 1. Boom and Bust Cycles
In its recent economic history, the Philippines has suffered from boom and bust cycles where the latter has always been associated with economic or political crises, natural or man-made disasters and internal and external triggers. In the graph below, the troughs are always related to a certain type of crisis. The Latin American debt crisis aggravated by the Aquino assassination leading to the EDSA uprising were the key factors that caused of the downturn from 1983-85. The natural disasters, the various coup attempts and the energy crisis were major reasons for the economic slump from 1990-1992. The East Asian financial crisis
meanwhile effected another big decline in output from 1998-1999. Yet another political crisis, the ouster of Estrada in 2000-2001 again affected the macroeconomy severely.
Chart 2 GDP Growth Rates, 1981-2008
Source: ADB Outlook Indicators 2009
To make a long story short, the Philippine economy has always been vulnerable to these various crises starting especially in the 1980s. The economy was on the upturn during the 1960s and 1970s with a 5%–6% growth rate, its economy slumped in the 1980s and mid-1990s when average real GDP growth was around 2%. Only recently has the Philippines returned to its moderate expansion trend of around 5%. However, its average rate during 2001–2007 is still among the lowest in ASEAN.
Table 1: Average Gross Domestic Product Growth Rates, 1960 - 2007
Country Average 1961– 1970 Average 1971– 1980 Average 1981– 1990 Average 1991– 1995 Average 1996– 2000 Average 2001– 2007 Cambodia … … 7.77 7.34 9.68 Indonesia 4.18 7.87 6.41 7.87 0.98 5.07 Lao PDR NA NA 4.54 6.42 6.17 6.56 Malaysia 6.49 7.87 6.03 9.47 4.99 4.79 Philippines 4.93 5.92 1.80 2.19 3.96 5.02 Singapore 9.88 8.83 7.49 8.87 6.40 5.34 Thailand 8.17 6.89 7.89 8.62 0.64 5.05 Viet Nam NA NA 4.63 8.21 6.96 7.74
Lao PDR = Lao People’s Democratic Republic
Source: World Bank Development Indicators; author’s computations
2. A Consumption Driven Economy
The Philippine economy has been driven by private consumption expenditures (PCE) in the last several years. From 2000 till the present, PCE has averaged almost 70% of GDP. This is a relatively large proportion compared to that of the other ASEAN countries except Cambodia (see Table 2). PCE meanwhile are catalyzed by remittances from overseas workers. From 2006 to
Crafting Coherent Policy Responses to the Crisis in the Philippines (DRAFT: 03 March 2010) 10
2008, deployment of overseas workers have breached the 1.2 million mark (see Chart 3). A recent estimate by the Commission on Filipinos Overseas (CFO) on the stock of overseas Filipinos shows that around 8.7 million are working abroad. About 47.36% or 4.13 million are temporary workers while permanent residents account for 42.31% or 3.69 million. Irregular2 workers meanwhile comprise 10.32% of the total or .9 million. These workers are scattered across all continents (see Chart 3). Remittances have also been rising rapidly from 1975 (see Chart 4) and has reached more than US$ 14 billion in 2007. Sectors that are driven by remittances include wholesale and retail trade, telecommunications, housing, construction, and real estate.
Chart 3: OFW Deployment by Destination
Source: Philippine Migration and Development Statistical Almanac (2009) Chart 4: Remittances in US$ (1975-2007)
Source: Philippine Migration and Development Statistical Almanac (2009)
2
These are workers without valid visas or those who entered host countries illegally
0 200000 400000 600000 800000 1000000 1200000 1400000 1 9 7 2 1 9 7 4 1 9 7 6 1 9 7 8 1 9 8 0 1 9 8 2 1 9 8 4 1 9 8 6 1 9 8 8 1 9 9 0 1 9 9 2 1 9 9 4 1 9 9 6 1 9 9 8 2 0 0 0 2 0 0 2 2 0 0 4 2 0 0 6 2 0 0 8
OFW Deployment by Region
Sea-Based Oceania Trust Territories Americas Africa Europe Asia Middle-East
Table 2: Private Consumption Expenditures as Percentage of GDP, 1995-2007 Southeast Asia 1995 1996 1997 1998 1999 2000 2001 2002 2003 2004 2005 2006 2007 Brunei Darussalam a 36.6 38.7 39.3 40.3 34.5 24.8 26.3 25.6 27.3 26.6 22.5 19.8 20.1 Cambodia 92.6 95.2 88.2 92.9 87.5 86.7 83.1 83.9 83.6 85.1 84.3 81.0 78.2 Indonesia 61.6 62.4 61.7 67.8 73.9 61.7 61.7 67.6 68.1 66.8 64.4 62.7 63.6 Lao PDR … … … … Malaysia 47.9 46.0 45.3 41.6 41.6 43.8 46.1 45.0 44.6 44.0 44.8 45.0 45.8 Myanmar … … … … Philippines 74.1 73.5 72.6 74.3 72.6 69.6 70.6 69.4 69.2 68.7 69.3 70.1 69.4 Singapore 42.3 41.6 41.0 40.0 42.2 42.2 46.0 46.6 46.1 42.4 40.6 39.5 38.6 Thailand 53.2 53.8 54.7 54.2 56.0 56.1 57.3 57.2 57.2 57.2 57.2 55.8 53.7 Viet Nam 73.6 74.4 71.8 70.9 68.6 66.5 64.9 65.1 66.3 65.1 63.5 63.3 64.8
Crafting Coherent Policy Responses to the Crisis in the Philippines (DRAFT: 03 March 2010) 12 3. An Economy with Declining Investments
Another important characteristic of the Philippine economy is the continuing decline in investments despite recent moderate growth. Chart 5 shows the decline of Gross Capital Formation as percent of GDP from a high of 24.8 in 1997 to a low of 14.5 in 2006. Again this is relatively low as compared to the other ASEAN countries except for Brunei. Reasons for such downtrend include high costs of doing business, poor quality of key infrastructure services, a fragile and underdeveloped financial system, and strong perceptions of contracting and regulatory uncertainty. The private sector has time and again identified corruption and macroeconomic instability as two major impediments to a good investment climate in the Philippines. Costs of electricity and security issues are also important factors.
Chart 5 Gross Capital Formation as Percent of GDP
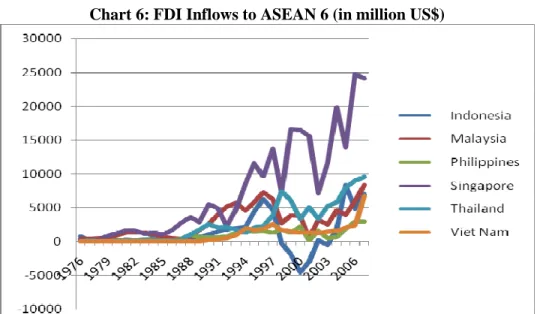
Aside from local investments experiencing a down trend, the country has also not fared well in terms of foreign direct investments. Chart 6 compares FDI inflows to the Philippines with flows to Singapore, Thailand, Malaysia, Indonesia, and Vietnam from the mid-1970s up to the year 2007. The figure shows that huge differences are evident in FDI inflows to the ASEAN 6 countries with the Philippines receiving the lowest level of FDI inflows particularly in the 1990s and the 2000s. Table 5 present FDI as percentage of GDP in these countries. Except for
Indonesia, the Philippines again fared badly. FDI studies show that the most important determinants on the ability of countries to attract FDI relate to the investment climate (particularly the FDI regime and the effectiveness of FDI promotion), the economic
competitiveness of the country, and its growth prospects (FIAS, WB, and IFC, 2005). The Philippines has lagged behind in many competitiveness indicators. Table 6 shows the country’s performance in the Global Competitiveness report where it failed to improve its ranking in two of three major indicators.
Table 4 Gross Capital Formation as Percentage of GDP Southeast Asia 1995 1996 1997 1998 1999 2000 2001 2002 2003 2004 2005 2006 2007 Brunei Darussalam a … … … 13.1 14.4 21.3 15.1 13.5 11.4 10.4 12.9 Cambodia 14.3 14.5 14.8 11.8 16.7 16.9 18.5 18.1 20.1 16.2 18.5 20.6 20.8 Indonesia 31.9 30.7 31.8 16.8 11.4 22.2 22.0 21.4 25.6 24.1 25.1 25.4 24.9 Lao PDR … … … … Malaysia 43.6 41.5 43.0 26.7 22.4 26.9 24.4 24.8 22.8 23.0 20.0 20.5 21.7 Myanmar 14.2 12.3 12.5 12.4 13.4 12.4 11.6 10.1 11.0 12.2 13.2 13.8 … Philippines 22.5 24.0 24.8 20.3 18.8 21.2 19.0 17.7 16.8 16.7 14.6 14.5 15.4 Singapore 34.5 35.4 38.7 31.1 32.2 33.3 26.5 23.7 16.0 21.8 20.2 20.1 20.7 Thailand 42.1 41.8 33.7 20.4 20.5 22.8 24.1 23.8 25.0 26.8 31.4 28.4 26.6 Viet Nam 27.1 28.1 28.3 29.0 27.6 29.6 31.2 33.2 35.4 35.5 35.6 36.8 43.1
Source: ADB Outlook Indicators 2009
Table 5: ASEAN: FDI as percentage of GDP
Southeast Asia 1995 1996 1997 1998 1999 2000 2001 2002 2003 2004 2005 2006 2007 Brunei Darussalam a … … … 1.3 4.0 1.7 1.0 1.8 0.8 … Cambodia 4.7 8.3 5.5 7.0 6.4 4.0 3.7 3.5 1.8 2.4 5.9 6.6 10.0 Indonesia 2.2 2.7 2.2 -0.3 -1.3 -2.8 -1.9 0.1 -0.3 0.7 2.9 1.3 1.6 Lao PDR 5.4 8.5 4.9 3.5 3.5 2.0 1.4 1.4 0.9 0.7 1.0 5.4 7.9 Malaysia 4.7 5.0 5.1 3.0 4.9 4.0 0.6 3.2 2.2 3.7 2.9 3.9 4.5 Myanmar … … … … Philippines 2.0 1.8 1.5 3.5 1.6 3.0 0.3 2.0 0.6 0.8 1.9 2.5 2.0 Singapore 13.7 10.5 14.3 8.9 20.1 17.8 18.2 8.2 12.5 18.2 11.6 18.1 15.0 Thailand 1.2 1.3 2.6 6.5 5.0 2.7 4.4 2.6 3.7 3.6 4.6 4.6 4.6 Viet Nam 8.6 9.7 8.3 6.1 4.9 4.2 4.0 4.0 3.7 3.5 3.7 4.0 9.8
Crafting Coherent Policy Responses to the Crisis in the Philippines (DRAFT: 03 March 2010) 14
Chart 6: FDI Inflows to ASEAN 6 (in million US$)
Source: UNCTAD FDI Indicators (World Investment Report 2008) as cited by Aldaba &Aldaba (2009)
Table 6: Competitiveness Indicators Rankings for Selected Southeast Asian Countries
Source: World Economic Forum, Global Competitiveness Report, 2003-2004 and 2008-2009 as cited by Aldaba & Aldaba (2009)
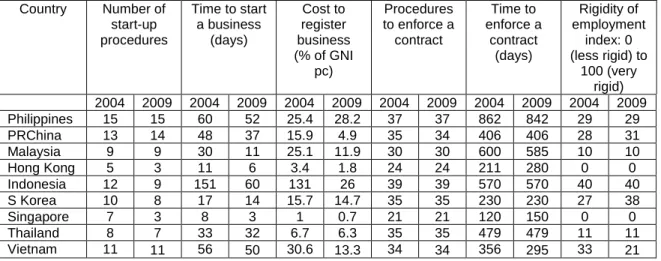
The World Bank’s doing business indicators showed the same concerns on costs, complexity, and uncertainty in contract enforcement. Table 7 shows a comparison of the business costs indicators for the Philippines and its East Asian neighbors. The table reveals that in general, the Philippines along with Indonesia, performed significantly below the other East Asian countries in terms of corruption-related indicators. Between 2004 and 2009, improvements are observed for time to start a business and time to enforce a contract for the Philippines and number of start-up procedures, time to start a business and cost to register business for Indonesia.
Country Growth
Competitiveness Index
Macro Environment Index
Public Institution Index 2004 2009 2004 2009 2004 2009
Malaysia 29 21 27 38 34 30
Thailand 32 34 26 41 37 57
Philippines 66 71 60 53 85 105
Table 7: Cost of Doing Business Indicators
Source: World Bank, Doing Business 2005 and 2010 (http://www.doingbusiness.org) 4. Perennial Fiscal Deficits
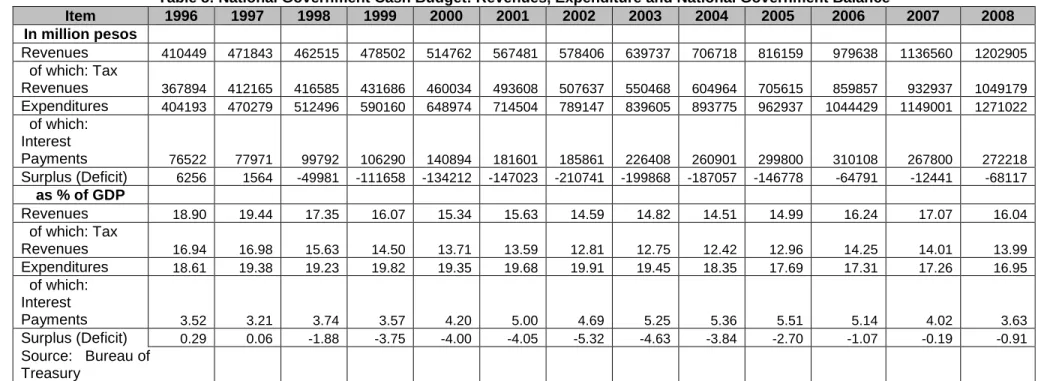
The government has been confronted by fiscal deficits since the East Asian Financial crisis. It only recovered in 2005 when it reformed the valued added tax system. Because of this fiscal situation, government’s provision of infrastructure and social services had been immensely affected. Table 8 and Chart 6 show that since 1998, the government has failed to balance the budget. Table 9 shows the Outstanding debt of government as percentage of GDP. It was in a fragile position in 2003 and 2004 when the ratio reached around 80%. The gravity of the fiscal problem is due to the fact that the post-Asian crisis economic recovery from 1999 to 2005 had surprisingly failed to improve tax effort, and conversely worsened it (Lim 2009). The tax effort peaked at more than 17% of GDP in 1996 and 1997 consistently fell after that and bottomed at 12.4% in 2004 (Table 9). This improved to around 14.3% in 2006 mainly due to the expanded coverage and higher value-added tax rate (raised from 10% to 12%). But the tax effort deteriorated again in 2007 to the present.
Chart 6: Fiscal Balance as Percent of GDP
Source: Asian Development Bank Outlook Indicators 2009 Country Number of start-up procedures Time to start a business (days) Cost to register business (% of GNI pc) Procedures to enforce a contract Time to enforce a contract (days) Rigidity of employment index: 0 (less rigid) to 100 (very rigid) 2004 2009 2004 2009 2004 2009 2004 2009 2004 2009 2004 2009 Philippines 15 15 60 52 25.4 28.2 37 37 862 842 29 29 PRChina 13 14 48 37 15.9 4.9 35 34 406 406 28 31 Malaysia 9 9 30 11 25.1 11.9 30 30 600 585 10 10 Hong Kong 5 3 11 6 3.4 1.8 24 24 211 280 0 0 Indonesia 12 9 151 60 131 26 39 39 570 570 40 40 S Korea 10 8 17 14 15.7 14.7 35 35 230 230 27 38 Singapore 7 3 8 3 1 0.7 21 21 120 150 0 0 Thailand 8 7 33 32 6.7 6.3 35 35 479 479 11 11 Vietnam 11 11 56 50 30.6 13.3 34 34 356 295 33 21
Crafting Coherent Policy Responses to the Crisis in the Philippines (DRAFT: 03 March 2010) 16 Table 8: National Government Cash Budget: Revenues, Expenditure and National Government Balance
Item 1996 1997 1998 1999 2000 2001 2002 2003 2004 2005 2006 2007 2008 In million pesos Revenues 410449 471843 462515 478502 514762 567481 578406 639737 706718 816159 979638 1136560 1202905 of which: Tax Revenues 367894 412165 416585 431686 460034 493608 507637 550468 604964 705615 859857 932937 1049179 Expenditures 404193 470279 512496 590160 648974 714504 789147 839605 893775 962937 1044429 1149001 1271022 of which: Interest Payments 76522 77971 99792 106290 140894 181601 185861 226408 260901 299800 310108 267800 272218 Surplus (Deficit) 6256 1564 -49981 -111658 -134212 -147023 -210741 -199868 -187057 -146778 -64791 -12441 -68117 as % of GDP Revenues 18.90 19.44 17.35 16.07 15.34 15.63 14.59 14.82 14.51 14.99 16.24 17.07 16.04 of which: Tax Revenues 16.94 16.98 15.63 14.50 13.71 13.59 12.81 12.75 12.42 12.96 14.25 14.01 13.99 Expenditures 18.61 19.38 19.23 19.82 19.35 19.68 19.91 19.45 18.35 17.69 17.31 17.26 16.95 of which: Interest Payments 3.52 3.21 3.74 3.57 4.20 5.00 4.69 5.25 5.36 5.51 5.14 4.02 3.63 Surplus (Deficit) 0.29 0.06 -1.88 -3.75 -4.00 -4.05 -5.32 -4.63 -3.84 -2.70 -1.07 -0.19 -0.91 Source: Bureau of Treasury
Table 9: National Government Outstanding Debt
1996 1997 1998 1999 2000 2001 2002 2003 2004 2005 2006 2007 2008
Total (in Billion Pesos) 1155.2 1350.6 1496.2 1775.4 2166.7 2384.9 2815.5 3355.1 3812.0 3888.2 3851.5 3712.5 4220.9
As % of GDP
T O T A L 53.19 55.65 56.14 59.64 64.59 65.67 71.03 77.73 78.25 71.42 63.84 55.77 56.30
Domestic Debt 34.17 30.89 31.93 32.87 31.84 34.36 37.12 39.47 41.08 39.76 35.71 33.07 32.20
NG Direct 33.12 29.67 31.02 32.18 31.27 33.98 36.91 39.42 41.03 39.71 35.67 33.03 32.17
of which Gov't Securities 32.44 29.06 29.56 30.85 30.81 33.55 36.51 39.06 40.45 39.20 35.33 32.73 31.99
Assumed 1.05 1.22 0.91 0.68 0.57 0.38 0.21 0.05 0.05 0.04 0.04 0.03 0.03
Foreign Debt 19.02 24.76 24.21 26.77 32.75 31.32 33.91 38.26 37.17 31.67 28.14 22.70 24.09
NG Direct 14.31 18.70 18.21 18.19 19.30 17.26 17.80 18.90 17.27 12.92 11.18 9.22 10.58
Assumed 0.72 0.75 0.57 0.44 0.40 0.32 0.25 0.18 0.12 0.06 0.02 0.00 0.00
Foreign Denom. Securities 3.99 5.31 5.43 8.14 13.04 13.73 15.87 19.17 19.79 18.68 16.94 13.48 13.51
5. Exports getting to be less diversified
While exports still comprise the largest component of GDP at around 42% in 2007, this has declined in recent years from a high of 55% in 2000. In addition, exports have become less diversified as can be seen in Chart 8, making the economy more vulnerable to crisis situations in export destination countries.
Chart 7: Trade as Percentage of GDP (1990-2007)
Source: World Development Indicators 2009, World Bank as cited in Aldaba (forthcoming)
Chart 8 presents the structure of exports by 2-digit level PSIC. In 1988, 60% of our exports consisted of electrical machinery & apparatus (22%), food and beverages (17%), and wearing apparel and textile (21%). Over the years, however, the Philippine export base has become less diversified. In 2006, 69% of the country’s exports relied on only one sector: machinery equipment & transport which in 2006. Meanwhile, the shares of traditional exports such as food and beverages along with wearing apparel and textile declined to 3% and 7%, respectively.
Chart 8: Merchandise Export Structure 1988 and 2006
Crafting Coherent Policy Responses to the Crisis in the Philippines (DRAFT: 03 March 2010) 18 Table 10: Exports as Percentage of GDP
Southeast Asia 1995 1996 1997 1998 1999 2000 2001 2002 2003 2004 2005 2006 2007 Brunei Darussalam a 59.7 59.9 57.2 50.5 55.8 67.4 69.5 67.1 69.3 68.8 70.2 71.8 67.7 Cambodia 31.2 25.4 33.7 31.8 37.2 49.9 52.7 55.4 56.5 63.6 64.1 68.6 65.3 Indonesia 26.3 25.8 27.9 53.0 35.5 41.0 38.2 32.7 30.5 32.2 34.1 31.0 29.4 Lao PDR … … … … Malaysia 94.1 91.6 93.3 115.7 121.3 119.8 110.4 108.3 106.9 115.4 117.5 116.5 110.5 Myanmar 0.8 0.7 0.6 0.4 0.3 0.5 0.5 0.4 0.2 0.2 0.2 0.2 … Philippines 36.4 40.5 49.0 52.2 51.5 55.4 49.2 50.2 49.6 50.9 47.6 47.3 42.5 Singapore 187.0 181.6 175.2 172.7 183.9 195.6 191.6 192.3 212.5 224.4 236.4 243.4 230.2 Thailand 41.8 39.3 48.0 58.9 58.3 66.8 65.9 64.2 65.7 70.7 73.6 73.7 73.2 Viet Nam 32.8 40.9 43.1 44.8 50.0 55.0 54.6 56.8 59.3 65.7 69.4 73.6 76.9
6. Poverty and Labour Market Woes Amidst Moderate Growth
For the past twenty years, the twin problems of unemployment and underemployment have haunted the economy. Some 1.3 to 1.5 million Filipinos join the labor force every year. Despite the exodus of Filipinos to work abroad, official unemployment rates remain high by East Asian standards. Indonesia is the only other country with unemployment rates in the higher single digits as the Philippines (Table 11).
Table 11: Unemployment Rates in East Asia, 2003-2007
Country 2003 2004 2005 2006 2007 China 4.3 4.2 4.2 4.1 4.0 Hongkong 7.9 6.8 5.6 4.8 4.0 Indonesia 9.5 9.9 11.2 10.3 9.1 Malaysia 3.6 3.5 3.5 3.4 3.1 Philippines* 11.3 11.8 11.5 8.0 7.3 Singapore 4.0 3.4 3.1 2.7 2.1 South Korea 3.6 3.7 3.7 3.5 3.2 Taiwan 5.0 4.4 4.1 3.9 3.9 Thailand 2.2 2.1 1.8 1.5 1.4
* The official definition of unemployment was changed in 2006 resulting in lower rates Source: ADB Outlook 2008
Official underemployment rates are seen to reflect the existence of low quality jobs and they have remained relatively high for the past fifteen years hovering from 16-22% (see figure below). This is consistent with the results of the 2008 Informal Sector Survey of the National Statistics Office (NSO) which showed that there were about 10.5 million informal sector operators in the country with almost 90% as self employed workers. Not surprisingly, ADB researchers Hasan and Jandoc (2009) note that the share of employment in manufacturing, the sector where most quality permanent jobs are generated has been stagnant and it is the services sector that has “absorbed” the shift of employment from agriculture. The fastest-growing job type is not permanent wage employment but casual wage jobs and that there is weak growth in wages and earnings for workers in general.
Chart 9 Unemployment Rates, 1995-2009
0 5 10 15 20 25 95 96 97 98 99 00 01 02 03 04 05 06 07 08 09 Underemployment Rates January 95-09
Crafting Coherent Policy Responses to the Crisis in the Philippines (DRAFT: 03 March 2010) 20
Unemployment and underemployment of the vast majority of our citizens contribute greatly to their impoverishment. Poverty incidence among households increased from 24.4% in 2003 to 26.9% in 2006 and the number of poor families increased from 4.02 million in 2003 to 4.68 million in 2006. The headcount index increased from 30.0% in 2003 to 32.9% in 2006 and the number of poor people from 23.8 million in 2003 to 27.6 million in 2006. Self-Rated Poverty3 has ranged from 50%-52% for most of 2008, peaking at 59% (estimated 10.6 million people) in the 2nd quarter. Aside from high unemployment and underemployment rates, the labour market is also experiencing a high rate of overseas migration. This is a rationale response of a segment of the labour force to the unavailable supply of quality jobs in the country as discussed above.
B. Macroeconomic Impact of the Global Crisis
The immediate impact of the tight liquidity in global capital markets was a rise in the price of risk measured by bond spreads and a sharp drop in equity prices. Foreign currency
denominated government bond spread for the Philippines jumped from 155 basis points in June 2007 to 549 basis points in November 2008 and the Philippine stock exchange index fell by 24 percent between July 2008 and January 2009 (Yap et al, 2009). The following discusses the medium term macroeconomic impact of the GFC:
1. The Impact on Over-all Economic Growth
The more insidious, long-term consequence of the Global Financial Crisis has been the downsizing of the real economy as the economies of the biggest trading partners like the United States, Japan, and Europe underwent contraction. This has had profound effects on the Philippine manufacturing sector, particularly the export sub-sector. Running data for 2009 indicate some contractionary pressures on the Philippine economy, especially in the manufacturing sector. Table 12 shows a decline in the Producer Price Index (PPI) from 2008 to the first half of 2009.
Table 12. Producer Price Index for Manufacturing, Philippines (2000=100)
Particulars 2007 2008 2009*
Total manufacturing 168.40 175.25 172.3
Annual percentage change 0.8 4.1 (0.2)
*Running data from January to July 2009.
Source: Monthly Integrated Survey of Selected Industries (MISSI), National Statistics Office (NSO)
3
An approach measuring poverty incidence through a random survey of households (heads) which identify themselves as being poor; in the Philippines, this was pioneered by the Social Weather Stations
Table 13. National Accounts of the Philippines, at constant 1985 prices, Q-on-Q changes, Q1 2007~Q3 2009
Source: National Statistical Coordination Board, February 2010
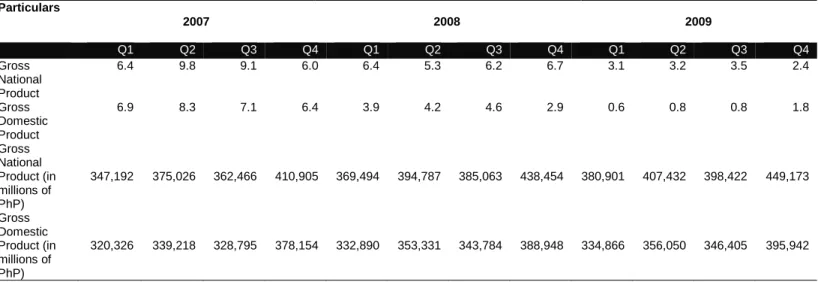
Both Gross National Product (GNP) and Gross Domestic Product (GDP) exhibit a general downward trend over the last three (3) full years from Q1 2007 save for the spike in Q2 2007 (Table 13). But while growth in 2009 was remarkably weak in Q1 as the world economy began to feel the effects of the Global Financial Crisis, it was still positive, unlike that of many other countries in Asia. Admittedly, though, were it not for remittances – a major item in GNP (which treads a higher growth path than GDP) – it is likely that the economy would have fared much worse.
After a relatively strong performance in the third quarter of 2008 the industrial sector registered negative growth for the first three quarters of 2009. Agriculture, fishery and forestry, while still in positive territory, went down to almost zero growth in Q2 2009 although it recovered to above 1% in the following quarter. This would impact most adversely on rural poverty and hunger, as the majority of the population are still found in the countryside and where rural families are dependent on farm-based incomes. The service sector has started to grow after a dip in the last quarter 2008 which tends to confirm the consumption-driven nature of the Philippine economy, as more jobs open up in the service sector, which deals largely with traded goods and services, in contrast with production-related activities in industry and agriculture. Overall, however, the Philippine economy registered positive growth in 2008 at 4.6% and 2009 at 0.9%, at a time when a contraction was considered inevitable in many places in the world.
Particulars 2007 2008 2009 Q1 Q2 Q3 Q4 Q1 Q2 Q3 Q4 Q1 Q2 Q3 Q4 Gross National Product 6.4 9.8 9.1 6.0 6.4 5.3 6.2 6.7 3.1 3.2 3.5 2.4 Gross Domestic Product 6.9 8.3 7.1 6.4 3.9 4.2 4.6 2.9 0.6 0.8 0.8 1.8 Gross National Product (in millions of PhP) 347,192 375,026 362,466 410,905 369,494 394,787 385,063 438,454 380,901 407,432 398,422 449,173 Gross Domestic Product (in millions of PhP) 320,326 339,218 328,795 378,154 332,890 353,331 343,784 388,948 334,866 356,050 346,405 395,942
Crafting Coherent Policy Responses to the Crisis in the Philippines (DRAFT: 03 March 2010) 22
Chart 10. National Income Accounts (GNP, GDP) by source or industry sector, percentage change, Y-O-Y, at constant 1985 prices
Source: National Statistical Coordination Board, August 2009
2. Prices and Inflation
Table 14 shows that inflationary pressures were built up during early 2008 even before the crisis erupted, as oil and food prices fuelled the increase in prices. Significant reductions in inflation were realized though in 2009, as it went down to single digits at the beginning of that year after reaching double digits in 2008. Headline inflation settled at 3.35% in 2009 from a high of 9.29% in 2008. The low inflation in 2009 mainly due to base effects and partially to the downturn of economic activity gave the monetary authorities enough flexibility to continually reduce interest rates.
Table 14. Simple (Headline) Inflation, Philippines, 2000=100, % changes Y-o-Y, 2007~2009
Year Jan Feb Mar Apr May Jun Jul Aug Sep Oct Nov Dec Average 2007 3.90 2.60 2.20 2.30 2.40 2.30 2.60 2.40 2.70 2.70 3.20 3.90 2.77
2008 4.90 5.40 6.40 8.30 9.50 11.40 12.30 12.40 11.80 11.20 9.90 8.00 9.29
2009 7.10 7.30 6.40 4.80 3.30 1.50 0.20 0.10 0.70 1.60 2.80 4.40 3.35
Source of basic data: NSO, BSP-DER.
As early as end-2008, when the Crisis began to unfold, many observers had correctly predicted that the Philippines, particularly its export sector, would suffer as a result. The country’s exports plunged by 21.9 percent to $38.33 billion in 2009 from $49.078 billion in 2008 as demand for locally-made products declined substantially due to the global financial crisis. Philippine exports started to decelerate in September 2008 and reached its lowest point in December of that year, decreasing to -40.3%. Electronic products, the country’s top export fell 22% in 2009 and apparel and clothing, the second top export declined 17.8%. However, total exports recovered in November 2009, with a positive growth of 5.7 percent and then surged 23.6% in December.
Chart 11.Exports Growth, Philippines, January 2008 ~ December 2009
Exports Growth YOY
-50 -40 -30 -20 -10 0 10 20 30 Jan '08 Feb '08 Mar '08 Apr '08 May '08 Jun '08 Jul ' 08 Aug '08 Sep '08 Oct '08 Nov '08 Dec '08 Jan '09 Feb '09 Mar '09 Apr '09 May '09 Jun '09 Jul' 09 Aug ' 09 Sep ' 09 Oct '09 Nov '09 Dec
' 09 Exports Growth YOY
Source: National Statistics Office 4. FDI and Balance of Payments
The balance-of-payments (BOP) position registered an overall surplus of US$4.17 billion for Q3 2009. For the month of October 2009 alone, the figure is double that of the same period from the previous year, reversing a deficit of US$1.2 billion and posting a surplus of US$896 million. This latest BOP figure also represents an improvement from that of the previous month of September 2009, which was recorded at US$502 million, The surplus was created in part by the sale of US$1 billion in global bonds, the proceeds of which will be used to help the government fill in an estimated PhP300 billion budget gap for 2009 and settle maturing obligations. The Philippines had also borrowed US$250 million from the Asian Development Bank (ADB) to meet increased spending needs as a pump-priming measure in the wake of the twin disasters of typhoons “Ondoy” and “Pepeng” that visited the country in September.4 These measures have helped to improve net capital inflows. However, in November, the country incurred a BOP deficit of $93 million, a reversal of the previous month’s
4
Crafting Coherent Policy Responses to the Crisis in the Philippines (DRAFT: 03 March 2010) 24
million surplus. Because of this, the 11-month surplus was reduced to $4.080 billion from the end-October’s $4.173-billion.
The Philippines’ net inflow of foreign direct investments (FDI) amounting to US$82 million was posted in November 2009. On a cumulative basis, the eleven-month FDI level amounted to US$1.4 billion, higher by 5.5 percent than the year-ago level. Net equity capital inflows, totalling nearly US$1.4 billion, were up by 12.8 percent compared to the US$1.2 billion level recorded in the same period in 2008. In particular, gross equity capital placements from January to November 2009 reached US$1.5 billion, with the bulk of investments coming from the U.S., Japan, Hong Kong, and the Netherlands. Recipient industries included manufacturing, real estate, construction, services, financial intermediation, mining, trade/commerce, and transportation/ storage/communications.
5. Exchange Rates and Gross International Reserves
The Philippine peso normally tracks the weakening or strengthening of the US dollar in the global market. After much volatility from 2004 to early 2007, a relatively stable exchange-rate regime has been in place from mid-2007 to the present, fluctuating in the ranges from P45 to P47 per US dollar. This relative stability in the exchange rate has helped the Philippines keep inflationary pressures in check. Table 17 summarizes the exchange rate averages and end-of-period numbers against the US dollar throughout the years of the Arroyo administration’s second term in office.
Table 16 shows the country’s international reserve position at the close of each period indicated. To its credit, the BSP under the guidance of the Monetary Board enacted policies to ensure a steady build-up of the reserve position even prior to the start of the Crisis. The central bank’s gross international reserves (GIR), which serve as the country’s premier line of defense against foreign exchange shocks, grew to a fresh record high of $42.3 billion. At its end-September level, the foreign exchange stock was enough to cover 7.8 months worth of imports and payments of services and income. It was also equivalent to 7.6 times the country’s short-term external debt based on original maturity.
Lim (2009) notes that in 2008, the net outflows from portfolio investments and the trade deficit were outpaced by overseas remittances of OFWs. He adds that these remittance inflows usually went beyond 10% of GDP, so that when the global financial and economic meltdown started, the massive capital outflows did not lead to a very strong reduction in foreign exchange reserves in 2008.
Table 15. Foreign Direct Investment (BOP concept), in millions of US dollars, 2008~2009
*Preliminary
**Year-to-date (September) Source: BSP
Table 16. International Reserve Levels, Philippines, at end of period indicated (in millions of US dollars)
2008 2009
March April May June July August September October November December January February March April May June Reserve Position in the
Fund 144.06 142.32 141.97 143.20 142.08 137.61 135.55 130.46 130.03 135.02 130.78 128.63 131.06 131.31 135.70 136.15 Gold 3,834.39 3,584.75 3,795.61 3,962.94 3,904.11 3,568.84 3,848.44 3,516.51 3,808.98 4,357.93 4,567.67 4,687.30 4,547.47 4,422.69 4,879.20 4,711.71 SDRs 0.08 13.37 12.61 12.71 12.61 11.49 11.32 10.90 10.25 10.65 10.31 9.91 10.10 10.11 10.33 10.35 Foreign Investments 32,274.85 32,228.27 31,884.16 32,223.58 32,545.36 32,672.28 32,292.70 31,832.29 32,374.42 32,065.86 33,682.15 33,213.97 33,414.96 33,941.45 33,810.59 33,937.41 Foreign Exchange 370.63 386.86 398.77 369.85 296.83 352.50 409.44 461.42 504.47 981.36 857.30 884.76 937.69 810.69 753.56 693.92 GIR 36,624.01 36,355.57 36,233.12 36,712.28 36,900.99 36,742.72 36,697.45 35,951.58 36,828.15 37,550.82 39,248.21 38,924.57 39,041.28 39,316.25 39,589.38 39,489.54 Annual Growth Rate (in %) 48.4 44.9 41.5 39.2 31.7 20.5 18.8 10.6 12.6 11.3 12.8 7.3 6.6 8.1 9.3 7.6 Less:
Item 2008 2009* Cumulative (Jan-Sep) Y-o-Y Growth
rate** J F M A M J J A S J F M A M J J A S 2007 2008 2009* 2008 2009 Non-resident investment in RP -4 88 135 217 23 146 321 51 211 33 231 -226 599 388 -133 347 36 -6 2617 1188 1269 -54.6 6.8 Equity capital 45 35 97 36 15 154 600 19 43 6 10 32 627 319 2 315 22 -14 1856 1044 1319 -43.8 26.3 Placements 78 68 103 51 42 167 606 39 54 26 14 33 632 322 34 326 53 17 1980 1208 1457 -39.0 20.6 Withdrawals 33 33 6 15 27 13 6 20 11 20 4 1 5 3 32 11 31 31 124 164 138 32.3 -15.9 Reinvested earnings, net -83 -73 -89 16 21 24 92 16 1 17 13 10 17 13 18 -14 30 10 412 -75 114 -118.2 252.0
Other capital, net 34 126 127 165 -13 -32 -371 16 167 10 208 -268 -45 56
Crafting Coherent Policy Responses to the Crisis in the Philippines (DRAFT: 03 March 2010) 26 Liabilities 21.44 27.46 21.84 506.01 510.19 715.19 921.37 1,528.39 1,527.97 1,514.68 1,521.05 1,027.24 1,534.73 1,543.39 1,045.26 1,023.97 NIR 1 36,602.57 36,328.11 36,211.28 36,206.27 36,390.80 36,027.53 35,776.08 34,423.19 35,300.18 36,036.14 37,727.16 37,897.33 37,506.55 37,772.86 38,544.12 38,465.57 Reserve Adequacy Measures Import Cover 2 5.96 5.86 5.78 5.77 5.69 5.62 5.56 5.47 5.68 5.95 6.36 6.46 6.66 6.91 7.14 7.29 Short-Term External Debt Cover Original Maturity 550.65 546.62 544.78 417.33 419.47 408.39 442.19 404.00 413.85 536.36 560.61 598.75 600.64 604.87 609.07 686.42 Residual Maturity 3 289.88 296.20 299.08 263.74 264.83 264.30 283.05 260.33 269.05 324.16 337.71 318.09 315.56 315.49 317.20 344.32 Memo Item Percent Share to Total GIR 100.00 100.00 100.00 100.00 100.00 100.00 100.00 100.00 100.00 100.00 100.00 100.00 100.00 100.00 100.00 100.00 Reserve Position in the Fund 0.39 0.39 0.39 0.39 0.39 0.37 0.37 0.36 0.35 0.36 0.33 0.33 0.34 0.33 0.34 0.34 Gold 10.47 9.86 10.48 10.79 10.58 9.71 10.49 9.78 10.34 11.61 11.64 12.04 11.65 11.25 12.32 11.93 SDRs 0.00 0.04 0.03 0.03 0.03 0.03 0.03 0.03 0.03 0.03 0.03 0.03 0.03 0.03 0.03 0.03 Foreign Investments 88.12 88.65 88.00 87.77 88.20 88.92 88.00 88.54 87.91 85.39 85.82 85.33 85.59 86.33 85.40 85.94 Foreign Exchange 1.01 1.06 1.10 1.01 0.80 0.96 1.12 1.28 1.37 2.61 2.18 2.27 2.40 2.06 1.90 1.76 1
Inclusive of gold monetization and revaluation of reserve assets and reserve-related liabilties which are excluded in the calculation of the balance of payments (BOP). Net International Reserves (NIR)
refer to the difference between Gross International Reserves (GIR) and the total of the Bangko Sentral's short-term liabilities and the Use of Fund Credits (UFC). UFC refers to the sum of outstanding drawings from the IMF under various policies and facilities, other than drawings under the reserve tranche.
2
Number of months of average imports of goods and payment of services and income that can be financed by reserves.
3
Refers to adequacy of reserves to cover outstanding short-term external debt based on original maturity plus principal payments on medium- and long-term loans of the public and private sectors falling duein the next 12 months.
r
Table 17. Philippine pesos per US dollar, daily average per month and end-of-period, 2004~ 2009
Daily average per month 2004 2005 2006 2007 2008 2009
January 55.5261 55.7662 52.6171 48.9143 40.9381 47.2072 February 56.0696 54.8128 51.8168 48.3814 40.6711 47.5846 March 56.3029 54.4402 51.2189 48.5172 41.2524 48.4580 April 55.9039 54.4918 51.3597 47.8224 41.8196 48.2165 May 55.8453 54.3411 52.1273 46.8141 42.9020 47.5242 June 55.9848 55.1790 53.1567 46.1602 44.2806 47.9053 July 55.9527 56.0062 52.3976 45.6251 44.9563 48.1460 August 55.8342 55.9523 51.3618 46.0737 44.8769 48.1607 September 56.2132 56.1562 50.4012 46.1315 46.6922 48.1394 October 56.3414 55.7077 50.0038 44.3803 48.0252 46.8513 November 56.3221 54.5606 49.8434 43.2176 49.1862 47.0324 December 56.1828 53.6118 49.4670 41.7429 48.0942 Average 56.0399 55.0855 51.3143 46.1484 44.4746 47.7478 %Appreciation(+)/Depreciation(-) -3.2800 1.7300 7.3500 11.1900 3.7600 -9.9600 Volatility** 0.2801 0.8396 1.1536 2.0991 2.9141 0.5244 Year 2004 2005 2006 2007 2008 2009 End-of-Period January 56.0850 55.1120 52.3360 49.0270 40.6500 47.0760 February 56.2750 54.7170 54.0880 48.2870 40.3600 48.2360 March 56.3570 54.7930 51.2840 48.2620 41.8680 48.4190 April 55.8580 54.3540 51.8260 47.5100 41.1920 48.7040 May 55.8370 54.3670 52.6540 46.2690 43.8820 47.5480 June 56.1810 55.9190 53.5870 46.3290 44.7560 48.3080 July 56.0090 56.1050 51.6240 45.6110 44.1400 48.1210 August 56.2160 56.1600 50.9370 46.6950 45.6850 48.9060 September 56.3360 56.0550 50.3870 45.0630 46.9170 47.5920 October 56.3510 55.0600 49.8050 43.9470 48.7460 47.7320 November 56.2310 53.9990 49.7630 42.7980 48.8800 46.7520 December 56.2670 53.0670 49.1320 41.4010 47.4850 Source: BSP, 2009 6. Remittances
Remittances by overseas Filipino workers (OFW) grew 5.6% in 2009 proving its resilience to the global economic downturn. Data from the BSP showed that money sent reached a record $1.6 billion in December, an 11.4% growth from the same month in 2008. This was the highest growth recorded for 2009 and the highest year-on-year expansion since October 2008.This brought the country's total remittance inflows for 2009 to $17.3 billion. According to the the BSP, the country's major sources of remittances were the United States, Canada, Saudi Arabia, United Kingdom, Japan, Singapore, United Arab Emirates, Italy, and Germany. It also credited the steady growth in remittances to the sustained deployment of
Crafting Coherent Policy Responses to the Crisis in the Philippines (DRAFT: 03 March 2010) 28
skilled Filipino workers and increased access of OFWs to formal money transfer channels. Last year there was increased demand for engineers, medical practitioners, and teachers. As OFWs are spread around the globe, this diversification has also contributed to the resilience of remittance flows. The downside of remittances is some evidence of growing dependency among the youth in migrant households. (PIMA Foundation, 2009).
Net factor Income from Abroad (NFIA) which are mostly remittances has kept the economy afloat in 2008 and early 2009 as could be seen in the chart below from Lim (2009).
Chart 13 Contribution to GNP: GDP and NFIA
4.98 -0.55 3.23 5.65 1.65 4.15 4.61 5.91 4.56 4.96 6.44 3.51 0.40 0.27 0.96 0.50 1.42 0.61 0.03 1.33 1.00 0.84 0.50 1.00 2.66 4.04 -1.00 0.00 1.00 2.00 3.00 4.00 5.00 6.00 7.00 8.00 1997 1998 1999 2000 2001 2002 2003 2004 2005 2006 2007 2008 1st Q 2009
Net factor income from abroad GDP
Source: NSCB as cited by Lim (2009)
7. Equity Markets and Portfolio Investments
Other economic indicators highlight the Philippines’ resilience in the current adverse environment. BSP reported “hot money” inflows totalling US$229.14 million in the first nine months alone of 2009, a reversal from year-ago net outflows of US$889.15 million. Updated figures show that in the first two weeks of October 2009, the foreign fund managers opted to stay invested in the Philippines as hot-money inflows totalled
US$162.65 million, also a reversal from year-ago net outflows of US$42.70 million. This resulted in net hot-money an inflow of US$389.94 million from year-to-date and a
turnaround from year-ago outflows reaching US$897.83 million. BSP data showed that 82 percent of the gross portfolio investment inflows reported in September entered the stock market, the rest into peso-denominated securities and time deposits. Gross portfolio inflows totalled $685.30 million in September, outflows were $638.35 million. Foreign portfolio investment inflows hit US$4.024 billion in the eight-month period against outflows of US$3.842 billion. A month earlier, the BSP reported that foreign portfolio inflows amounted to $384.96 million in August against outflows of $467.87 million. The investments, which came from the United States, the United Kingdom, Japan, Singapore and Luxembourg, were invested mainly in the stock market.
In a related development, companies listed on the Philippine Stock Exchange (PSE) saw aggregate profits grow significantly during the first six months of the current year, and analysts said the rest of 2009 will likely be better. The PSE, in a statement, said the combined net earnings of 229 listed firms increased by 46.3% to P193.43 billion from a year earlier. Total revenues likewise went up by 4.8% to P1.32 trillion. A total of 164 companies ended the January-June period in the black while 65 firms recorded net losses, the PSE added. Ultimately, the improved real corporate performance – as opposed to stock price appreciation and increased market capitalization – of PSE-listed firms will result in improved investor-confidence in the local issuances, as evidenced by the stronger upward momentum of the Philippine Stock Index (PhiSIx) beginning in December of 2008 (Chart 14).
Chart 14. Philippine Stock Index (PhiSIx), June 2007 ~ October 2009
Image source: DB Knowledge Services, 2009 (http://www.dbresearch.de ) 8. Fiscal Balance
The fiscal deficit of the National Government for 2009 was recorded at P298.5 billion, higher by P48.5 billion than the target of P250 billion and around 3.9 percent of GDP. The National Government incurred a deficit in December amounting to P26.0 billion. For the full year of 2009, revenue collections reached to P1,123.2 billion or P115.9 billion lower than program. The shortfall in revenue collections is due to the underperformance by the Bureau of Internal Revenue by P48.2 billion, Bureau of Customs by P53.0 billion, and Other Offices by P24.6 billion. The Bureau of the
Treasury, on the other hand, exceeded its collection target by P9.8 billion and registered a growth of 9.8% compared to the same period last year. The fall in revenues can also be attributed to slower economic activities and lower profitability of companies as a result of
the GFC. National Government expenditures reached P1,421.7 billion for the year or 67.4 billion below than program and grew by 12% over the same period last year. This is despite the P 330 billion stimulus spending that it supposedly incurred for the year.
Table 18 Fiscal Performance of the Republic of the Philippines
January to December 2009 (In Billion Pesos)
Jan – Dec Actual Jan – Dec
2009 Programmed Program vs. Actual Percent Growth 2008/2009 2008 2009 Surplus/(Deficit) (68.1) (298.5) (250.0) (48.5) 338.3 Revenues 1,202.9 1,123.2 1,239.2 (115.9) (6.6) Cash 1,144.2 1,071.3 1,183.9 (112.6) (6.4) Non-Cash 58.7 51.9 55.3 (3.3) (11.5) Expenditures 1,271.0 1,421.7 1,489.2 (67.4) 11.9 Cash 1,212.3 1,369.8 1,433.9 (64.1) 13.0 Non-Cash 58.7 51.9 55.3 (3.3) (11.5)
Source :Bureau of Treasury
C. Labour and Social Impact of the Global Financial Crisis 1. Unemployment
Even before the onslaught of the GFC, the country already experienced a relatively high unemployment rate in April 2008. During the crisis i.e. after September 2008, unemployment peaked in January 2009 but eventually eased up in October 2009 as signs of recovery emerged.
Table 19: Key Indicators
LFPR Unemp Underemp Jan '07 64.8 7.8 21.5 Apr '07 64.5 7.4 18.9 July '07 63.6 7.8 22 Oct '07 63.2 6.3 18.1 Jan '08 63.4 7.4 18.9 Apr '08 63.2 8.0 19.8 July '08 64.3 7.4 21.0 Oct '08 63.7 6.8 17.5 Jan '09 63.3 7.7 18.2 Apr '09 64.0 7.5 18.9 Jul '09 64.6 7.6 19.8 Oct '09 64.0 7.1 19.4
Chart 15: Unemployment rates, January 07 to October 09 Unemployment Rates 0 1 2 3 4 5 6 7 8 9 Jan '07 Apr '07 July '07 Oct '07 Jan '08 Apr '08 July '08 Oct '08 Jan '09 Apr '09 Jul '09 Oct '09 Unemp
Source: National Statistics Office
In terms of regions, the National Capital Region, Calabarzon (IV-A) and Central Luzon (III), Ilocos (I) and Cebu (VII) were the ones hit with relatively high unemployment rates. Some of the export-oriented firms are based in these regions especially those within the export processing zones. This is confirmed by anecdotes and case studies of workers retrenched from such firms as gathered by the ILO and ADB in Cavite, Batangas, Laguna and Cebu. (Lopez, 2009 and PIMA Foundation, 2009)
Chart 16: Unemployment Rates by Region, January 09
Unemployment Rate by Region
0 2 4 6 8 10 12 14 16 R P N C R C A R I II III IV -A IV -B V VI VII VIII IX X XI XII C a ra g a A R M M
Unemployment Rate by Region
These unemployment statistics can be further bolstered by administrative data from the Department of Labour and Employment in terms of establishments reporting their displaced workers. Table 20 shows that CALABARZON, NCR, Central Visayas and Central Luzon contributed more than 90% of the displaced workers from affected firms from Jauary to June 2009.
Table 20: Establishments Reporting Permanently Displaced Workers, January – June 2009
In terms of educational attainment, workers having high school and college level education comprise more than 80% of the unemployed during the crisis period. Unemployed college level workers increased its proportion faster relative to others in April 2009 as new graduates entered the labour force.
Chart 17: Unemployed Workers by Educational Attainment
Composition of Unemployed by education
0% 10% 20% 30% 40% 50% 60% 70% 80% 90% 100%
Jan '08 Apr '08 July '08 Oct '08 Jan '09 Apr '09 July '09 Oct '09
College High School Elementary No grade completed
With regard to age brackets, the youth, especially those aged 15-24 increased their share in the unemployed workforce during the crisis months January to July 2009. While there are examples of teen-agers dropping out of school to help out their families in the FGDs conducted by PIMA foundation and ILO, many were also unsuccessful in finding work.
Chart 18: Composition of Unemployed by Age
Composition of Unemployed by Age
0% 20% 40% 60% 80% 100%
Jan '08 Apr '08 July '08 Oct '08 Jan '09 Apr '09 July '09 Oct '09 65+ 55-64 45-54 35-44 25-34 15-24
Source: National Statistics Office
The female share in the jobless population also increased during the crisis months, January to July 2009. Many workers from the semi-conductor industry gravely affected by the crisis were women. Again this was confirmed by the various female displaced workers in the FGDs conducted by PIMA-ILO and the ADB.
Chart 19: Composition of Unemployed by Sex
Composition of Unemployed by Gender
0 20 40 60 80 100 120
Jan '08 Apr '08 July '08 Oct '08 Jan '09 Apr '09 July '09 Oct '09
Female Male
2. The Discouraged Workers and Underemployment
It is also noticeable that the LFPR also substantially declined in January 2009. This might probably be due to the discouraged worker effect when workers displaced during the crisis continuously fail to find alternative work. Most eventually would become self-employed and find jobs in the informal sector. This is evidenced by the increase in underemployment from a low of 17.5% in October 2008 to a high of 19.8% in July 2009 (See Chart 21). Pulse Asia even claims that underemployment reached 35% in March 20008 during a media briefing done for the Institute for Development and Econometric Analysis (Ideas).
Chart 20: Labour Force Participation Rate
Labour Force participation rate
62 62.5 63 63.5 64 64.5 65 Jan '07 Apr '07 July '07 Oct '07 Jan '08 Apr '08 July '08 Oct '08 Jan '09 Apr '09 Jul '09 Oct '09 LFPR
Source: National Statistics Office
Thus, underemployment was actually a bigger problem as many workers had no choice but to accept lower quality jobs if they want to avoid being jobless. Notice that underemployment has plagued the labour market even before the crisis exploded. However, from October 2008 to July 2009, underemployment increased. This can be confirmed by anecdotes from the FGDs where the displaced workers turned to micro businesses, part time jobs like driving tricycles, becoming painters or engaging in laundry services (PIMA-ILO, 2009)
Chart 21: Underemployment Rates January 2007 – October 09 Underemploment Rates 0 5 10 15 20 25 Jan '07 Apr '07 July '07 Oct '07 Jan '08 Apr '08 July '08 Oct '08 Jan '09 Apr '09 Jul '09 Oct '09 Underemp
Source: National Statistics Office
The quality of employment can also be gleaned from the composition of the employed in terms of the class of workers. Note that during the crisis months from January to October 2009 almost 40% of the employed were unpaid family workers and the self employed. Women who were laid off from their previous jobs usually supplemented their income by engaging in home-based businesses or part-time employment in jobs requiring lower skills than what they were trained for, i.e., domestic help, laundry services, baby-sitting, etc.. Men, on the other hand, were more likely to be able to find a job or engage in a business that utilized their skills i.e. tricycle driver, carpenter, painter, etc.
Chart 22: Class of Workers 2009
0% 20% 40% 60% 80% 100%
Jan '09 Apr '09 Jul '09 Oct '09
Class of Workers 2009
Employer Self Employed Unpaid Family Wage and Salary
In terms of sectors, most of the underemployed are found in the agriculture but during the crisis months, the services sector increased its share among the ranks of the underemployed. The services sector encompasses a diversity of sub-sectors, many of which are characterized by their nature of being micro-businesses and by their informality. Some of the micro businesses in the informal sector also suffered during the crisis especially those catering to the employees and workers of affected industries like Business Process Outsourcing and semi-conductors (Lopez, 2009)
Chart 23: Underemployment in the Major Sectors
Composition of Underemployed by Sector
0% 10% 20% 30% 40% 50% 60% 70% 80% 90% 100% Jan '08 Apr '08 July '08 Oct '08 Jan '09 Apr '09 July '09 Oct '09 Services Industry Agriculture
Source: National Statistics Office
3. Poverty, Hunger and Risks of not Attaining MDG Targets Self Rated Poverty still at high levels
Increased unemployment and underemployment among the labour force will eventually lead to higher poverty incidence. According to the World Bank in its November Quarterly Report, poverty incidence is projected to increase by 1 to 1.5% at the minimum. Crisis situations impoverish vulnerable workers already near the threshold as they lose their jobs or their incomes markedly decline. Household surveys by government to ascertain poverty levels are done every three years and the most recent one administered was last year. However, processed results will be released only late this year.
Using a smaller sample size and self rating, the Social Weather Stations (SWS) is able to track down poverty quicker. The following chart shows self rated poverty during the crisis months. Self rated poverty has actually hovered around 50% although it reached a peak of 59% in June 2008 during a period of double digit inflation resulting from the rice crisis and increasing prices of oil.