The 2014 Benchmark Report
Becoming a Dynamic Services Firm
For more information on Service Performance Insight, please visit:
www.spiresearch.com
Service Performance Insight (SPI) is a global research, consulting and training organization dedicated to helping professional service organizations (PSOs) make quantum improvements in productivity and profit. In 2007, SPI developed the PS Maturity Model™ as a strategic planning and management framework. It is now the industry-leading performance improvement tool used by over 10,000 service and project-oriented organizations to chart their course to service excellence.
The core tenet of the PS Maturity Model™ is PSOs achieve success through the optimization of five Service Performance Pillars™:
Leadership – Vision, Strategy and Culture Client Relationships
Human Capital Alignment Service Execution
Finance and Operations
The SPI Advantage – Research
Service Performance Insight provides an informed and actionable third-party perspective for clients and industry audiences. Our market research and reporting forms the context in which both buyers and sellers of information technology-based solutions maximize the effectiveness of solution development, selection, deployment and use.
The SPI Advantage – Consulting
Service Performance Insight brings years of technology service leadership and experience to every consulting project. SPI Research helps clients ignite performance by objectively assessing strengths and weaknesses to develop a full-engagement improvement plan with measurable, time-bound objectives. SPI Research offers configurable programs proven to accelerate behavioral change and improve bottom line results for our clients.
To provide us with your feedback on this research, please send your comments to: [email protected] or [email protected]
The information contained in this publication has been obtained from sources Service Performance Insight believes to be reliable, but is not guaranteed by SPI Research. All forecasts, analyses, recommendations, etc. whether delivered orally or in writing, are the opinions of SPI Research consultants, and while made in good faith and on the basis of information before us at the time, should be considered and relied on as such. Client agrees to indemnify and hold harmless SPI Research, its consultants, affiliates, employees and contractors for any claims or losses, monetary or otherwise, resulting from the use of strategies, programs, counsel, or information provided to client by SPI Research or its affiliates.
The trademarks and registered trademarks of the corporations mentioned in this publication are the property of their respective holders. © 2014 Service Performance Insight, Liberty Township, Ohio
Service Performance Insight trademarks “Professional Services Maturity Model™”,
“Professional Services Maturity™ Benchmark Report”, “Service Performance Pillars™”,
“Service Lifecycle Management Maturity Model™”, and “SLM3™”.
The information contained in this publication has been obtained from sources Service
Performance Insight believes to be reliable, but is not guaranteed by SPI Research.
The trademarks and registered trademarks of the corporations mentioned in this publication
are the property of their respective holders.
This document is the result of primary research performed by SPI Research. SPI Research’s
methodologies provide for objective fact-based research and represent the best analysis
available at the time of publication. Unless otherwise noted, the entire contents of this
publication are copyrighted by SPI Research and may not be reproduced, distributed,
archived or transmitted in any form or by any means without prior written consent by SPI
Research.
You may download this report and print a copy for your personal use, but you may not
distribute it, reproduce it, or alter it in any way or store it in a retrieval system without prior
written consent.
Service Performance Insight (SPI Research) is a global research, consulting and training organization dedicated to helping professional service organizations (PSOs) make quantum improvements in productivity and profit. In 2007, SPI developed the PS Maturity Model™ as a strategic planning and management framework. It is now the industry-leading performance improvement tool used by over 10,000 service and project-oriented organizations to chart their course to service excellence.
SPI provides a unique depth of operating experience combined with unsurpassed analytic capability. We not only diagnose areas for improvement but also provide the business value of change. We then work collaboratively with our clients to create new management processes to transform and ignite performance.
Visit www.SPIresearch.com for more information on Service Performance Insight, LLC. © 2014 Service Performance Insight
© 2014 Service Performance Insight http://www.microsoft.com/en-us/dynamics/service-industries.aspx i
Greetings from Microsoft Dynamics ... x
1.
Introduction ... 1
Why Benchmark? ... 1
2014 – Stormy Seas Ahead? ... 2
2.
The Professional Services Maturity™ Model
... 9
Service Performance Pillars™ ... 10
Professional Services Maturity™ Model Benchmark Levels ... 11
Building the Professional Services Maturity™ Model ... 13
Why Maturity Matters ... 14
Pillar Importance and Organizational Maturity ... 15
3.
Survey Demographics ... 17
4.
Professional Services Business Applications ... 29
Primary Professional Services Business Applications ... 29
Solution Satisfaction ... 34
The Professional Service IT Maturity™ Model ... 47
5.
Leadership Pillar ... 49
Symptoms of Leadership Issues ... 50
Does Leadership Matter? ... 51
Survey Results ... 55
6.
Client Relationships Pillar ... 63
PS Sales Maturity ... 64
PS Sales Effectiveness Metrics ... 65
PS Marketing Maturity ... 67
Survey Results ... 70
7.
Human Capital Alignment Pillar ... 87
Human Capital Alignment Trends ... 88
Survey Results ... 91
8.
Service Execution Pillar ... 117
Strategic Resource Management for PSOs ... 117
Survey Results ... 120
© 2014 Service Performance Insight http://www.microsoft.com/en-us/dynamics/service-industries.aspx ii
Income Statements ... 153
10.
The Professional Services Maturity Model™
... 158
Maturity Levels ... 158
Model Improvements... 159
Model Inputs ... 160
Model Results ... 161
The Financial Benefits of Moving Up Levels ... 162
Model Conclusions ... 164
11.
2014 Best-of-the-Best ... 165
Introducing the 2014 Best-of-the-Best Service Organizations ... 165
Demographics ... 167
Pillar Performance ... 167
Best-of-the-Best Conclusions ... 172
12.
Conclusions ... 174
13.
Appendices ... 175
Appendix A: Acronyms Used in This Report ... 175
Appendix B: Financial Terminology ... 176
Professional Services Performance Acceleration Program ... 182
About Service Performance Insight ... 184
Figures
Figure 1: Year-over-year Change in PS Revenue ... 3Figure 2: Professional Services Profit ... 4
Figure 3: Annual Employee Attrition – 2009-2013 ... 4
Figure 4: Billable Utilization – 2009-2013 ... 5
Figure 5: Percentage of Billable Employees ... 5
Figure 6: Annual Revenue per Billable Consultant ... 7
Figure 7: Annual Revenue per Employee ... 7
Figure 8: Service Performance Pillars™ ... 10
Figure 9: Services Maturity™ Model Levels ... 11
Figure 10: Service Performance Pillar Maturity™ ... 13
Figure 11: Professional Services Maturity™ Progression ... 15
© 2014 Service Performance Insight http://www.microsoft.com/en-us/dynamics/service-industries.aspx iii
Figure 14: Independent vs. Embedded Survey Organizations Surveyed (2007 – 2013) ... 24
Figure 15: Organization Size ... 24
Figure 16: Headquarters Location – Region ... 25
Figure 17: Total Professional Services Revenue ... 25
Figure 18: Year-over-Year Change in PS Revenue ... 26
Figure 19: Year-over-Year Change in PS Headcount ... 26
Figure 20: Percentage of Employees Billable/Chargeable ... 27
Figure 21: Percentage of PS Revenue Delivered by 3rd-parties ... 27
Figure 22: Mergers & Acquisitions over the Past Three Years ... 28
Figure 23: Core Professional Services Business Applications... 29
Figure 24: Commercial Solution Adoption ... 33
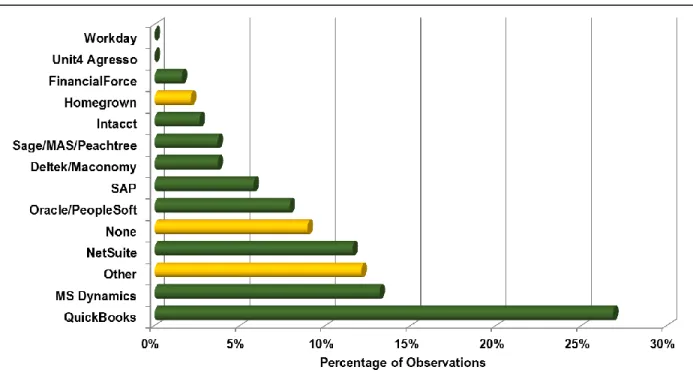
Figure 25: Financial Management Solution Used ... 35
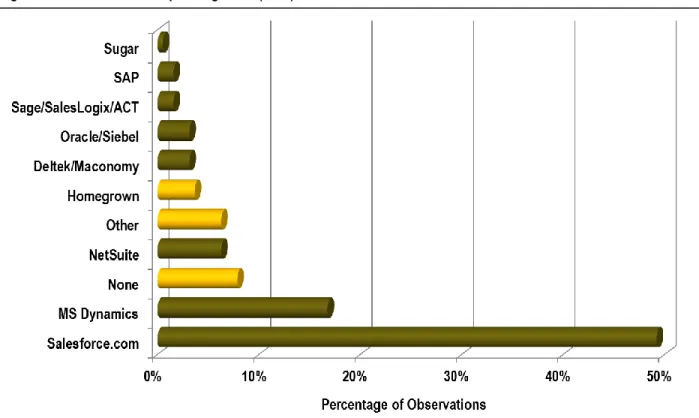
Figure 26: Client Relationship Management (CRM) Solution Used ... 37
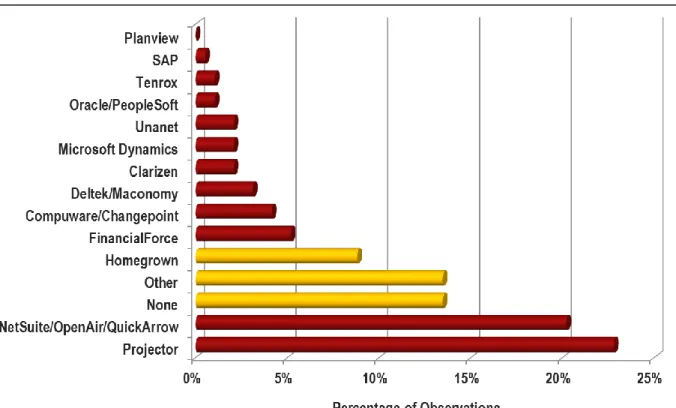
Figure 27: Professional Services Automation (PSA) Solution Used ... 39
Figure 28: Human Capital Management (HCM) Solution Used ... 40
Figure 29: Business Intelligence (BI) Solution Used ... 42
Figure 30: Knowledge Management (KM) Solution Used ... 43
Figure 31: Remote Service Delivery and Collaboration Tool Used ... 44
Figure 32: Social Media (SM) Solution Used ... 45
Figure 33: Is CRM Integrated with PSA? ... 46
Figure 34: Professional Service IT Maturity™ Level ... 47
Figure 35: Type of Work Sold ... 72
Figure 36: Primary Service Sales Measurement ... 74
Figure 37: Primary Service Target Buyer ... 75
Figure 38: Bid-to-Win Ratio ... 76
Figure 39: Deal Pipeline Relative to Quarterly Bookings Forecast... 77
Figure 40: Primary Group Responsible for New Solution Development ... 79
Figure 41: Why Employees Leave ... 96
Figure 42: Billable Utilization – 2009-2013 ... 101
Figure 43: Resource Management Process ... 122
Figure 44: Project Staffing Time (days) ... 123
© 2014 Service Performance Insight http://www.microsoft.com/en-us/dynamics/service-industries.aspx iv
Figure 48: Project Margin Five Year Trend ... 145
Figure 47: Project Margin... 145
Figure 49: Professional Services Maturity™ Model Levels... 158
Figure 50: Key Performance Indicators (KPIs) are Correlated ... 164
Tables
Table 1: Five Year PS Key Performance Metrics... 2Table 2: Hourly Bill Rate by Role and Organization Type ... 6
Table 3: Maturity Matters! ... 9
Table 4: Performance Pillars Mapped Against Service Maturity ... 13
Table 5: Service Pillar Importance by Organizational Maturity Level ... 15
Table 6: The Service Market is Huge, and Growing ... 17
Table 7: Vertical PS Markets — the North American Industry Classification System ... 18
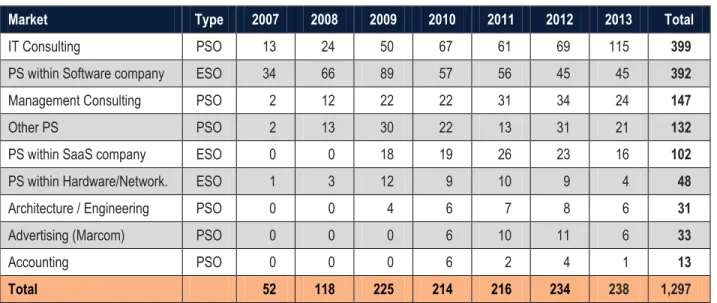
Table 8: Number of Participating Firms by Vertical Market (2007 through 2013) ... 21
Table 9: Demographics by Vertical Market ... 21
Table 10: Demographics by Organization Type and Geographic Region ... 22
Table 11: Demographics by Organization Size ... 23
Table 12: Commercial Solution Adoption ... 30
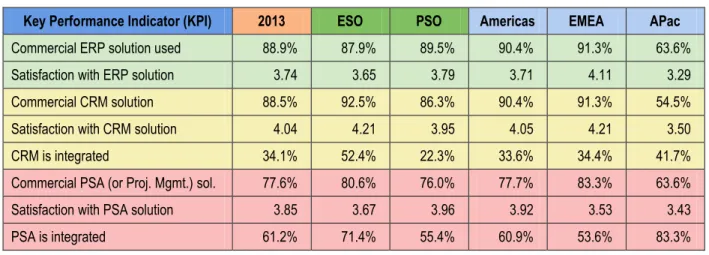
Table 13: Business Application Use by Organization Type and Geographic Region ... 30
Table 14: Business Application Use by Organization Size ... 31
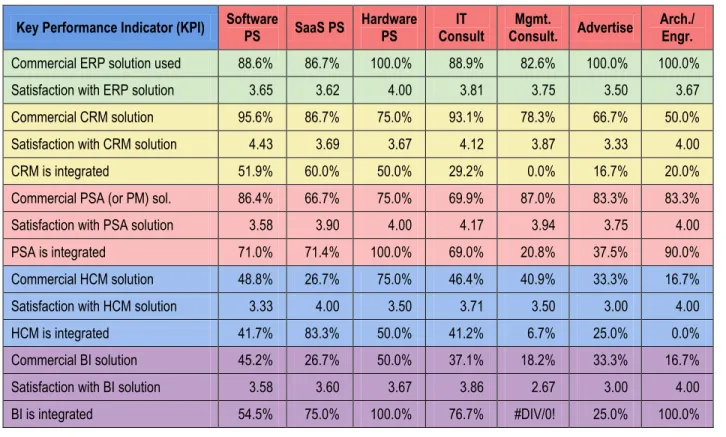
Table 15: Business Application Use by Vertical Service Market ... 32
Table 16: PSO Departments and Information Needs ... 34
Table 17: Solution Satisfaction ... 34
Table 18: Impact – Client Relationship Management (CRM) Use ... 37
Table 19: Impact – Commercial CRM Integration ... 38
Table 20: Impact – Professional Services Automation (PSA) Use ... 39
Table 21: Impact – Human Capital Management (HCM) Use ... 41
Table 22: Impact – Business Intelligence (BI) Use ... 42
Table 23: Impact – Knowledge Management (KM) Use ... 43
Table 24: Integration with Core Financials ... 46
Table 25: The Leadership Maturity Model ... 49
© 2014 Service Performance Insight http://www.microsoft.com/en-us/dynamics/service-industries.aspx v
Table 28: Organizational Culture by PS Market ... 55
Table 29: Well understood vision, mission and strategy ... 55
Table 30: Confidence in PS leadership ... 56
Table 31: Goals and measurement in alignment ... 56
Table 32: Employees have confidence in the PSO’s future... 57
Table 33: Ease of getting things done ... 57
Table 34: Effectively communicates w/employees ... 58
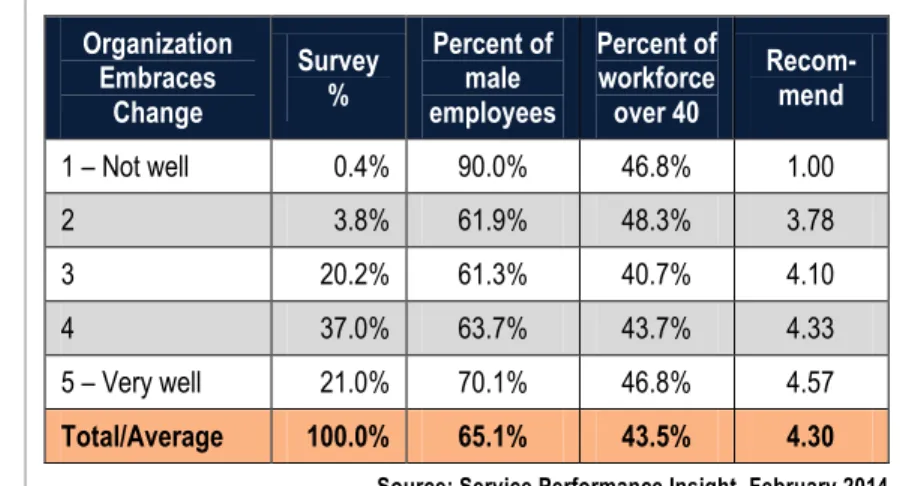
Table 35: Organization Embraces Change, is Nimble and Flexible ... 58
Table 36: Impact – PS Innovation Focus ... 59
Table 37: Year-over-year Change in Top Challenges ... 60
Table 38: Organizational Challenges by Organization Type and Geographic Region ... 61
Table 39: Steps Taken to Improve Profitability Comparison ... 62
Table 40: Client Relationship Business Process Maturity ... 63
Table 41: PS Sales Maturity Definitions ... 64
Table 42: PS Sales Maturity Progression ... 65
Table 43: Sales Effectiveness Metrics ... 66
Table 44: Impact – Service Sales Effectiveness Impact on Performance ... 66
Table 45: PS Marketing Maturity Levels ... 68
Table 46: PS Marketing Maturity™ Progression ... 69
Table 47: Impact – Marketing Effectiveness Impact on Performance ... 70
Table 48: Client Relationships KPIs by Organization Type and Geographic Region ... 70
Table 49: Client Relationships KPIs by Organization Size ... 71
Table 50: Client Relationships KPIs by Vertical Service Market ... 71
Table 51: Type of Work Sold by Organization Type and Geographic Region ... 73
Table 52: Impact – Percentage of Business from New Clients... 73
Table 53: Impact – The Effect of Sales Measurements on Performance ... 74
Table 54: Impact – The Effect of Primary Buyer Type on Performance ... 76
Table 55: Impact – The effect of improving the Bid-to-Win Ratio ... 77
Table 56: Impact – Length of Sales Cycle on Performance ... 78
Table 57: Impact – Client Referenceability ... 78
Table 58: Impact - The Impact of Solution Development Effectiveness on Performance ... 79
© 2014 Service Performance Insight http://www.microsoft.com/en-us/dynamics/service-industries.aspx vi
Table 61: Fee Structure by Service Market Vertical ... 81
Table 62: Annual Service Sales Revenue Quota per Person ... 83
Table 63: Percentage of Service Sales Representatives Who Achieve Annual Quota ... 83
Table 64: Professional Services Sales KPI’s by Organization Type and Geography ... 84
Table 65: Professional Services Sales KPI’s by Organization Size ... 84
Table 66: Professional Services Sales KPI’s by Position by PS Market ... 85
Table 67: Performance Pillars Mapped Against Service Maturity ... 87
Table 68: An Aging Workforce – Marginalized Youth ... 88
Table 69: Most Effective Retention Strategies by Generation ... 89
Table 70: Human Capital Alignment by Organization Type and Geographic Region ... 92
Table 71: Human Capital Alignment by Organization Size ... 92
Table 72: Human Capital Alignment by Vertical Service Market ... 93
Table 73: Workforce Age and Gender by Organization Type and Geographic Region ... 94
Table 74: Workforce Age and Gender by Organization Size ... 94
Table 75: Workforce Age and Gender by Vertical Service Market ... 94
Table 76: Impact – Annual Employee Attrition ... 95
Table 77: Impact – Recommend to Family and Friends ... 97
Table 78: Impact – Management-to-Employee Ratio ... 97
Table 79: Impact – Time to Recruit and Hire for Standard Positions ... 98
Table 80: Impact – Time to Become Productive ... 99
Table 81: Impact – Guaranteed Training... 99
Table 82: Impact – Well-understood Career Path ... 100
Table 83: Impact – Billable Utilization... 101
Table 84: Target Utilization by Organization Type and Geographic Region ... 102
Table 85: Target Utilization by Organization Size ... 102
Table 86: Target Utilization by Vertical Service Market... 103
Table 87: Annual Hour Comparison by Organization Type ... 103
Table 88: Annual Hour Comparison by Region ... 104
Table 89: Annual Hour Comparison by Organization Size (< 100 employees) ... 104
Table 90: Annual Hour Comparison by Organization Size (> 100 employees) ... 105
Table 91: Annual Hour Comparison by Embedded Service Organization Type ... 105
© 2014 Service Performance Insight http://www.microsoft.com/en-us/dynamics/service-industries.aspx vii
Table 94: Workforce Location by Organization Type and Geographic Region ... 107
Table 95: Workforce Location by Organization Size ... 107
Table 96: Workforce Location by Service Market Vertical... 108
Table 97: Five Year Total Average Compensation by Job Title ... 109
Table 98: Annual Base Salary by Organization Type (k) ... 110
Table 99: Annual Base Salary by Region (k) ... 110
Table 100: Annual Base Salary by Organization Size (< 100 employees) (k) ... 111
Table 101: Annual Base Salary by Organization Size (> 100 employees) (k) ... 111
Table 102: Annual Base Salary by Embedded Service Organization Type (k) ... 112
Table 103: Annual Base Salary by IT and Management Consultancy (k) ... 112
Table 104: Annual Base Salary by PS Market (Advertising, Arch/Engineering Other PS) (k) ... 113
Table 105: Variable Compensation by Organization Type (k) ... 113
Table 106: Variable Compensation by Region (k) ... 114
Table 107: Variable Compensation by Organization Size (< 100 employees) ... 114
Table 108: Variable Compensation by Organization Size (> 100 employees) ... 115
Table 109: Variable Compensation by Embedded Service Organization Type ... 115
Table 110: Variable Compensation by IT and Management Consultancy ... 116
Table 111: Variable Compensation by PS Market (Advertising, Arch./Engr., Other PS) ... 116
Table 112: Service Execution Performance Pillar Mapped Against Service Maturity ... 117
Table 113: Impact – Resource Management Strategy ... 118
Table 114: Service Execution KPIs by Organization Type and Geographic Region ... 120
Table 115: Service Execution KPIs by Organization Size ... 121
Table 116: Service Execution KPIs by Vertical Service Market... 121
Table 117: Impact – Project Team Size (people) ... 123
Table 118: Impact – No. of Concurrent Projects Managed by Project Mgr. ... 124
Table 119: Impact – Project Duration ... 124
Table 120: Impact – On-time Delivery ... 125
Table 121: Impact – Project Cancellation ... 126
Table 122: Impact – Average Project Overrun ... 126
Table 123: Impact – Standardized Delivery Methodology Use ... 127
Table 124: Impact – Resource Management Effectiveness ... 127
© 2014 Service Performance Insight http://www.microsoft.com/en-us/dynamics/service-industries.aspx viii
Table 127: Impact – Effectiveness of Project Quality Processes ... 129
Table 128: Impact – Effectiveness of Knowledge Management processes ... 130
Table 129: Finance and Operations Performance Pillar Maturity ... 131
Table 130: Finance & Operations KPIs by Organization Type and Geographic Region ... 132
Table 131: Finance and Operations KPIs by Organization Size ... 133
Table 132: Finance and Operations KPIs by Vertical Service Market ... 134
Table 133: Hourly Bill Rates by Organization Type ... 135
Table 134: Hourly Bill Rate by Role and Organization Type ... 136
Table 135: Hourly Bill Rates by Region ... 136
Table 136: Hourly Bill Rates for Small Organizations ... 137
Table 137: Hourly Bill Rates for large organizations (> 100 employees) ... 137
Table 138: Hourly Bill Rates by Embedded Service Organization ... 138
Table 139: Hourly Bill Rates by Embedded Service Organization Type (k) ... 138
Table 140: Hourly Bill Rates by IT and Management Consultancy (k) ... 139
Table 141: Hourly Bill Rates by PS Market (Advertising, Arch/Engineering Other PS) (k) ... 139
Table 142: Targets by Role – Americas ... 140
Table 143: Targets by Role – EMEA... 140
Table 144: Targets by Role – APac ... 141
Table 145: Steps Taken to Improve Profitability Comparison: 2012-2013 ... 141
Table 146: Impact – Revenue per Billable Consultant ... 142
Table 147: Impact – Annual Revenue per Employee ... 143
Table 148: Impact – Revenue per Project Comparison... 144
Table 149: Impact – Project Margin – Fixed Price Projects ... 146
Table 150: Impact – Project Margin – Time and Expense Projects ... 146
Table 151: Impact – Project Margin – Subcontractors/Offshore ... 147
Table 152: Impact – Quarterly Revenue Target in Backlog ... 147
Table 153: Impact – Percentage of annual target revenue achieved ... 148
Table 154: Impact – Percentage of Annual Target Margin Achieved ... 149
Table 155: Impact – Revenue Leakage ... 149
Table 156: Invoices Redone due to Errors or Client Rejections ... 150
Table 157: Days Sales Outstanding (DSO) ... 150
© 2014 Service Performance Insight http://www.microsoft.com/en-us/dynamics/service-industries.aspx ix
Table 160: Real-Time Visibility ... 152
Table 161: Income Statement by Organization Type and Embedded Service Type ... 154
Table 162: Income Statement by Organization Size ... 155
Table 163: Income Statement by Position by PS Market ... 156
Table 164: Minimum Normalized Performance Pillar Scores ... 160
Table 165: Average Service Maturity by PSO Size (People) ... 161
Table 166: Average Service Maturity by PSO Type ... 161
Table 167: Average Service Maturity by Vertical Market ... 162
Table 168: Key Performance Indicators (KPIs) by Maturity Levels ... 162
Table 169: Best-of-the-Best Comparison – Demographics ... 165
Table 170: Best-of-the-Best Comparison – Leadership Pillar (1 to 5 Scale) ... 168
Table 171: Best-of-the-Best Comparison – Client Relationships Pillar ... 168
Table 172: Best-of-the-Best Comparison – Human Capital Alignment Pillar ... 169
Table 173: Best-of-the-Best Comparison – Service Execution Pillar ... 170
Table 174: Best-of-the-Best Comparison – Finance and Operations Pillar ... 171
Table 175: Best-of-the-Best Comparison – Income Statement ... 172
Table 176: Lexicon of Acronyms and Abbreviations ... 175
© 2014 Service Performance Insight http://www.microsoft.com/en-us/dynamics/service-industries.aspx x Dear Reader,
Professional services firms around the world have long used Microsoft software and services to author documents, communicate with clients and colleagues, and collaborate across geographic, organizational and even cultural boundaries. Indeed, power users in various professions are among our lead users – individuals who test the limits of what can be done and help Microsoft identify simpler as well as more powerful ways to apply our software and devices to productive outcomes.
As Microsoft intensifies our focus on mobile and cloud-based computing experiences, now more than ever, we are delving deeply into the ways in which professional services firms engage with clients and deliver services. We are constantly improving our understanding of how day-to-day client service and practice support activities tie to levers of the business. And we are rethinking what is possible at every step, all with a clear objective to deliver solutions that are easier than ever to deploy and use, can better anticipate and enable user actions, and do more to deliver practical business results.
Our continuing association with SPI Research and sponsorship of the annual Benchmark Report is an essential bridge in this endeavor. Microsoft partners with Service Performance Insight (SPI) to help build shared insight into the professional services industry across our diverse customer base, field team and partner ecosystem. The Benchmark Report offers both a quantitative and qualitative framework for understanding how firms operate, which is an essential foundation for collaborative discussion of what’s working and what’s not in a given firm. Points of reference enable discussion of transformational change that may deliver next level performance. And performance measures establish goals for planning and execution of initiatives that evolve people, process, technology and culture towards a compelling future-state.
Many firms use this report as a comparative baseline for an annual health check. Some view it as a tool for collaboration with business partners to improve shared business practices. However you choose to leverage the information herein, we encourage you to invest the time to explore this year’s results and consider whether your market strategies, operational practices and administrative policies position your firm for success.
As always, as opportunities arise for refinement of strategies and tactics, we invite you to reach out to Microsoft and our partners for insights into information technology practices that help make change easier to execute and improve ongoing organizational agility.
Best wishes for an informative read and healthy dialog! Sincerely,
Elliott Ichimura Ted Kempf
Global Industry Director, Service Industries US Service Industries Director
Microsoft Dynamics Microsoft Dynamics
© 2014 Service Performance Insight http://www.microsoft.com/en-us/dynamics/service-industries.aspx 1
1.
INTRODUCTION
Service Performance Insight (SPI Research) is proud to introduce the seventh-annual Professional Services Maturity™ Benchmark. Over the past seven years we have researched, benchmarked and built a maturity model to help professional services (PS) executives better understand how their organization compares to others that are both similar in size and scope of work, as well as to the broader professional services market. The maturity model and the concepts behind it have gained international attention. SPI Research has consulted with organizations around the globe to implement its concepts and to provide focus on the most important areas for performance improvement.
In May, 2013 SPI Research was highlighted in the prestigious Harvard Business Review. There is no doubt the benchmark and
maturity model have gained international recognition. Whether small or large, embedded or
independent, Professional Service teams around the world use the PS Maturity Model™ and its 195 Key Performance Indicators (KPIs) to benchmark and improve performance.
Why Benchmark?
The concepts underlying the Professional Services Maturity™ Benchmark were developed eight years ago to better understand how professional services organizations compared to others in similar
markets. For instance, if last year a professional services organization (PSO) had a net profit of 10%, was that good or bad relative to the marketplace? If profit went up to 12% the following year, was that a significant improvement? The problem is most PS executives only understand how their own
organization operates; they don’t have visibility into how the overall market is performing and how they compare.
The purpose of the benchmark is to show both averages of major key performance indicators as well as compare year-over-year changes, challenges and trends. These annual comparisons help the market better understand how the professional services market is growing or contracting, and what the associated metrics predict about its future.
During the past seven years over 10,000 organizations have used this benchmark to support organizational transformation initiatives and quantify the benefits of change. By analyzing the benchmark data by vertical market, geographic region and organization size, PS executives have an “apples-to-apples” comparison to their peers and the market at large. Over 1,500 firms have completed SPI’s benchmarking surveys over the past seven years.
© 2014 Service Performance Insight http://www.microsoft.com/en-us/dynamics/service-industries.aspx 2 What SPI Research has found interesting, and hope you do too, is how the market changes on an annual basis, and where PS executives have concerns, and therefore how they prioritize initiatives to better compete in the marketplace. The professional services market has been on a roller coaster ride that mirrors the global economy at large. It truly provides a leading indicator of things to come as executives in other industries depend on its advice and guidance. Therefore, the professional services market must always look ahead to spot trends before they happen to better understand where the economy is going and what they can do to help its propulsion.
2014
–
Stormy Seas Ahead?
2013 turned out to be a tough year for the PS industry – most major PS metrics declined, propelled by slowing revenue growth (Table 1). 2013 year-over-year revenue growth (10%) slowed considerably from 2011 (13.7%) when embedded and independent professional service firms alike experienced a dramatic uptick in business after weathering the recession. The PS industry is a bell-weather for the global economy as PS engagements typically portend global business shifts. A case in point, for the PS
industry, growth stalled but never declined during the depths of the recession in 2009; PS started a full-scale recovery in 2010 in advance of the overall economy. Likewise, PS organizations curtailed hiring in 2009 but resumed
adding employees in 2010 in advance of traditional businesses. A tale of two extremes underlying the benchmark average is that 38% (88 firms) of the 238 organizations in the 2014 benchmark reported year-over-year revenue growth of less than 5%. 14.4% (33
firms) reported negative growth. These metrics compare unfavorably to 2011 in which only 13.3% (28 firms) reported negative growth. In 2013 only 30.9% (71 firms) reported year over year revenue growth in excess of 15% compared to 45.2% (75 firms) in 2011.
In PS the link between growth and profitability is undeniable as this people-based business always operates at its best when it is running at full capacity. Having more work is always preferable to not having enough work because PSOs are adept at rising to the challenge of too much work whereas they become complacent and disenfranchised when not enough work is available.
Slowing growth manifested in excess capacity, lower utilization, lower revenue per person and higher levels of attrition. Slowing PS industry growth hit the bottom-line hard as we saw net profit decline precipitously from 16.8% last year to 11.4% this year. These negative trends are very disturbing and
Table 1: Five Year PS Key Performance Metrics
Key Performance Indicator (KPI) 2009 2010 2011 2012 2013 Annual PS revenue growth 3.6% 7.6% 13.7% 11.5% 10.0% Annual PS headcount growth 2.8% 6.9% 10.1% 8.9% 7.5% Percentage of billable personnel 69.6% 70.8% 74.2% 75.2% 71.2% Employee Attrition 6.1% 6.8% 7.4% 7.2% 8.3% Annual revenue per consultant (k) $205 $184 $197 $206 $193 Annual revenue per employee (k) $177 $156 $167 $168 $155
Profit (EBITDA %) NA 16.1% 13.5% 16.8% 11.4%
© 2014 Service Performance Insight http://www.microsoft.com/en-us/dynamics/service-industries.aspx 3 may indicate the technology PS market has become over-saturated with too many firms chasing too little business. This slow-down also reflects the general malaise in enterprise software and hardware as technology growth has shifted to consumers with smart phones, tablets, social media and the cloud; away from large-scale enterprise IT.
SPI Research recommends caution in 2014 for traditional enterprise PS suppliers. Now is the time to revisit strategies and make adjustments to ensure your organization is in-front of shifting business trends.
Slowing Growth – watch out!
The professional services market is accustomed to high levels of growth. Back in the early 2000’s annual revenue growth rates of 15% to 20% were the norm. As the global economy dipped into a protracted recession the professional services market also retrenched but never to the point of flat or negative growth. In SPI Research's seven years of benchmarking the average annual growth rate has never been negative (Figure 1). 2009 represented the low point of year over year revenue growth at 3.6% while 2007 growth of 17.2% was the most recent high point.
The 2013 survey showed an average growth rate of 10%, which was 13% lower (on a relative basis) than 2012 growth of 11.5%. This sharp decline from 2011/2 affected all geographies and all PS sub-segments except Marketing and Communications and SaaS. Hardest hit were accountancies, architects and engineers, and hardware PS organizations. By geography, APac experienced the greatest slowdown while EMEA experienced the highest relative growth after weathering a prolonged recession and sovereign debt crisis. Even this year’s Best-of-the-Best experienced a dramatic decline in revenue growth from 18.7% last year to only 11% this year.
With stock markets reaching all-time highs, SPI Research was shocked to discover the malaise in the PS industry. Only the smallest organizations, those with less than 10 employees, grew more in 2013 than they did in 2012 while the largest organizations were disproportionately disadvantaged, reporting revenue growth of 4.8% this year compared to 10% last year. SPI Research is starting to see
commoditization and rate erosion in many markets – average bill rates for independents declined year-over-year, which also contributed to the sharp decline in revenue per person and net profit. The low end of the market – staff augmentation and managed services – is experiencing contraction and
Figure 1: Year-over-year Change in PS Revenue
© 2014 Service Performance Insight http://www.microsoft.com/en-us/dynamics/service-industries.aspx 4 significant rate pressure, but the upper end of the market for unique, specialized expertise is still growing and profitable. Growth rates over 10% generally portend increased hiring. Growth below 10% can be managed through efficiency gains, increased utilization and use of third-party contractors, which means most sectors of the PS market will not expand hiring substantially if slow growth persists.
Plummeting Profit
In the PS industry, slowing growth is a powerful predictor of profit declines. This year’s benchmark reflected a net profit
deterioration of more than 5 basis points from 16.8% in 2012 to 11.4% in 2013 – erasing all the sector profit improvements made since the recession (Figure 2). Although PS profit is still
acceptable compared to other industry sectors like
manufacturing and retail, where razor-thin margins are the norm, the sharp decline in this
benchmark should be cause for alarm and could indicate a more dangerous trend of overcapacity.
Attrition Rises While Utilization Declines Two of the most important
metrics – attrition and billable utilization – took a nose dive in 2013. SPI Research has been predicting attrition would rise as the economy improved and employees took advantage of new opportunities outside of their current firms. In 2013, attrition hit the highest level (8.3%) since the recession of (Figure 3).
Attrition is an important metric because the cost to replace a
Figure 2: Professional Services Profit
Source: Service Performance Insight, February 2014
Figure 3: Annual Employee Attrition – 2009-2013
© 2014 Service Performance Insight http://www.microsoft.com/en-us/dynamics/service-industries.aspx 5 consultant is so high. On average
it takes 130 business days to find, hire and ramp a new consultant translating into a replacement cost of nearly $200,000 per consultant. Organizations faced with significant attrition are unable to grow and expand while quality suffers from a knowledge exodus. 2013 saw attrition increase in all geographies, verticals and organization sizes as the job market heated up and the war for talent led to defections. This problem is not going away due to the growing talent
shortage in critical Science, Technology, Engineering and Math skills.
PSOs experienced a double-whammy this year because not only did attrition increase but at the same time billable utilization declined. Embedded PS organizations improved utilization from 65.1% in 2012 to 68.3% in 2013 while
independents experienced a steep decline from 73.2% to 70.2%. By vertical; SaaS, Software and Management consultancies all reported billable utilization of 67%; hardware reported 75% and managed services reported 80%. Billable utilization in combination with realized bill rates is the most important profit lever. Declining utilization trends signal
overcapacity. Corrective action in terms of improving sales and marketing and increased emphasis
on resource management is warranted to avoid staff reductions. Too much overhead
Another key performance indicator that plummeted this year is the percentage of employees who are billable as compared to non-billable management, sales and administrative personnel. In 2009 this metric was less than 70%, but it improved significantly in 2011 and 2012 but dramatically declined in
Figure 4: Billable Utilization – 2009-2013
Source: Service Performance Insight, February 2014
Figure 5: Percentage of Billable Employees
© 2014 Service Performance Insight http://www.microsoft.com/en-us/dynamics/service-industries.aspx 6 2013. The percentage of billable staff is now 71.2% of total staff (Figure 5). While this change might not sound significant, it bodes negatively for profitability, as billable staff must carry the cost of non-billable staff against a backdrop of slowing top-line revenue. Firms can afford to increase non-billable staff when the market is robust and business is plentiful but non-billable staff becomes an expensive burden when growth slows. Now is a good time for PS organizations to take stock and frankly appraise whether they have over-hired non-billable staff in anticipation of robust business expansion which did not materialize. Are they carrying too much administrative overhead because they haven’t invested in integrated business applications? Besides the administrative cost of non-integrated systems;
inaccuracies, delays, and lack of real-time information visibility can have a crushing impact on long term growth. PS executives should closely monitor this key performance indicator to ensure their
organizations have not become top-heavy with excessive non-billable staff as morale and profit will certainly be impacted.
Bill Rates Decline
In 2012 SPI Research saw a dramatic increase in bill rates of almost 3% across the board, which fueled profit. This positive trend was reversed in 2013 particularly for independents that experienced bill rate erosion of more than 2%. Embedded organizations were able to hold their own and even reported rate increases for most positions. The rate disparity between embedded and independents has widened with a spread of more than $40 per hour for most positions. This decline in bill rates combined with more management overhead and lower consultant productivity and billable utilization explains the dramatic decline in net profit shown in this year’s survey. 2013 turned out to be a lackluster year for PS across almost all verticals and geographies. Caution is advised going into 2014. Now is a good time to take stock of the overall business and make hard decisions about where investments should be made.
Table 2: Hourly Bill Rate by Role and Organization Type
Role
Survey ESOs PSOs
2012 2013 Change 2012 2013 Change 2012 2013 Change
Vice President $253 $208 -17.8% $243 $242 -0.4% $256 $198 -22.7% Director 213 213 0.0% 223 231 3.6% 208 204 -1.9% Delivery Manager 194 209 7.7% 216 230 6.5% 184 198 7.6% Project/Program Mgr. 183 179 -2.2% 202 207 2.5% 171 167 -2.3% Business Consultant 180 172 -4.4% 195 200 2.6% 172 160 -7.0% Sr. Tech. Consult./Engr. 182 186 2.2% 202 203 0.5% 168 175 4.2% Tech. Consultant/Engr. 161 161 0.0% 183 188 2.7% 145 150 3.4% Solution Architect 190 185 -2.6% 213 214 0.5% 173 170 -1.7%
© 2014 Service Performance Insight http://www.microsoft.com/en-us/dynamics/service-industries.aspx 7 Per Person Revenue Declines
The gloom and doom continues as SPI Research looked at the impact of lower rates, lower billable utilization and too much non-billable overhead on revenue yield per person. Both billable revenue per consultant and overall revenue per employee sharply declined in 2013. Average revenue per consultant reached a dangerous low of $193,000 (Figure 6). This figure is even more ominous when increases in base and variable compensation are factored in. Although SPI Research did not see
significant increases in compensation in 2013, we certainly did not see compensation decline. This $13,000 decline in revenue per consultant translated directly to lower bottom-line profit which was amplified in larger organizations. SPI Research has always recommended a 2X revenue labor multiplier for billable staff. This KPI means consultants should be expected to generate at least twice their loaded cost to produce enough profit to sustain and grow the PS practice.
If the decline in revenue per consultant was not bad enough, the deterioration in revenue per employee was even worse (Figure 7). Revenue per employee is an important metric because it speaks directly to the productivity and profitability of
the entire PS business. In 2013 the benchmark declined $13,000 per employee from $168,000 to
$155,000. The spread between the cost of employees and their yield is dangerously thin. If this trend continues, few PSOs will be able to make a respectable profit. The decline in this metric means PSOs are overstaffed and should consider downsizing and cost cutting if revenue per employee continues at this low level or declines further.
Figure 6: Annual Revenue per Billable Consultant
Source: Service Performance Insight, February 2014
Figure 7: Annual Revenue per Employee
© 2014 Service Performance Insight http://www.microsoft.com/en-us/dynamics/service-industries.aspx 8 Looking ahead to 2014
The high levels of growth and profit the professional services market experienced in 2011 and 2012 deteriorated in 2013 manifesting in lower per person revenue yields and sharply lower net profit. PSOs appear to have taken their eyes off the ball, resulting in weakening productivity and excessive overhead. The primary question going forward is will growth in the PS market continue to deteriorate leading to overcapacity and intensified competition or was 2013an aberration? Certainly the global economy is improving daily which portends a robust PS market, but increasing commoditization in hardware and enterprise software will have a negative impact on PS providers in those sectors.The hot growth areas of SMAC – Social, Mobile, Analytics and the Cloud mean well-run service providers in those sectors will grow and thrive. While enterprise software and hardware suppliers will be faced with increased
competition and rate erosion. Caution is advised to ensure PSOs do not increase overhead and hiring in anticipation of growth which may not happen.
The focus on greater efficiency and productivity were major reasons for success in 2013. 2014 will require greater creativity, as increased burdens, such as healthcare costs and taxes, could not only limit profitability for PSOs, but could also inhibit growth as PS clients face similar challenges.
The professional services marketplace has grown and succeeded because a majority of the organizations offer innovative services to help clients manage change and improve performance. As market dynamics change, leading PSOs have been able to adapt to take advantage of new technologies and knowledge to create leading edge solutions. 2014 will be no different in terms of the need for continuous
improvement. But, the headwinds are much stronger and the need for repeatable service offers and organizational efficiency and effectiveness will become increasingly critical to remain competitive and profitable.
© 2014 Service Performance Insight http://www.microsoft.com/en-us/dynamics/service-industries.aspx 9
2.
THE PROFESSIONAL SER
VICES MATURITY™ MODE
L
SPI Research has spent the past seven years benchmarking varying levels of operational control or process “maturity” to determine the characteristics and appropriate behaviors for PSOs based on their organizational lifecycle stage. The primary questions SPI Research was seeking to answer when the PS Maturity™ Benchmark was first conceived remain our primary focus today:
What are the most important focus areas for professional service organizations (PSOs) as their businesses mature?
What is the optimum level of maturity or control at each phase of an organization’s lifecycle? Can diagnostic tools be built for assessing and determining the health of key business
processes?
Are there key business characteristics and behaviors that spell the difference between success and failure?
The original concept behind the SPI Research’s PS Maturity Model was to investigate whether increasing levels of standardization in operating processes and management controls improve financial performance. SPI Research’s 2014 PS Maturity™ Benchmark demonstrates that increasing levels of business process maturity do indeed result in significant performance improvements (Table 3). In fact, SPI Research found that high levels of performance have far more to do with leadership
focus, organizational alignment, effective business processes and disciplined execution than "time in grade." Relatively young and fast-growing organizations can and do demonstrate surprisingly high levels of maturity and performance excellence if their charters are clear.
Further improvements accrue when their goals and
measurements are aligned with
their mission, and they make the investments they need in talent and systems to provide visibility and appropriate levels of business control. Of course, it certainly helps if they are also well-positioned within a fast-growing market.
The core tenet of the PS Maturity Model™ is service and project-oriented organizations achieve success through the optimization of five Service Performance Pillars™:
1. Leadership – Vision, Strategy and Culture 2. Client Relationships
Table 3: Maturity Matters!
Key Performance Measurement Maturity
Level 1-2 Maturity Level 3 Level 4-5 Maturity
Percentage of Respondents 55% 25% 20%
Annual revenue growth 8.8% 12.3% 10.1% Billable utilization (2,000 hours) 71.8% 72.4% 71.6% Project gross margin 34.7% 39.4% 39.0% Revenue per billable consultant (k) $166 $205 $235
PS EBITDA -1.3% 10.2% 26.9%
© 2014 Service Performance Insight http://www.microsoft.com/en-us/dynamics/service-industries.aspx 10 3. Human Capital Alignment
4. Service Execution 5. Finance and Operations
Within each of the Service Performance Pillars™, SPI Research developed guidelines and key
performance maturity measurements. These guidelines cut across the five service dimensions (pillars) to illustrate examples of business process maturity. This study measures the correlation between process maturity, key performance measurements and service performance excellence.
Service Performance Pillars
™
SPI Research developed a model that segments and analyzes a PSO into five distinct areas of performance that are both logical and functional. We call the five underpinning elements Service Performance Pillars™ because they form the foundation for all professional services organizations (Figure 8):
1. Leadership - Vision, Strategy and Culture: (CEO) a unique view of the future and the role the service organization will play in shaping it. A clear and compelling strategy provides a focus for the organization and galvanizes
action. Effective strategies bring together target customers, their business problems, and how a solution solves those problems differently, uniquely, or better than its competitors. For a service strategy to be effective, the role and charter of the service organization must be defined, embraced, communicated and supported throughout the company. Depending on whether the service strategy is to primarily support the sale of products, or to drive service revenue and profit; service organization goals and measurements will vary. Leadership skills and competencies must mature as the organization matures. Culture is the unwritten customs, behaviors and beliefs that determine the “rules of the game” for decision making, structure and power.
2. Client Relationships: (Marketing and Sales) the ability to communicate effectively with employees, partners and customers to generate and close business and win deals. Effective client management involves improving relationships to better understand client needs, while ensuring clients will continue to buy and provide references and testimonials.
3. Human Capital Alignment: (Human Resources) the ability to attract, hire, retain and motivate a high quality consulting staff. With changing workforce demographics, talent management has
Figure 8: Service Performance Pillars™
© 2014 Service Performance Insight http://www.microsoft.com/en-us/dynamics/service-industries.aspx 11 increased in importance. High-caliber employees represent the essence, brand and reputation of the firm. PSOs are starting to adopt hybrid on and off-site staffing models which put
increased pressure on customer-facing staff to develop client relationships and more carefully define client requirements. Demands for career planning, skill development and flexible work options have intensified.
4. Service Execution: (Engagement/Delivery) the methodologies, processes and tools to effectively schedule, deploy and measure the quality of the service delivery process. Service execution involves a number of factors: from resource management, to delivering projects in a predictable and acceptable time frame, to reducing cost while improving project quality and harvesting knowledge. Processes include resource management, project planning and quality control, knowledge management and methodology and tool development.
5. Finance and Operations: (CFO) the ability to manage services profit and loss — to generate revenue and profit while developing repeatable operating processes. The finance and operations pillar focuses on revenue, margin and cost and the financial, contractual and IT operating processes and controls required to run a profitable and predictable business.
Professional Services
Maturity™
Model Benchmark Levels
The model is built on the same foundation as the Capability Maturity Model (CMM), which has been adopted for software
development; but is specifically targeted toward billable PSOs, that either exclusively sell and execute professional services or
complement the sale of products with services. Figure 9 depicts maturity level progression and outlines primary characteristics for each maturity level:
∆ Level 1 — Initiated
“Heroic”: (approximately 30% of PSOs)at maturity Level 1, processes are ad hoc and fluid. The business environment is chaotic and opportunistic, and the focus for a PSO is primarily on new client acquisition and reference building. Often professional service employees at this level are chameleons — able to provide presales support one day and develop interfaces and product workarounds the next. Success depends on the competence and heroics of people in the organization, and not on the use of proven processes, methods or tools. Practices and procedures are informal and quality is based on individual experience and aptitude. Level 1 organizations are often characterized as “informal” and “heroic”.
Figure 9: Services Maturity™ Model Levels
© 2014 Service Performance Insight http://www.microsoft.com/en-us/dynamics/service-industries.aspx 12 ∆ Level 2 — Piloted “Functional Excellence”: (approximately 25% of PSOs)at maturity level 2,
processes have started to become repeatable. Best practices may be demonstrated in discrete functional areas or geographies but they are not yet documented and codified for the entire organization. Basic processes have been established for the five Professional Services
Performance Pillars, but they are not yet universally embraced. Operational excellence and best practices may be discerned within functions but not across functions. By Level 2 individual Functional Excellence should have emerged in key areas.
∆ Level 3 — Deployed “Project Excellence”: (approximately 25% of PSOs)at maturity level 3, the PSO has created a set of standard processes and operating principles for all major service performance pillars but renegades and “hold-outs” may still exist. Management has established and started to enforce financial and quality objectives on a global basis. Processes have been established to focus on effective execution and there is spotlight on alignment between and across functions. By level 3 project delivery methodologies and quality measurements are in place and enforced across the organization. Level 3 organizations should exhibit “Project Excellence” with a consistent, repeatable project delivery methodology.
∆ Level 4 — Institutionalized “Portfolio Excellence”: (approximately 15% of PSOs)at maturity level 4, management uses precise measurements, metrics and controls, to effectively manage the PSO. Each service performance pillar contains a detailed set of operating principles, tools and measurements. Organizations at this level set quantitative and qualitative goals for customer acquisition, retention and penetration, in addition to a complete set of financial and quality operating controls and measurements. Processes are aligned to achieve leverage. The portfolio is balanced with a focus on project selection and execution. Level 4 organizations should exhibit “Portfolio Excellence”.
∆ Level 5 — Optimized “Collaborative”: (approximately 5% of PSOs)at maturity level 5 executives focus on continual improvement of all elements of the five performance pillars. A disciplined, controlled process is in place to measure and optimize performance through both incremental and innovative technological improvements. Quantitative process-improvement objectives for the organization are established. They are continually revised to reflect changing business objectives, and used as criteria in managing process improvement. Initiatives are in place to ensure quality, cost control and client acquisition. The rough edges between disciplines, functions, and specialties have been smoothed to ensure unique problems can be addressed quickly without excessive bureaucracy or functional silos. Level 5 organizations are visionary and collaborative both internally and with clients and external business partners.
Over the past seven years, over 10,000 PSOs have studied the PS Maturity Model ™ and are using the concepts and key performance measurements to pinpoint their organization’s current maturity and develop improvement plans to advance lagging areas.
© 2014 Service Performance Insight http://www.microsoft.com/en-us/dynamics/service-industries.aspx 13 SPI Research summarizes individual PSO
performance in a SPIder chart (Figure 10). The maturity scorecard provides a measurement for each organization in comparison to the benchmark maturity definitions. It provides an invaluable tool to analyze current performance and prioritize future improvement initiatives.
This graphical depiction of the Service Performance Pillars™ by maturity level enables PS executives to quickly scorecard their organization’s performance, and diagnose areas of relative strength and
weakness.
Building the Professional Services
Maturity™
Model
With core benchmark information gleaned on all primary business functions, SPI Research was able to construct a Professional Services Maturity™ Model that determines organizational maturity — by pillar — and provides guidance to advance to the next level (Table 4).
Table 4: Performance Pillars Mapped Against Service Maturity
Level 1
Initiated Level 2 Piloted Deployed Level 3 Institutionalized Level 4 Optimized Level 5
Le ad er sh ip Initial strategy is to support product sales and provide reference customers while providing workarounds to complete immature products. Leaders are “doers”.
PS has become a profit center but is subordinate to product sales. Strategy is to drive customer adoption and references profitably. Leaders focus on P&L and client relationships.
PS is important revenue and margin source but channel conflict still exists. Services differentiate products. Leadership development plans are in place. Leaders have strong background & skills in all pillars.
Service leads products. PS is a vital part of the company. Solution selling is a way of life. PS is included in all strategy decisions. Succession plans are in place for critical leadership roles
PS is critical to the company. Service strategy is clear. Complimentary goals and measurements are in place for all functions. Leaders have global vision and continually focus on renewal & expansion.
C lie nt R el at io ns hi ps Opportunistic. No defined solution sets or Go to Market plan. Focus is on new customers and reference building. Individual heroics, no consistent sales, marketing or partnering plan or methodology. Ad hoc, one-off projects.
Start to use marketing to drive leads. Multiple sales models. Start investing in sales training, CRM & sales methodology. Start measuring sales effectiveness & client satisfaction. Start developing partners and partner programs. Some level of proposal reviews and pricing control.
Marketing, inside sales, solution sales with defined solution sets. CRM integrated with financials and PSA. Deal, pricing and contract reviews. Partner plan and scorecard. Tight pricing and contract mgmt. controls. High levels of customer satisfaction.
CRM, PSA, ERP integration provides 360 degree view of client relationships. Business process, vertical and horizontal solutions. Vertical client centers of excellence. Top client and partner programs. Global contract and pricing management. Key partner relationships. Strong customer reference programs. Executive relationships. Thought leadership. Brand building and awareness. High customer satisfaction. Integrated sales, marketing and partnering programs. High quality references.
Figure 10: Service Performance Pillar Maturity™
© 2014 Service Performance Insight http://www.microsoft.com/en-us/dynamics/service-industries.aspx 14 H um an C ap ita l A lig nm en t Hire as needed. Generalist skills. Chameleons, Jack of all Trades. Individual heroics. May perform presales as well as consulting delivery.
Begin forecasting workload. Start developing job and skill descriptions & compensation plans. Rudimentary career paths. Start measuring employee Satisfaction
Resource, skill and career management. Employee satisfaction surveys. Training plans. Goals and measurements aligned with
compensation. Attrition <15%
Business process and vertical skills in addition to technical and project skills. Career ladder and mentoring programs. Training investments to support career. Low attrition, high satisfaction
Continually staff and train to meet future needs. Highly skilled, motivated workforce. Outsource commodity skills or peak demand. Sophisticated variable on and off-shore workforce model. Se rv ic e Ex ec ut io n No scheduling. Reactive. Ad hoc. Heroic. Scheduling by spreadsheet. No consistent project delivery methods. No project quality controls or knowledge management. Skeleton methodology in place. Centralized resource mgmt. Initiating project mgmt. and technical skills. Starting to measure project satisfaction and harvest knowledge.
PSA deployed for resource and project management. Collaborative portal. Earned Value Analysis. Project dashboard. Global Project Management Office, project quality reviews and measurements. Effective change management.
Integrated project and resource management. Effective scheduling. Using portfolio management. Global PMO. Global project dashboard. Global Knowledge Management. Global resource management.
Integrated solutions. Continual checks and balances to assure superior utilization and bill rates. Complete visibility to global project quality. Multi-disciplinary resource management. Fi na nc e an d O pe ra tio ns
The PSO has been created but is not yet profitable. Rudimentary time & expense capture. Limited financial visibility and control. Unpredictable financial performance. Rudimentary contract management.
5 to 20% margin. PS becoming a profit center but still immature finance and operating processes. Investment in ERP and PSA to provide financial visibility. May not have real-time visibility or BI. Standard Library of Contracts and Statements of Work.
20 to 30% margin. PS operates as a tightly managed P&L. Standard methods for resource mgmt., time & expense mgmt., cost control & billing. In depth knowledge of all costs at the employee, sub-contractor & project level. Processes in place for contract management, legal and pricing decisions.
PS generates > 20% of overall company revenue & contributes > 30% margin. Well-developed finance and operations processes and controls. Systems have been implemented for CRM, PSA, ERP and BI. IT integration and real-time visibility. Systems have been implemented for contract management, legal and pricing decisions.
> 40% margin. Continuous improvement and enhancement. High profit. Integrated systems.
Global with disciplined process controls and optimization. Completely integrated financial, CRM, resource management, contracts and pricing systems, processes and controls. Source: Service Performance Insight, February 2014
Why Maturity Matters
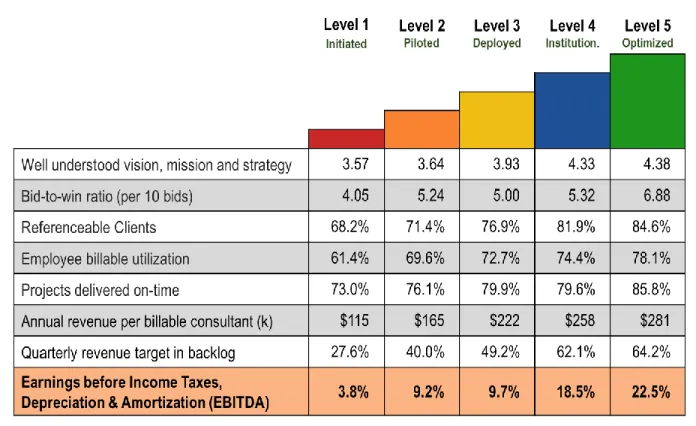
SPI Research believes wide support for the PS Maturity™ model is due to its holistic approach to measuring performance. Maturity is determined through alignment and focus both within and across functions. For example, although financial measurements are of primary importance they are equally weighted and correlated with leadership and sales and quality measurements to ensure organizations improve across all dimensions, not just in terms of financial performance. However, if the organization is profit-motivated (which most are), increasing maturity levels do show up in significant bottom-line profit. Figure 11 highlights major key performance measurements by maturity level, and should alone be an important reason why PS executives should look deeper into using it to increase profits.
© 2014 Service Performance Insight http://www.microsoft.com/en-us/dynamics/service-industries.aspx 15
Figure 11: Professional Services Maturity™ Progression
Source: Service Performance Insight, February 2014
Pillar Importance and Organizational Maturity
The results and insights gained in the past seven years have confirmed SPI Research’s original hypothesis that service organizations must develop a balanced and holistic approach to improving all aspects of their business as they mature. SPI Research has discovered that the emphasis on individual service pillar performance shifts as organizations mature. Excellence in only one particular service performance pillar does not create overall organizational success – rather it is the appropriate balance and alignment within and across performance pillars, which ultimately leads to sustainable success.
Table 5 depicts the relative service performance pillar importance by organizational maturity level. Many
professional service
organizations are established without a particular initial focus toward optimizing performance. They begin with the goal of establishing a client and reference base.
Table 5: Service Pillar Importance by Organizational Maturity Level
Pillar Initiated Piloted Deploy. Inst. Opt.
Leadership 1 2 3 4 4
Client Relationships 4 3 3 3 4
Human Capital Align. 1 2 3 4 4
Service Execution 1 3 3 4 4
Finance and Operations 1 1 3 4 4
© 2014 Service Performance Insight http://www.microsoft.com/en-us/dynamics/service-industries.aspx 16 They may be operated as a cost center or as an adjunct to the product function to establish alpha and beta customers and to provide early product feedback. Initially they often perform presales, training, quality assurance and service delivery tasks. They hope to deliver services that are both profitable to them as well as valued by their clients, but in reality, they take the position that “just about any deal is a good deal.” The emphasis at Level 1 maturity is on building client references and recruiting highly skilled generalist consultants who are experienced enough and flexible enough to perform heroic feats to ensure early customer success.
By Level 2, although primary focus is still on creating reference customers, more emphasis is placed on human capital alignment for recruiting and ramping skilled employees, partners and contractors. Service execution focus is on developing repeatable project delivery methods and quality processes. At these early stages, many embedded professional service organizations have a strong product-driven focus and the role of the service organization is subordinate to products. Conflicts between service profit, client success and driving product revenue are often characteristic of Level 2 embedded service organizations.
By Level 3 the organization must move toward a more balanced focus on all elements of the business by investing in systems, operating processes and
repeatable methods to sustain growth and ensure quality.
At Level 4 the organization has
implemented structured business processes and utilizes integrated information systems to assure there is “one view of the
business”.
Finally, at Level 5 the organization is running very efficiently and the focus is on continual improvement and innovation. Very few firms achieve sustained Level 5 performance.
Figure 12: PS Performance Pillars – Core KPIs
© 2014 Service Performance Insight http://www.microsoft.com/en-us/dynamics/service-industries.aspx 17
3.
SURVEY DEMOGRAPHICS
SPI Research surveyed 238 billable Professional Services Organizations (PSOs) from October through December, 2013. The following sections breakdown the 2013 survey demographics in a number of key areas (market, size, and geographic region) to help PS firms compare their individual results to the benchmark.
The Service Market is Huge and Growing
According to Gartner’s 2013 IT Spending report, IT and Telecom services represent almost 70 percent of all IT spending with vast global revenues in excess of $2.7 trillion. Although the pace of service revenue growth has slowed, unlike most other industries, year-over-year IT service revenue has only declined once in the past ten years (2008-2009).
“The global steady growth rates are a calm ocean that hides turbulent currents beneath,” writes John Lovelock, research vice president at Gartner. “The Nexus of Forces — social, mobile, cloud and
information — are reshaping spending patterns across all of the IT sectors that Gartner forecasts. Consumers and businesses will continue to purchase a mix of IT products and services; nothing is going away completely. However, the ratio of this mix is changing dramatically and there are clear winners and losers over the next three to five years, as we see more of a transition from PCs to mobile phones, from servers to storage, from licensed software to cloud, or the shift in voice and data connections from fixed
to mobile.”
According to Gartner, the worldwide IT services market will grow 4.4% in constant currency in 2013, reaching $921.7 billion, and will exceed $1.1 trillion by 2017. Outsourcing will contribute more than half of market growth (Table 6).
Table 6: The Service Market is Huge, and Growing
2013 Spending 2012/13 Growth 2014 Spending 2013/14 Growth 2015 Spending 2014/15 Growth Hardware $496.6 9.2% $540.5 8.8% $603.5 11.7% Software 308.4 7.1% 329.4 6.8% 350.9 6.5% IT Services 921.7 4.4% 960.8 4.2% 1004 4.5% Telecom Equipment 514.2 7.1% 543.4 5.7% 571.7 5.2% Telecom Services 1,803.7 3.1% 1,860.5 3.2% 1,913.9 2.9% All IT $4,044.6 4.9% $4,234.6 4.7% $4,444 4.9% Source: Gartner, 2013
© 2014 Service Performance Insight http://www.microsoft.com/en-us/dynamics/service-industries.aspx 18
Vertical PS Markets — the North American Industry Classification System
SPI Research uses the North American Industry Classification System (NAICS) to analyze the PS market. The following sections define the Professional Services markets (Code 54). The NAICS defines these industries as “those in this subsector engage in business processes where human capital is the major input. These establishments provide the knowledge and skills of their employees, often on an assignment basis, where an individual or team is responsible for the delivery of high value services to the client. The individual industries of this subsector are defined on the basis of the particular expertise and training of the services provider (Table 7). According to the US Census, professional, scientific, and technical services revenue for 2012 was $1.4 trillion, up 4.1 percent from 2011. Within the sector, the revenue for marketing and advertising firms for 2012 was $39.8 billion, up 12.4 percent from $35.4 billion in 2011. Marketing and advertising and management consulting are the hottest growth sectors within the PS industry with 10 year growth forecasted at 10% and 6.2% respectively.
Revenues from the US PS industry have grown 22% in the past five years. The U.S. professional services industry comprises ~ 770,000 firms and employs over 7.7 million people.