POLICY RESEARCH WORKING
PAPER
1682
Is
the
"Japan Problem" Real?
AcrisisinJapansflnancialsector that would shake up
world financial markets - the
How Problems in Japan's
so-called Japan problerr -- isF.naticial
Sector
Could
unlikely. But a limited crisisthat would necessitate
Affect Developing Regions
publicly funded bailouts ispossible. Early and
Shigeri ()tsuibo preemptive enactment of
Mlsahike Tstutsutni consensus-based rescue
measures wouli ensure
brighter prospects for dJeveloping economres
pursuing outward-oriented
reform.
The World Bank
International Economics Department
Public Disclosure Authorized
Public Disclosure Authorized
Public Disclosure Authorized
I(.Y REriAR(H WORKING PAPFR 1682
Summary findings
The burst of the lapanese financial bubble in the early against developing regions that export primary I 990s has increased the had debts of Japan's financial commodities. Worst hit would be highly indebted institutions. accots for about 20 prcent Iapan of primary commodity exporters. T'hose with
foreign aid to developing cointries and fot 10 percent of proportionately more yen-denominated debt stock would their exports, so Japan's econoiimic health is important suffer most as the yen appreciated.
for their prospects. Otstubo anid 'Isntsunoi analyze the * Many Asian exporters of low-cost manufactures to sitiation, asecss the badt cteh stock, and simulate the Japan may be relatively unaffected.
Iikely effecrs of crises in lapan's financial sctror. They T 'he simulation does not detect contagious effects in
conclude- tlhat: tile U.S. financial market.
* A irisis that would shiake Up the worldi financial * Damnage could be largely contained once the market Is Linlikely but Japanese auithoritics mnay have to monetary authority steps in to supply short-term restructure severely affected instittitions eveii without a liquidity. Small but persistent increases in tax collection crisis, which could increase fiscal spending or debt stock. from the household sector seem to be a reasonable
* Even with a limited Link- rtun, the household sector's OptioIn for financing the bailout.
lack of confidence in the finanecial sector woiuldl send the * Coping with such problems would leave the country into a recessionary spiral, rectuiriuig the Japanese economy in a less favorable position for Inonetdry arthorits to intervene with supplies of short- confronting the problems associated with an aging
teriii iiqfidit. population. And fiscal pressures may reduce Japanese aid
* A i,naniciail crisis in Japan would depress world ro low-income countries. tracde, raise interest rates, andl rLnr the terms of trade
his paper -- a product of thc In.ernational Economic Analysis and Prospects Division, International Economics Dcpart'Ieni -Is part of a larger effort in the departmcnt to examine chatigitig external links and the impact of external shocks on low and middle-incorme countTies. Copies of the- paper are available free from the World Bank, 1818 H Street NW, Washingtonr, I)C. 204 13. Plt ase contaict lacquielyn Queen, room N4-1 00, telephone 202-47.3-3740, fax 202-522-2 A78, Interner address jqueen(to worldbLink.org. November 1996. (5] pages)
Vr
,,
'o,h, -
Res rLr W;orking 1 i,p- S'rils disseminates the findings of wuork in progress to encourage the exchange of ideas about declopmernt issues. A *je- tie of/the sf rie s 1to get the findings out qickly, even ifthe presentations are less than fully polished. The pp, rs t),-ry ile na.i;es (of th,' ii t(hors ,n! d .,ho(ilild be used an. cited accordingly. The findings, interpretations, and conclusions are theIs the "Japan Problem" Real?
How Problems in Japan's Financial Sector
Could Affect Developing Regions
Shigeru Otsubo Masahiko Tsutsumi
By Shigeru Otsubo and Masahiko
Tsutsumi-Japan accounts for about 20 percent of foreign aid to developing countries and for 10 percent of their exports, and its economic health is therefore important to developing regions. 7he decline in asset prices in Japan since 1991 has contributed to an increase in bad debts of the country's financial institutions, has slowed credit extension through the erosion of their capital base, and has been an important factor in the long recession. Although the possibility of a systemic financial sector crisis that will shake up world financial market - the so-called 'Japan Problem' - is unlikely, the authorities may have to restructure severely affected institutions, which could result in higher fiscal expenditures or debt stock, a less favorable starting point from which to confront the problems associated with population aging. The impacts of such a restructuring on developing countries are likely to be most serious for indebted primary commodity exporters. Low-income countries are likely to be affected by fiscal pressures on Japanese foreign aid. On the other hand, many Asian exporters of low-cost manufactures to Japan may be relatively unaffected.
l. Introduction - Background and Issues
Japan's business cycle downtum, which started in 1991 with a burst in the asset price bubble, produced one of the longest recessions in its post-war history before it showed signs of recovery toward the end of 1993 (see Figure 1).' The recovery, although weak, lasted for more than a year before coming to a virtual standstill toward the end of the second quarter of 1995, when there were signs of renewed recession with mounting risks of deflationary process (see Figure 2). The deepening problems within Japan's financial sector and the strengthening of the yen in the first half of 1995 were the main factors that diminished hopes for recovery. Most alarming is the fact that a recovery in the employment situation has never been observed; in fact, as Japan's Economic Planning Agency (EPA) has stated, it remained severe and continued to deteriorate during the recent gradual recovery (see Figure 2).
Shigeru Otsubo is an Economist with the International Economics Department, the World Bank. Masahiko Tsutsumi is an Economist with the Economic Planning Agency of the Japanese government. Analyses provided here were based on data available at the end of 1995. The findings, interpretations, and conclusions are the authors' own and should not be attributed to the World Bank or the Economic Planning Agency. Research assistance by Yoshiaki Igarashi and Tetsuo Umemura is gratefully acknowledged. Editorial assistance was provided by Deborah Davis and Sarah Crow.
' According to the Economic Planning Agency's reference dates of business cycles, the bubble cycle had a 53-month expansion phase (from November 1986 to April 1991), followed by a contraction phase spanning 30 months (from April 1991 to October 1993). The average duration of Japan's post-war business cycle expansion has been 33.5 months, while contractions have averaged 16.9 months.
The build-up of deflationary pressures in Japan has also been aggravated by continued declines in asset prices and deterioration in personal, corporate, and financial sector balance sheets. From their peaks in 1991, the price of commercial land has fallen by 85 percent and the price of urban residential land has fallen by a third, gathering downward momentum. The aggregate net worth of all households has shrunk by a third since 1991, dampening consumer spending. By mid 1995, accumulated bad debts on bank balance sheets were an estimated 42 trillion yen ($420 billion), roughly equal to 9 percent of Japan's GDP. Partly as a result of the banking sector's deteriorating capital base, domestic credit extended by banks has been stagnant for more than two years, and consumer and business confidence has fallen due to the record 3 percent unemployment and weak wage growth. The relative concentration of bad debts in smaller financial institutions such as regional banks, credit unions, and mortgage institutions has increased their exposure to bank runs, such as those that occurred in several institutions in the Tokyo-Kansai area in the second half of 1995. These runs raised the specter of a systemic financial sector crisis that could shake up world financial markets - the so-called "Japan Problem."
Given these rather new phenomena in Japan's post-war economic history, analyses are needed to identify the sources and effects of this prolonged recession. Problems in the financial sector that have been a drag on the Japanese economy need to be closely studied. Negative spillover effects are matters of great concern in the world economy, and particularly in developing regions. Since Japan accounts for about 20 percent of foreign aid to developing countries and for 10 percent of their exports, its economic health is important for the developing world. This paper analyzes the continuing impacts of these issues on developing countries.
In the next section, the paper illustrates the mechanics behind the creation and bursting of the financial bubble. It then discusses the multiple causes of the subsequent prolonged recession. In Section III, the paper analyses the problems in Japan's financial sector and their negative impacts on its economy. It also discusses the risks of the financial institutions failing to meet BIS capital adequacy ratios, and briefly describes the policy measures taken up to the latter half of 1995. Section
W discusses the plausibility of the "Japan Problem." Section V speculates on what form a public bailout would be likely to take in Japan in the event of a financial sector crisis, in comparison to the recent financial sector crises in the U.S. and Europe. Section VI presents some indicative results from model-based simulations to investigate the possible ripple effects on the rest of the world economy in the wake of a financial crisis. The final section summarizes the findings and implications of the paper.
II. Bubble Burst and Compound Recession A. Creation of the Bubble
As Japan recovered from the short "yen-daka" (yen's appreciation) recession of 1985-86, which was triggered by the Plaza Accord, asset prices had an explosive increase (see Figures 3 and 4). The recovery and subsequent expansion from 1986 to 1991 was characterized by several factors that were conducive to the creation of a bubble: (i) fiscal stimuli mobilized in order to expand domestic absorption; (ii) a policy of low interest rates to stimulate private investment; (iii) windfall
profits due to lower import costs that, in turn, were caused by a rapid appreciation of yen after the Plaza Accord; and (iv) lower oil prices in the international markets.2 With these four supportive elements, the Japanese economy expanded during this period at an average rate of 5 percent a year. This period was also characterized by a strong growth in plant and equipment investment. With the fear of a rapidly shrinking pool of domestic labor due to the much-publicized aging of the population, the expansion soon hit a resource shortage, manifested in low unemployment and an extraordinarily active recruitrnent of new college graduates. However, the economic overheating, which normally results in visible wage increases and inflation in goods and service prices, instead produced an explosive increase in the prices of stock assets.
An economic theory that prescribes the normal relationship between investments and asset prices (equity prices) gives us a useful guide for viewing asset prices as business cycle indicators. That is, if a market is efficient, the equity price should precisely reflect future earnings created by corporate investments. A deviation in asset price from an investment earning ratio - Tobin's q (average q) - is considered a noise that, in turn, results from market inefficiency and/or expectation (bubble) elements. Ogawa (1994a), after analyzing this relationship by measuring movements in average q and marginal q during this bubble period, found that there was significant noise during the period and that it was related to the values of land assets owned by corporate sectors.
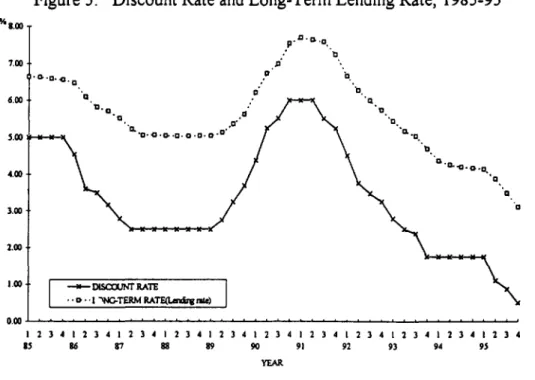
The movements in asset prices during this period had two components: one reflected an improvement in economic fundamentals, and the other represented the bubble elements. Improvements in economic fundamentals were particularly visible in a rapid expansion in corporate profits (fundamental to equity prices) and in demand for office space in major cities -Tokyo, in particular (fundamental to land prices). These key improvements in fundamentals were, in turn, supported by low interest rates and strong growth in money stock (see Figures 5 and 6). The discount rate was lowered from 5 percent in January 1986 to 2.5 percent in February 1987, and was kept at this low level until May 1989. The bubble elements were formed by rising asset prices, which, in turn, drew speculative investments in equities and land purchases in search of capital gains. Capital gains on equity/land reached about 490 trillion yen, worth over 140 percent of GNP in 1987 (see Table 1). During the four years from 1986 to 1989, capital gains on land and stock assets surpassed gross domestic output produced during the same period by more than 17 percent! Low interest rates and abundant liquidity worked as leverage to expand speculative investments in stock assets. This speculative money game permeated all private economic agents in the financial, nonfinancial corporate, and household sectors. Throughout this period, financial institutions increased their asset holdings in equities and land through direct investments and loans to real estate developers. In 1987, the growth of loans to real estate developers was twice as high as that of total loans.3 Since Japan's financial institutions use land as collateral for their loans, the rising land values provided a push to create credit through both demand and supply-side factors. BIS regulations, by allowing financial institutions to count 45 percent of their unrealized gains as capital base, relieved ceilings for loan creation. As a result, bank loans continued to grow at around 12
2 During 1985, the ratio of the value of fuel imports to nominal GNP fell by about 3 percentage points.
3 For a more detailed account of this issue, see Research Bureau, Economic Planning Agency, State of the
percent year during this period (see Figure 6), twice as fast as the growth in nominal GDP (6 percent a year) during the same period.
B. Bursting of the Bubble
The end of the bubble was triggered by changes in interest rates and subsequent liquidity control (see Figures 5 and 6). The discount rate was raised in May 1989 the first time in 9 years -to 3.25 percent in an effort -to stem inflationary pressures caused by the overheating of economic
activities. In March 1990 it was raised again, to 5.25 percent - the level prevailing before the Plaza accord. This high rate was effective in slowing down both real investment and investment in stock assets.
With the introduction of quantity restrictions on bank lending to the real estate sector in 1990, the market was convinced that the liquidity squeeze had been devised not merely as a counter-cyclical measure but also as a counter-bubble measure. This, in turn, led to a reversal in expectations for asset price movements. The BIS regulation on owned capital also worked negatively in this phase by restricting bank lending. During the expansion phase, the part of the BIS regulation that governs Tier 2 of own funds helped accelerate bank lending through a revaluation of supplementary capital due to increasing latent gains of listed securities. In a symmetrical manner, the regulation worked to discourage bank lending during the collapse in equity prices. The corporate sector, which largely lost direct financing from the capital market, was also deprived of indirect financing through the banking sector due to the credit crunch aggravated by this BIS regulation.4
A rapid reduction in speculative investments softened both demand and asset prices, thus creating a downward spiral. Capital loss amounted to about 200 trillion yen (42 percent of GDP) in 1991, and more than 400 trillion yen (87 percent of GDP) in 1992 (see Table 1 and Figure 7) After the bubble burst, the rate of decline in asset prices from April 1991 to October 1993 was much larger (a decline of 53.6 percent in stock prices, 27.5 percent in land prices) than the decline had been from November 1973 to March 1975 (a decline of 30.9 percent in stock prices, 6.8 percent in land prices), during the severe stagnation after the first oil crisis (see Table 2). That is, the self-inflicted bubble burst in the early 1990s created a larger collapse in the domestic asset markets than had been caused by a major external aggregate supply shock almost two decades earlier. Such capital losses in the 1990s negatively affected output growth by dampening business investments and consumer spending.'
4 Sawabe (1994) noted the destabilizing aspects of this BIS regulation.
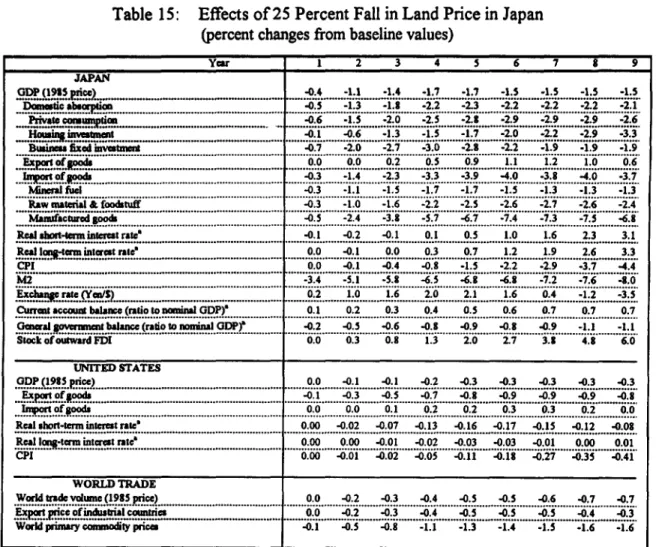
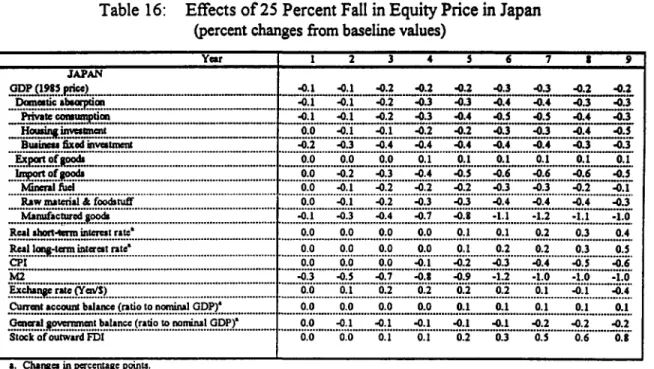
5 Model-based simulations presented in Section VI show that, other things being equal, a 25 percent decline in stock price will reduce Japan's GDP by 0.05 prcent in the first year in real terms and 0.16 percent by the third year (in levels). A 25 percent decline in land prices is estimated to reduce Japan's real GDP by 0.4 percent in the first year, and 1.4 percent by the third year.
C. Compound andProlongedRecession
The seemingly normal business cycle recession that began in April 1991 was deepened and lengthened by compounding structural and external factors. Monetary and fiscal tightening in 1989 initially led to a normal slowdown in credit creation and business investment (see Figures 6 and 8). However, equity prices started to drop drastically in 1990 and land prices started to drop in 1991, following the introduction of quantity restrictions on bank loans to the real estate sector in 1990 (see Figures 3 and 4). This bubble burst aggravated the cycle downturn. As capital loss permeated all private sectors, consumer confidence and spending, business confidence and new investments, and the financial sector's lending activities slowed rapidly.
The rapid appreciation of the yen during the first 8 months of 1993 lengthened the business cycle downturn (see Figure 9). During this period, the yen appreciated by more than 20 percent against the dollar (125.1 to 103.7 yen/$), or by about 25 percent in real effective terms. Thus, there was no opportunity for the "export drive" to which Japan has traditionally resorted in times of recession. Rather, with a rise in consumer awareness in response to less expensive imported goods, import penetration has continued to rise, nearing a historically high level of 12 percent (in relation to GDP in real terms) at the end of 1995, and thus creating a continuous leak of recovery to the rest of the world (see Figure 10).7 Unlike the yen's appreciation after the Plaza Accord, which triggered a recession - the yen had appreciated by 35 percent against the dollar and by 23 percent in effective terms during the 8-month period September 1985 to April 1986 - this round of appreciation came after two years of recessionary process, when sales and corporate profits fell substantially. Thus there were significant negative effects on the confidence of the corporate sector.
The burst in asset prices, strengthening yen, and higher penetration of imported goods gave rise to the process of disinflation (see Figure 2). This tumed out to be another factor in the prolonged recession through a visible squeeze in corporate profits. A collapse in asset prices and the subsequent recession had widened the output gap by dampening domestic demand (a downward shift of the aggregate demand curve), thus exerting deflationary pressure. However, more importantly, the current disinflation has also been caused by supply factors (a downward shift of the aggregate supply curve). Those factors include advances in deregulation, particularly in the distribution sector; a rapid rise in import penetration that has paralleled the rise observed in the United States in the 1980s; and a rise in consumers' price awareness, which has increased the price elasticity of their demand for both domestically produced goods and imports. Although the supply-side factors for disinflation should benefit the economy in the long run, it has lengthened the recession by reducing corporate profits and
6 The U.S. Federal Reserve Board guided interest rates lower during this period and produced economic expansion driven mainly by private investment. The growth driven by investment was conducive to productivity growth, which, coupled with gradual depreciation in its effective exchange rate, expanded U.S. exports. Thanks to the depreciation of their currency in relation to Japanese yen, East Asian manufacturing exporters gained more than 2 percentage points in their market share in the U.S. import market, displacing Japanese exports.
' For a more detailed account of this issue of market opening, see Shigeru Otsubo, "Prospects for Japan's
Trade - Market Opening?" Appendix B in "Globalization: A New Role for Developing Countries in an Integrating World," Policy Research Working Paper No. 1628, World Bank (July 1996).
employment activities. The current business cycle pattern is forcing structural adjustments in the corporate sector during the prolonged cycle downturn. In the recessions of the 1970s and 1980s, the downturn lasted for only 16-17 months (16 months after the first oil crisis, 17 months after the Plaza Accord), and the structural adjustments could be made against the backbone of an expanding economy. This time, however, the larger-scale corporate restructuring necessitated by the recession has resulted in explicit unpaid unemployment (see Figure 2), and thus has undermined consumer confidence.
The combination of these structural factors has produced a pattern of stagnant income generation in the midst of a recovery in industrial production, thus making the current round of recovery, which started in late 1993, very fragile (see Figure 1). Another occurrence in the yen's rapid appreciation was observed during the first 6 months of 1995, hindering the continuation of the fragile recovery (see Figure 9). Between December 1994 and June 1995, the yen had appreciated by 24 percent against the U.S. dollar. With the emergence of financial sector problems in 1995, the Japanese economy headed towards the second dip.
III. Financial Sector Problems and Their Negative Impacts on the Economy A. The Increasing Size of Nonperforming Loans
With the collapse in land and stock prices, Japan's deposit-taking financial institutions had amassed bad debts of about 40 trillion yen ($400 billion) by mid 1995, according to an official estimate. Since the definition of bad debt varies across countries, however, the reported amount of total nonperforming loans should be treated with caution. For exarnple, the amount of nonperforming loans reported by the Mitsubishi Bank and the Bank of Tokyo to the U.S. authority, based on the
U.S. standard, was about 2.5 times larger than that reported in Japan.8 Since these two banks held a
much smaller stock of bad debts than city and regional banks, the official estimates of total bad loans should be considered a lower bound.
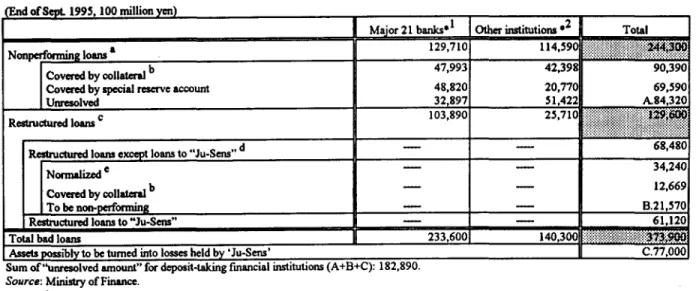
Tables 3 and 4 summarize figures on bad loans held by deposit-taking financial institutions in Japan, as reported by the Ministry of Finance. At the end of September 1995, the total amount of
all reported bad loans was 37.39 trillion yen.9 The bad loans were of two types: nonperforming
loans and restructured loans. The nonperforming loans, which accounted for about two thirds of total bad debts, were loans to borrowers in legal bankruptcy or loans that were past due. Restructured loans were those for which interest had been reduced to the level of an official discount rate. Table 5
8 In Japan, banks include only subsidiaries with more than 50 percent stock holding and related companies
with 20 to 50 percent stock holdings in their consolidated accounts for disclosure of their balance sheets. This excludes the coverage of nonbank financial institutions mobilized by banks during the bubble period.
The U.S. Securities and Exchange Commision (UJSSEC), on the other hand, requires coverage for these
"other related agents" in reporting the consolidated settlement of accounts. Mitsubishi Bank and the Bank of Tokyo merged in spring 1996 to form Tokyo Mitsubishi Bank.
9 This figure does not include the bad debts held by financial institutions that had already gone bankrupt, such as Cosmo Credit Union, Hyogo Bank, and Kizu Credit Union.
tabulates the amounts of restructured loans by different groups of financial institutions and their ratios to total loans extended, estimated at the end of September 1995. Among 21 major banks in Japan, trust banks as a whole exhibited a very high restructured loans/total loans ratio of 5.7 percent, compared to 1.8 percent among city banks and 3.4 percent among long-term credit banks. Because trust banks are closely associated with land developers, there is a risk that these restructured loans could eventually turn into nonperforming loans.
However, the entire stock of reported nonperforming loans will not necessarily become a loss to financial institutions. Based on the figures shown in Table 3, some part of the bad loans have already been covered by collateral or another institutional instrument designed to pay off the loss. For the stock of nonperforming loans, it is reported that about 37 percent of the total amount is
covered by collateral. Special loan-loss reserve accounts cover another 28 percent.10 As a result,
unresolved loss is estimated at around 8.4 trillion yen, only one third of the 24.4 trillion yen of nonperforming loans reported by deposit-taking financial institutions. As to the stock of restructured loans, except for those made to "Ju-Sens" (housing loan companies), half the amount (3.4 trillion yen) is expected to be normalized, and 37 percent has been covered by collateral. The potential loss is therefore projected at around 2.1 trillion yen. Estimating the potential loss in loans made to Ju-Sens is not straightforward. However, in the event that all the bad loans made by Ju-Sens are attributed directly to parent banks as loan losses, they would amount to about 7.7 trillion yen. The total amount of noncovered bad loans that have to be dealt with by deposit-taking financial institutions can be
estimated at 18.3 trillion yen (US $183 billion at 100 yen/$).
In Figure 11, the size of bad loans is portrayed by type of bank against its collateral, loan-loss reserve, and latent gains of listed securities. As the figure shows, small deposit-taking institutions as a group had already faced the risk of capital inadequacy at the end of September 1995, with about 1.58 trillion yen worth of their bad debts not covered by collateral, reserves, or latent gains of their security holdings. The situation among smaller financial institutions is therefore much worse than that of larger banks, and it will likely take them much longer to restore their financial stability, if it can be done at all without a crisis. Even the major 21 banks are on shaky ground, since their latent gains of listed securities are subject to wide variations depending on the performance of the stock market. In addition, land - most of which is still falling in value - is a predominant
component of the collateral for these bank loans.
Many private researchers regard the official estimates of bad loans as extremely low, since they believe that these debts have been largely underreported. Private estimates of bad debts range
from 50 trillion yen ($500 billion) to 100 trillion yen ($1 trillion).
Nonetheless, it would be reasonable to say that 30 to 40 percent of total bad loans had already been covered by mid 1995 with accelerated transfers to loan-loss reserves and by liquidation through the Cooperative Credit Purchasing Corporation Ltd (CCPC). And banks' operating profits
10 Coverage rates of bad loans are estimated by a Ministry of Finance survey of all banks in Japan
and by the price of the credits purchased by Cooperative Credit Purchasing Corporation Ltd. (Saiken Kaitori
Kiko). At the end of March 1995, the average ratio of covered bad loans to total bad debts was about 40 percent in both estimates. In September, the coverage rate estimated by the same methods declined to 37 percent, due mainly to a decline in land prices in city areas.
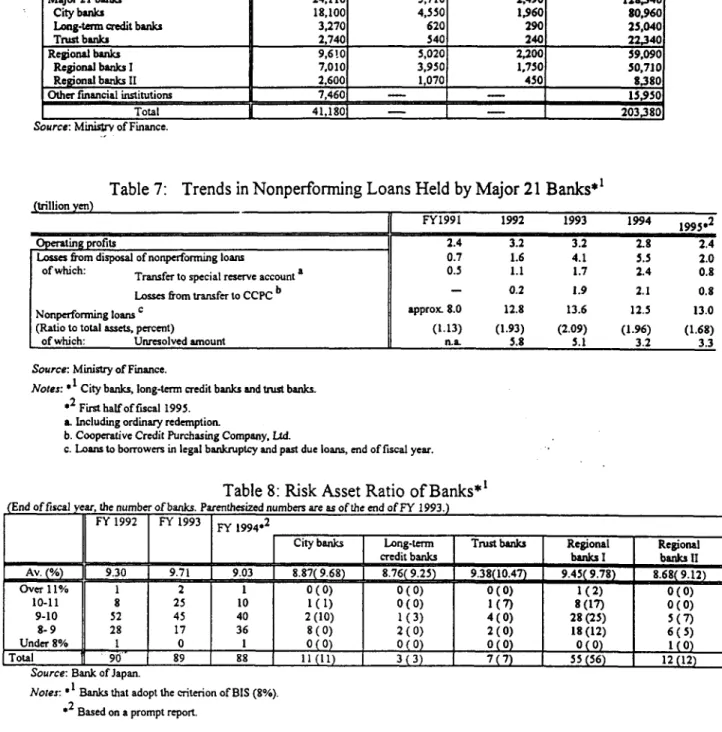
have begun to improve due to the widening interest spread created by a series of cuts in policy rates (see Figure 12, Table 6, and the first row in Table 7). The stock market has also largely recovered from the depressed level at the end of March 1995, adding to a recovery in latent gains of listed securities. However, it is still too early at this point to judge whether or not the stock of bad debt is going to be paid off smoothly. As Table 7 shows, even if the arguments are confined to the better-positioned 21 major banks, the ratios of nonperfomrning loans and of unresolved amounts to total assets have not yet declined sufficiently, although the banks have been actively writing off bad loans using loan-loss reserves and CCPC. These 21 major banks also hold a sizable amount of restructured loans, as shown in Tables 3 and 4, which could turn into nonperforming loans at any moment. The aggregate ratio of restructured loans to total assets was estimated at 2.66 percent at the end of September 1995. Among the group of trust banks, the ratio of restructured loans to total assets was estirnated at over 5 percent.
B. Risks of Failing BIS CapitalAdequacy Criteria
It is imperative for banks to clear the BIS risk-asset ratio (8 percent) to remain operative in financial markets. As Table 8 shows, all but one of 88 Japan's deposit-taking financial institutions reportedly met this BIS regulation in March 1995. However, shrinking latent gains reduced the computed owned capital base, and thus reduced the group's risk assets/owned capital ratio by 0.68 percentage points, down to 9.03 percent from 9.71 percent at the end of fiscal year 1993. During the same period, long-term and regional banks, as groups, have observed declines in their risklasset ratios of 0.3 to 0.5 percentage points. City and trust banks, as groups, saw declines of 0.81 and 1.09 percentage points, respectively.
Murashima (1995) has estimated capital adequacy for the major 21 Japanese banks. Table 9 reproduces his estimation of capital adequacy for long-termn, city, and trust banks. Estimation of capital adequacy was made by the following procedures:
1) Add up the total amount of nonperforming loans made by the 21 major banks, as reported by the Ministry of Finance: the nonperforming loans made to Ju-Sen, to nonbanks related to Hyogo bank, to Nichiboushin bank, and to nonbanks related to three Kansai-area regional banks (Fuku-toku, Han-wa, Osaka).
2) Calculate losses from loans made to various institutions by applying the following arbitrary loan-loss ratios to the stock of nonperforming loans and utilizing other adjustrnent methods: 80 percent for reported debt (80 percent of reported nonperforming loan is computed as a loss); 80 percent for nonperforming loans made to Hyogo bank using lenders' responsibility method; 54 percent for nonperforming loans made to Nichiboushin using lenders' responsibility method; and 60 percent of nonperforming loans to Kan-sai regional banks using adjusted founders' responsibility method. For loans made to Ju-Sens, the semi-complete founders' responsibility method is utilized, based on Ministry of Finance research.1'
" In the founders' responsibility method: initial founding investors of the mortgage company are held
accountable for debts at insolvency. In the adjusted founders' method: initial investors grant all the loans to the mortgage company and other lenders are held responsible for losses, depending on the amount of loans.
3) Latent gains of listed securities are assumed to be used initially to deal with noncovered losses. 4) The rest of the uncovered loss is assumed to be paid off by the capital account.
5) The owned capital ratio is computed with adjusted Tier I (core) capital and Tier II (supplementary) capital, observing the rule that the total amount of Tier II capital cannot exceed that of Tier I capital.
6) Stock prices at the end of March 1995 are used to derive latent gains of listed securities.
The projected reductions in capital adequacy ratios after the banks make lump sum write-offs of bad loans are presented in the last two columns in Table 9. The simulated worsening in risk assets/own capital ratios are so substantial under this scenario that none of the three types of major bank groups (in aggregates) could satisfy the BIS capital adequacy criteria after the lump sum write-off. Long-term and trust banks would also be required to augment their core capital (common or preferred stock), with the expected erosion in their Tier I capital after the write-off If they fail to meet the BIS capital adequacy criteria, these types of Japanese banks have to face the risk of extinction - stopping their worldwide financial business operations - and thus are most likely to transmit negative impacts throughout the world financial markets.
Murashima (1995) also estimated the capacity of these banks to issue preferred stock in order to restore capital adequacy, assuming that the total issue of preferred stock is bound by the legal limit (one third of the total stock issue) and that the issue price is set at 80 percent of the prevailing price of relevant common stocks.12 Table 10 reports these estimates for three groups of
banks: long-term, city, and trust banks. The last column in Table 10 shows the amount of raised capital under this scenario as the ratio to risk assets for each type of bank. Technically speaking, therefore, it is possible to restore capital adequacy by issuing preferred stock. However, it is not
clear whether the capital market is able to absorb such numerous new issues. There also is a risk that new issues could further erode latent gains in the existing stocks. For public funds to be utilized in purchasing these new issues, a tough process of consensus building will be required. There would also be numerous obstacles to be cleared, such as registration procedures and imposition of budget restructuring on the part of issuing bodies.
It is rather ridiculous to argue who shares the loss and in what proportion because a mortgage company is one of the legally established stock companies and, therefore, it should be owned only by shareholders. Distorting the solution by means of administrative guidances should by no means be permitted.
12 A commercial low limits the number of issued preferred stocks to one third of total stock in circulation.
Issuance of preferred stock is a strong option for building core capital, since it would be difficult, with a deteriorating balance sheet, to issue common stock at prevailing prices.
C. Policy Measures To Date and Mounting Negative Economic Effects of Nonperforming Loans
To deal with the economic stagnation and mounting financial sector problems, Japan's authorities initially tried to stimulate the effective demand by traditional fiscal and monetary policy measures to lighten the burden of bad debt - a balance sheet adjustment through economic expansion. Monetary policy initiatives to guide the interest rates lower during this period, although introduced only after substantial delays, can be characterized by an outward shift in the credit supply curve in
the domestic credit market, as portrayed in Figure 13 by the shift in supply curve from S to S2. The
performance of Japan's economy from 1992 to 1994, however, was so disappointing that the initial
set of policies had no visible effect on the deepening problems. 13
The authorities, then, sought to accelerate the process of financial institutions writing off nonperforming loans by widening the interest spread - thereby creating a profit margin for lending
operations - and by assets operations by the official funds in support of equity prices. 14 A wider
spread helped the banking sector to write off bad debts out of increased operating profits. From a macro point of view, however, the credit crunch continued. Figure 13 describes the mechanism of the ongoing credit crunch. The deposit interest rate, which represents the cost of funding for the banking sector, is assumed to move in parallel with the lending rate. In a recessionary environment with a decline in confidence among the corporate sector, the demand for loans is weakened at any given interest rate, thereby causing an inward shift of the credit demand curve, such as a shift from D to DI Thus the equilibrium moves from point A to point B, with a lower level of credit extension and lending rates. In order for the financial institutions to accelerate write-offs of their nonperforning loans in the midst of a recession, the interest spread in their lending operations can be increased. As a result, the supply function shifts inward from S to Si, taking the credit market further down to a reduced equilibrium (a move from point B to point C). This inward shift of the credit supply curve is a phenomenon of a narrowly defined credit crunch.
Even if the increased spread persists and banks continue to pay off bad loans at the rate prevailing in mid 1995, financial institutions may not be able to wipe out a majority of bad debts before the turn of the century. The recent downgrading of Japanese financial institutions will inevitably raise their funding cQsts, and thus narrow spreads. The growth in loans and discounts extended by the banking sector have been stagnant throughout 1995. This translates into a year-on-year growth of less than I percent, thus dragging the growth of money stock, which has been increasing at the sluggish rate of not more than 3 percent a year (see Figure 6). Thus, the financial sector has hardly been playing its core role of financial intermediation for credit creation in the past
couple of years.'5 This, in turn, has been hampering a (strong) resumption of consumption and
13 The compound causes of the slow recovery after the bubble burst were analyzed in the preceding
sections. For more details, see Economic Survey of Japan 1995.
14 Effects of assets operations by the official funds in support of equity prices on the macroeconomy will be
discussed in Section VI.
investment expenditures, thus causing a downward kink (or shift) in the path of capital accumulation, which inevitably has serious negative long-term implications. 16
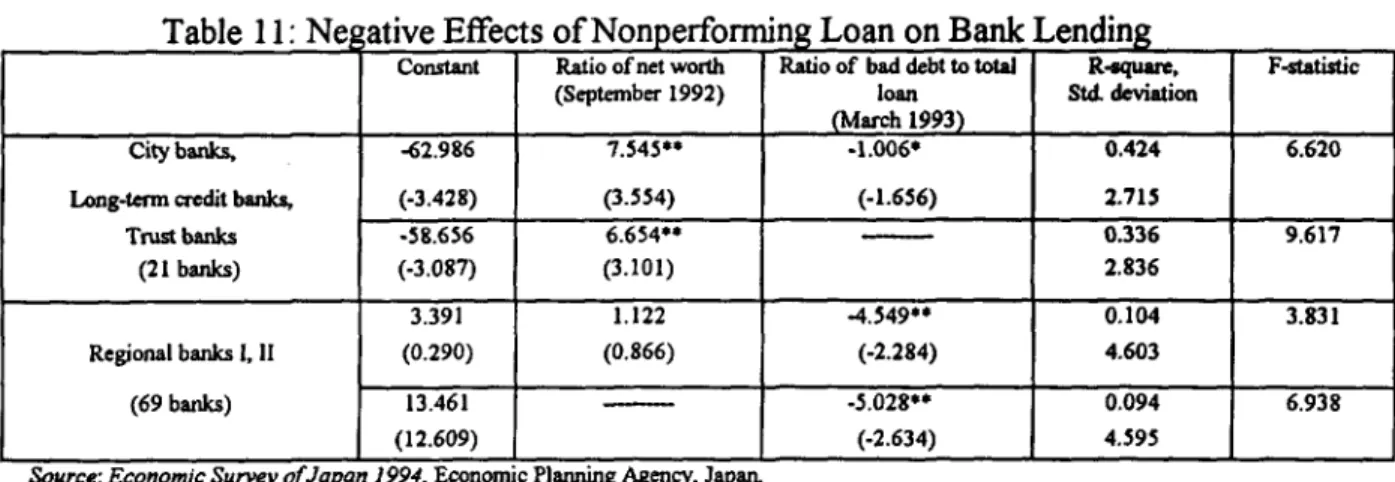
A set of indicative regression analyses was conducted to investigate the extent of the negative effects of the stock of nonperforming loans on new credit creation by the banking sector - its central role as a financial intermediary. The results of these analyses, tabulated in Table 11, show that the ratio of bad debt to total credit extended had a negative correlation with the bank's lending activities. Judging from the size of the estimated coefficients and their statistical significance attached to this factor in lending operations, the dampening effects of the bad debts on new lending activities seem to have been much larger in smaller financial institutions (regional banks) than in the 21 major institutions with larger net worth (city banks, long-term credit banks, and trust banks). Thus, the disappointingly low growth in banks' credit creation and the high lending rates seem to have their roots in the mounting bad loans.
An interest rate is thought to have two functions in the market economy. An interest rate in real terms directs an inter-temporal (vertical) resource allocation - i.e., a time preference. An interest rate in nominal terms guides liquidity preference, a horizontal resource allocation. Although the Bank of Japan continued to supply enough high-powered money to satisfy liquidity needs in the economy (the second function), the real interest rate did not decline enough to move the capital/earning ratio to stimulate current investment expenditures (the first function). A quasi-liquidity trap may have happened during this period due to ongoing stock adjustments, delays in interest rate cuts, and disinflationary pressure caused largely by international trade, as analyzed in a previous section.
The negative effects of widened interest spread were simulated in an report by Japan's Economic Planning Agency (EPA). Assuming that a long-term interest rate relevant for consumption, housing investment, and plant/equipment investment decisions rises in line with the postulated increase in the banks' lending rate, it was shown that an increase in spread of 0.5 percentage point lowered real GDP by 0.14 percent compared to the base case in the first year and by 0.41 percent by the third year. 7
16 Not only a credit crunch, but also a distortion in income distribution might have occurred under such a situation. Assuming that there are three agents in the economy - household, financial institutions, and nonfinancial enterprises - a decline in the deposit rate means an income transfer from household to financial institutions and to nonfinancial enterprises. Additionally, assuming that a loan rate does not decline as much as a deposit rate (thus increasing the lending spread), the transfer from households (saving agent) to nonfinancial enterprises (investment agent) will disappear or be significantly reduced, manifested as a social loss, in the process of financial intermediation.
17 See Economic Planning Agency, State of Japanese Economy-Review and Issues of Japanese Economy in 1995, December 1995.
IV. Is the "Japan Problem" Real? - Risk of a Systemic Financial Crisis
An ailing financial sector not only exerts a dampening effect on Japan's economic activities through supply side of credit creation, but also gives rise to the risk of a systemic financial crisis. The relative concentration of bad debts in smaller financial institutions such as credit unions and regional banks gives rise to a systemic risk of bank runs. The run that occurred in July 1995 at Cosmo Credit Union (the largest credit union in Tokyo), and the subsequent failure of Kizu Credit Union in Osaka and another failure in the Kansai area have already depleted a meager deposit insurance fund (see Table 12), with the authorities having had to step in and guarantee the deposits of investors in these institutions. In addition, many Ju-Sens are reported to be in deep trouble given their link to only land and property assets.
The "Japan Problem," as defined in the media, foresees a systemic financial sector crisis triggered by collapse of a number of financial institutions, which in turn will be caused by the lack of explicit policies to rescue banks from bad debts. In Japan, this anticipated crisis is expected to deepen and lengthen the recession. Stock and property prices will further tumble because equities of financial institutions will be heavily sold, and some of these institutions will be forced to liquidate their equity and land holdings. Financial institutions will become extremely cautious about new lending and the process of credit creation will further stagnate. This, in tum, will dampen investment and consumption activities. In the United States, economic activities will also face dampening pressure as Japanese financial institutions sell off their bonds and securities. Stock prices will fall and long-term interest rates will rise. Furthermore, with the deepening recession in Japan, the demand for U.S. exports will tumble. Finally, a concurrent recession in Japan and the United States (or weakened growth of the U.S. economy) and turmoil in the financial sector will spread to other parts of the
world.'8
The relevant question is, therefore, whether the "Japan Problem" is real. The consensus is that "Japan Problem" represents only a worstcase scenario and not the most likely scenario -among possible outcomes. City banks reported the highest operating profits in many years for the period April-September 1995 (thanks to a widening spread), and have been aggressively writing off bad loans. The size of bad debts limited to city banks - banks that have access to foreign exchange and possess foreign assets - is reported at about 23 trillion yen ($230 billion). This is not an explosive amount, and the city banks could manage it without causing a panic. Institutional investors
such as life insurance companies continue to invest abroad, albeit on a smaller scale. Overall, the Japanese financial system is operating normally, on a reduced scale, without any systemic credit crisis at this moment. The only problem is the continued existence of a large stock of nonperforming loans and bad debts and a lack of consensus-based policy actions on the part of the authorities to cope with this problem. As described in earlier sections, 30 to 40 percent of total bad loans had already been covered by mid 1995 with accelerated transfers to loan-loss reserves and with liquidation of bad debts through the CCPC. As a result, the estimated amount of noncovered bad loans, including problematic loans made by Ju-Sens, was reduced to 18.3 trillion yen ($183 billion) by the end of September 1995. It is likely that the authorities will be eventually forced to mobilize
is This phenomenon is expected to be happening at a reduced scale even if the Japanese govermnent manages the problems of the bad debts without the occurrence of a systemic financial crisis.
about 5 to 10 trillion yen ($50 to $100 billion) of public funds to protect deposits and loans in small financial institutions and Ju-Sens.'9
The Bank of Japan has assets to enable it to supply more than sufficient short-term liquidity. On the U.S. side, authorities have already made preemptive strikes against possible negative ripple effects by showing their determination to supply short-term liquidity on demand. The quick supply of liquidity to subsidiaries of Japan's financial institutions (and to other affected institutions) through purchase-back of short-term treasury bills will alleviate any liquidity crisis and minimie the negative effects on longer-term instruments (bonds, securities), thereby keeping long-term interest rates relatively unaffected.
V. Public Sector Bailout - What Form Is It Likely To Take?
In view of the above discussion, a systemic financial crisis that has a serious effect on world financial markets and the world economy seems unlikely. However, it is not impossible, particularly if, as some analysts believe, a sizable number of bad loans has not been reported. Even ignoring these possible additional bad loans, there are looming risks of a further devaluation of property values taken as collateral, and of a possible downturn in the stock market that could wipe out latent gains. As Murashima's calculation suggests, a lump sum write-off of bad debts is not an option, since it would lower the capital adequacy ratio to below the BIS limit in every type of deposit-taking financial institution and make these institutions inoperative. Therefore, it is imperative that there be an accelerated write-off against the backbone of an expanding economy and an introduction of public funds for a bailout of smaller financial institutions and Ju-Sens that lack the ability to self-generate write-offs, resulting in higher fiscal expenditures or fiscal debt stock.
The very existence of a large amount of bad debt, however, has hindered and will continue to hinder the creation of new credit, and thus has a dampening effect on economic activities. There has been no public consensus on whether to introduce public funds for a bailout, nor it is expected in the near future. Therefore it is worthwhile to construct several indicative scenarios, including some that involve a type of financial crisis and/or public bailout in line with the "Japan Problem" arguments. In the following paragraphs, we briefly discuss the form that a public sector bailout would be likely to take, drawing on past cases from other countries. This will give some rationale to the design of the model-based simulations reported in the next section.
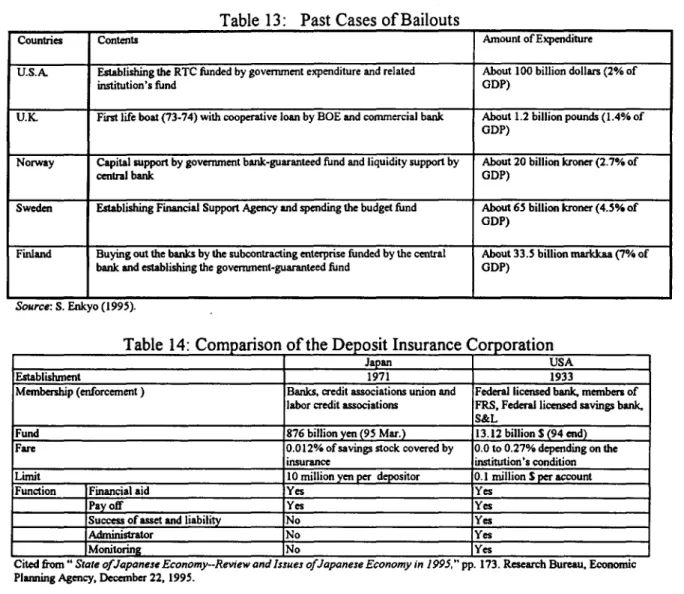
The recent cases of bailouts by the public sector are sumnarized in Table 13. The size of bailout (loss) ranges from 1.4 percent of GDP in the U.K. case to 7 percent in Finnish case. In Japan's case, if the authorities try to cope with the problem in a decisive manner, the bailout would likely cost as much as 2 percent of GDP, or about 10 trillion yen (US $100 billion), against an estimated 18.3 trillion yen in noncovered bad loans. The likely form of a publicly funded bailout can be inferred in particular from the recent financial sector crises in the United States and Finland.
19 In Section VI, we conduct a simulation for public bailout, assuning the size of the bailout at 2 percent
Failures and subsequent bailouts in the savings and loan (S&L) industry in the United States during the 1980s and early 1990s present a case against which Japan's possible financial crisis can be compared. The total cost to U.S. taxpayers of cleaning up the savings and loan debacle was estimated in 1991 by the Congressional Budget Office to be more than $215 billion (Manchester and McKibbin, 1994). In 1994 that estimate was lowered to about $150 billion by the same office. The bailout consisted of the U.S. government first issuing implicit guarantees to cover future losses and
then funding deposit reimbursements. Therefore, in the US. case, net outlays were financed
through an increase in public expenditure and thus in the fiscal deficit. The fiscal policy associated
with financing the S&L failures led to over-consumption during the 1980s. This over-consumption resulted in lower private saving, lower physical investrnent, and lower output growth for a number of years (Manchester and McKibbin, 1994).
The Finnish banking crisis, which began in 1991, resulted in large-scale government support operations in the form of guarantees aimed at strengthening banks' balance sheets, with a number of nonperforming loans in private institutions being taken over by the government and grouped into a new publicly owned company. In total, government support to the banking sector over
1991-94 amounted to some 15 percent of GDP, primarily reflected in a direct rise in the level of
government debt rather in higher current expenditures (Barrell, Pain, and Morgan, 1995).
The most likely bailout in Japan would involve a mixture of these two experiences, with an injection of public funds into the official Deposit Insurance Corporation, established in 1971, which has a legal commitment to compensate depositors in insolvent banks. The structure and functions of the Japanese Deposit Insurance Corporation are compared in Table 14 to those of the U.S. Federal Deposit Insurance Corporation (FDIC). Japan's Deposit Insurance Corporation does not take over the assets or liabilities of insolvent banks, nor does it monitor ailing financial institutions. Therefore, in addition to the injection of public funds through the Deposit Insurance Corporation, some additional debt-financed purchase of banking sector assets by other entities is highly likely (say, through the CCPC) in the event of a Japanese banking crisis.
In fact, the government and the Bank of Japan have already been helping the insolvent financial institutions with special loans or donations from the Deposit Insurance Corporation. Recent loans are tabulated in Table 12. The Bank of Japan as lender of last resort has also made extensive special loans ("Nichigin Tokuyu") to save insolvent or almost insolvent financial institutions in the latter half of 1995. Figure 14 portrays the Bank of Japan's recent special lending activities, and Figure 15 shows the stock of outstanding special loans ("Tokuyu") and its increasing share in total outstanding loans.
Studies of the economic costs of the U.S. savings and loan crisis (including misallocated capital and the costs of the bailout) suggest that cumulative GDP losses could be as high as 8 percent between 1982 and 2007. Real long-term interest rates were pushed an estimated 50 basis points higher, at their peak, than they would have been otherwise by the late 1980s, and the U.S. dollar was also 1.5 percent stronger than it would have been otherwise. Given the scale of the problem, it seems likely that the economic costs of a crisis in Japan will also be large. Growth has averaged only a little over 1 percent a year in 1991-95, with real long-term interest rates averaging only a little below U.S. rates and the real value of the yen surging during this period. The fiscal costs of restructuring would add to the structural deficit that was built up by the effort to combat the recession. This would add to
the problem of a less favorable starting point from which to confront the problems associated with population aging in the next century.
From both the economic and political viewpoints, the most controversial issues confronting the financial sector are the financial troubles of the Ju-Sens and the public funding of any bailout. Because the use of public funds implies an increase in public debt and in the future (or current) tax burden, it is difficult to achieve a national consensus to support ailing financial institutions. On the other hand, the opportunity cost of postponing a decisive set of policy measures to rapidly reduce or eliminate nonperforming loans has been mounting. The time bomb is ticking.
VI. Model-Based Simulations
This section presents results from a set of macroeconometric, model-based simulations conducted to investigate likely effects on both the Japanese economy and the rest of the world of possible critical events in the ailing Japanese financial sector. Because simulation results are essentially subject to model properties, the aim of these simulations is only to indicate possible qualitative responses of major macroeconomic variables to major financial sector shocks, and to draw implications about shock diffusion under various publicly funded bailout schemes.
A. The Model
This study utilized the fifth-generation EPA World Economic Model created and maintained by the Government of Japan's Economic Research Institute of the Economic Planning Agency for its simulations. This is basically a demand-oriented, Keynesian model with an IS-LM-BP framework, and is made up of the following submodels:20
1) three medium-sized country models of the United States, Japan, and Germany (restricted to the former West Germany);
2) six small-sized country models of France, the United Kingdom, Italy, Canada, Australia, and Korea;
3) six regional models of Asia (excluding Japan and Korea); Western Europe (excluding the countries mentioned above); Latin America; the Middle East; the former Soviet Union and Eastern Europe; and the rest of the world; and
4) a trade linkage model.
Our simulations use the medium- and small-sized country models to predict the effects of various policy options. All models employ basically the same specifications in structural equations. The entire system contains 1,234 equations (322 structural equations and 912 identities), the same number of endogenous variables, and 297 exogenous variables.
20 For a detailed exposition of the model, see "EPA WORLD ECONOMIC MODEL - Fifth Version,"
The estimation period is from 1983 to 1992. The period is limited to ten years so that the model reflects characteristics of the most recent economic structure. The model has also been restructured from the original EPA model to some extent in order to capture the economic dynamics surrounding the creation and bursting of the bubble.2'
B. Fall in Land and Equity Pnces
As discussed in preceding sections, the financial sector problem in Japan is deeply connected with the collapse in land and equity prices.22 Furthermore, in the absence of major publicly funded bailouts, possible bank runs would force the sale of land and equities held by these financial institutions, causing a further decline in asset prices and exacerbating the problem.' With this in mind, simulations were conducted for the cases of 25 percent asset price deflation in land and
equities, respectively.
The land price is defined in the model as the land value index of residential sections in city areas. Its variation affects private consumption and money demand (cash and time deposits, in particular) through changes in the household sector's net worth at the outset. The equity price is defined as that in the Tokyo Stock Price Index, since that reflects the market condition better than other average prices (e.g. Nikkei 225). Its forward linkage starts from the price earnings ratio (PER), which influences investment decisions of the corporate sector and is one of the crucial factors determiniing the user cost of capital (relating to Tobin's q). The variation of the equity price also directly affects the household sector's net worth, and thus changes consumption pattems and money demand behavior.
Tables 15 and 16 collect the computation results from simulated declines in land and equity prices, respectively. Although the percentage decline in prices is the same in both simulations (25 percent decline from baseline values), the magnitude of the impacts seems to differ greatly in these two cases. This is due largely to size effects. Roughly speaking, the total value of land property was
21 The simulations used the period 1983 to 1992 for two reasons. First, EPA's baseline projections were strictly confidential. Second, using this period enabled us to concentrate on analyses of the multiplier process rather than speculating on an arbitrary baseline forecast that would need to be adjusted in response to financial sector developments and policy initiatives.
22 Collateral banking is the typical form of bank lending in Japan. The custom of using land as collateral saves evaluation and monitoring costs as compared to costs under project banking. Japanese banks require sufficient land property as collateral, particularly in the case of loans to small- to medium-sized enterprises. 23 Heavy sales of equities by financial institutions, however, may not be a likely outcome since holdings and cross-holdings of equities that involve financial institutions are usually structured for a long-term
about three times larger than that of equities.24 The relatively low level of the aggregate equity values in total asset holdings partly explains why asset operations by the official funds or any other measures in support of equity prices-aimed at assisting city banks to pass the BIS standard-could
have only a marginal effect on macroeconomic activities.2 5 Apart from the differential size effects
and a slight difference in their channels of initial shock diffusion, sirnulated declines in asset prices created similar qualitative responses. These simulations single out the negative effects of asset price deflation on the Japanese economy, for both land and equities, in the following manner:
1) In both cases, declines in asset prices themselves would have depreciated the yen. The rapid appreciation of the yen during the first 8 months of 1993, which lengthened the business cycle downturn, was caused mainly by the interest rate differential between the Japanese and U.S.
economies.2 6
2) GDP growth stagnates due to a slowdown in domestic absorption, despite the positive contribution from foreign sectors helped by currency depreciation.
3) Stagnation in domestic absorption reduces money demand and therefore interest rates. However. massive deflation causes increases in real interest rates after the third or fourth year.
4) Private consumption stagnates due to declines in disposable income and households' net worth. Movements in real interest rates turn hostile to consumption activities the third or fourth year following the shock. Declines in private consumption are generally larger than those in disposable income due to negative wealth effects, and the household saving rate increases when
dissaving is preferable to stimulating an ailing economy. 27
24 For comparison purposes, the impacts can be size adjusted using SNA statistics (see Table 1). From
April 1991 to October 1993, equity prices declined by 56.4 percent in real terms and the ratio of real capital loss to the GDP was 0.95. On the other hand, land prices declined by 30.9 percent during the same period in real terms and the ratio of real capital loss to the C-DP was 1.55. This implies that the total value of land property was about three times larger than that of equities. Thus, the impact of a 75 percent decline in equity prices should, roughly speaking, be directly comparable to that of a 25 percent decline in land prices.
A decline in land prices should, in principle, have two different and opposite effects: the aforementioned negative effects on credit creation, and positive effects through declines in producers' costs where land is
used as an input. The model captures the negative effects successfully but not the positive effects, and thus
tends to overestimate the impact of land price deflation.
25 Measures taken in support of equity prices would normally drag down Japan's export growth by
appreciating its currency.
26 This, in turn, was a product of desynchronized business cycles and opposite stances in monetary policies
in Japan and the United States. The United States reached the peak of its last cycle in 1989 and a trough in 1991. As a result, the U.S. Federal Reserve Board guided interest rates lower during this period (see footnote 6) while the Japanese monetary authority took a tighter policy stance to cope with the bubble.
27 Ogawa, et al., (1994b) analyzed the effects of variation in household assets on consumption behavior in
the recent Japanese context. His study found strong causality from values of liquidity assets to consumption
5) Growth slows in both housing and business fixed investments as income growth stagnates. An increase in real interest rates further drags down housing investment in later years. A decline in PER further stagnates business investment by increasing the cost of capital.
6) Stagnation in domestic demand results in lower import demand. The declines in imports of energy and raw materials are smaller than those in manufactured goods. This is due mainly to higher income elasticity attached to import demand for manufactured items.2'
7) With exports receiving a positive boost from currency depreciation, the trade and current account surplus widens. The increased current account surplus can be decomposed into decreasing public sector -savings (due to reduced tax revenue) and increasing private sector savings, as described above, which outweighs the decrease in public sector savings.
8) Foreign direct investment gradually increases in spite of the depreciating yen. Movements in the relative (nominal) interest rate (the U.S./Japan in the current model) turn out to be the more dominant factor. Investmnent funds tend to go abroad in search of profitable investrnent opportunities.
For the effects on the rest of the world (tabulated only for land prices), the simulations indicated slower world trade growth and declines in export prices of commodities and manufactured goods, with the terms of trade turning against commodity exporters (and manufactured goods
importers). Export growth in every developing region slowed in these simulations." In the U.S. market, with assumptions of neutral fiscal and monetary policies (policy variables were fixed at respective baseline values), growth slowed as exports lagged due to both stagnant Japanese import demand and appreciation of the dollar. U.S. import demand was simulated to increase despite the growth slowdown since the positive effects through exchange rate appreciation outweighed the negative income factor. Short-term interest rates declined in both nominal and real terms. Real long-term rates declined marginally in the initial years but increased at the end of the simulation period. As a result, developing regions were forced to face higher real long-term rates on top of the negative effects of decreased trade volumes combined with deterioration (in the case of commodity exporters) in the terns of trade.
28 Income and price elasticity to imports are:
| Price elasticity Income elasticity
Aggregate import -0.35 1.26
Oil and other energy -0.03 0.88
Food and raw material -0.30 0.85
Manufacturing products -0.84 2.13
For exposition of the recent increase in merchandise imports, reflecting structural changes in Japanese markets, see Otsubo (1996) and Kawasaki and Tsutsumni (1996).
29 The only exception is Latin America's export growth in later years. where a boost in export price competitiveness (Latin America's export prices relative to those of competitors) is simulated to outweigh the slowdown in effective export market growth.
C FYnanclal Sector Crisis and Bailouts
Although the possibility of a systemic financial sector crisis is unlikely, as discussed earlier, simulation analyses for limited-scale bank runs and subsequent publicly funded bailouts are still of great interest. The runs observed at the Kizu and Cosmo credit unions and at other regional banks in the latter half of 1995, and the mounting problems of ailing Ju-Sens (mortgage institutions) in 1996, have given rise to the fear of a financial sector crisis.
1. Scenario Design
A limited-scale bank run worth about 2 percent of nominal GDP is assumed at the outset of the crisis. The size of the initial shock was chosen arbitrarily to necessitate about 10 trillion yen ($100 billion) worth of public funds infusion (evaluated at the 1996 price level) to cope with the short-term liquidity crisis.30 The simulation assumes that the withdrawn deposits will be added to cash hoarding by the household sector-money under the bed--during the crisis rather than redeposited in other, less vulnerable financial institutions. An initial simulation with no public involvement was conducted to show the necessity of the monetary and fiscal authorities' involvement at the advent of the crisis. Subsequent simulations represent the cases of bailout by public funds with and without particular forms of financing for the increased public debt stock.
The following scenarios were tested: Scenario 1 (SlJ)-Runs without Bailouts
Bank runs occur. Money worth 2 percent of nominal GDP is drawn from demand deposit accounts at financial institutions and is added to the household sector's cash hoarding. The added cash hoarding stays as money under the bed throughout the simulation period. No accommodation of short-term liquidity by the monetary authority is assumed. Thus, the stock of high-powered money is kept constant and interest rates respond endogenously to market forces.
Scenario 2 (52)-Public Bailout Financed by Increased Fiscal Debt Stock
The Bank of Japan intervenes and supplies liquidity to keep short-term interest rates constant (at the baseline level). The fiscal authority bears the burden of liquidity creation by issuing bonds to provide credit-side items in the central bank's balance sheet.3' The level of fiscal debt stock increases by the same amount. This strong showing of the public sector's determination to cope with the liquidity squeeze restores the household sector's confidence in the financial sector, and this causes redepositing
30 See discussions in Section V for the rationale of choosing a crisis of this size.
31 The central bank's direct underwriting of government bond issues is prohibited in a strict sense. Under a crisis situation, this setup is used to approximate the monetary authority's liquidity supply (Nichigin Tokuyu), coupled with the fiscal authority's burden sharing through increases in fiscal spending and/or in debt stock.
of withdrawn cash in financial institutions by the start of the third year after the initial runs.32 Accumulated issues of bonds during the first two years amount to 10 trillion yen ($100 billion) at the
1996 price level.
Scenario 3 (S3)-Public Bailout Financed by Cuts in Public Investment Expenditure
Government reduces investment expenditures to improve fiscal balance and regain baseline levels of debt stock. The size and pattern of reductions are identical to those of required bond issues in the first two years after the crisis.
Scenario 4 (S4)-Public Bailout Financed by Temporarily Increased Taxes on the Household Sector
Government increases taxes on the household sector to finance the bailout. The size and pattern of initial exogenous tax increases are identical to those of required bond issues in the first two years after the onset of the crisis. The tax increase is for only two years and is described as a temporary measure. Despite the household sector's reluctance to finance a bailout of ailing financial institutions, economists regard some form of burden sharing by that sector as necessary for an ultimate solution to the financial sector problem.
Scenario S (55)-Public Bailout Financed by Increased Taxes on the Household Sector
Same as Scenario 4 except that the increased tax burden is spread out throughout the simulation period. This is considered a more expectation-neutral policy.
2. Effeds on the Japanese Economy
Figure 16 summarizes the simulated effects of the scenarios on the Japanese economy. If the monetary authority does not supply short-term liquidity at the advent of runs (Scenario 1), the Japanese economy falls into an abrupt recession with a downward deflationary spiral. Under this scenario, as the financial sector ceases to function as an intermediary for credit creation, money stock (M2) in the economy declines sharply and remains 2.5 to 3 percent lower than the baseline even in the longer run. Real long-term interest rates rise as much as 80 basis points and do not come down to the baseline level. Accordingly, the level of fixed business investment declines and stays more than a full percentage point lower than in the base case, even at the end of the simulation period. Private consumption tumbles and also does not return to the baseline level. The general government balance worsens as tax revenues decline, while the recession continues without any recovery in sight. The current account balance also worsens, albeit to a lesser degree, despite reduced import demand. This is due to stagnation in exports caused by lackluster world trade activity and loss of price competitiveness as the yen appreciates as much as 4 percent in the short term and 5 percent after a decade (Figure 17). A slight worsening of the current account balance, coupled with a larger increase in the general government's deficit, implies a rising savings ratio in the private sector. This seems
32 Scenario 1.5 (S1.5) is created as a reference point. In this simulation, the automatic return of withdrawn cash to banks' demand deposit accounts is assumed without any form of bailout.