Experimental Computational Simulation
Environments for Algorithmic Trading
Michal Galas
The Thesis submitted in partial fulfillment of the requirements for the degree of
Doctor of Philosophy University College London.
This thesis is substantially the result of my own work except where explicitly indicated in the text. The report will be distributed to the internal and external examiners, but thereafter may not be copied or
distributed except with permission from the author.
Department of Computer Science University College London
Abstract
This thesis investigates experimental Computational Simulation Environments for Computational Finance that for the purpose of this study focused on Algorithmic Trading (AT) models and their risk. Within Computational Fi-nance, AT combines different analytical techniques from statistics, machine learning and economics to create algo-rithms capable of taking, executing and administering investment decisions with optimal levels of profit and risk. Computational Simulation Environments are crucial for Big Data Analytics, and are increasingly being used by ma-jor financial institutions for researching algorithm models, evaluation of their stability, estimation of their optimal parameters and their expected risk and performance profiles. These large-scale Environments are predominantly designed for testing, optimisation and monitoring of algorithms running in virtual or real trading mode. The state-of-the-art Computational Simulation Environment described in this thesis is believed to be the first available for academic research in Computational Finance; specifically Financial Economics and AT. Consequently, the aim of the thesis was: 1) to set the operational expectations of the environment, and 2) to holistically evaluate the prototype software architecture of the system by providing access to it to the academic community via a series of trading competitions. Three key studies have been conducted as part of this thesis: a) an experiment investigating the design of Electronic Market Simulation Models; b) an experiment investigating the design of a Computational Simulation Environment for researching Algorithmic Trading; c) an experiment investigating algorithms and the design of a Portfolio Selection System, a key component of AT systems.
Electronic Market Simulation Models (Experiment 1):this study investigates methods of simulating Electronic
Markets (EMs) to enable computational finance experiments in trading. EMs are central hubs for bilateral exchange of securities in a well-defined, contracted and controlled manner. Such modern markets rely on electronic networks and are designed to replace Open Outcry Exchanges for the advantage of increased speed, reduced costs of transac-tion, and programmatic access. Study of simulation models of EMs is important from the point of view of testing trading paradigms, as it allows users to tailor the simulation to the needs of particular trading paradigms. This is a common practice amongst investment institutions to use EMs to fine-tune their algorithms before allowing the algorithms to trade with real funds. Simulations of EMs provide users with the ability to investigate the market micro-structure and to participate in a market, receive live data feeds and monitor their behaviour without bearing any of the risks associated with real-time market trading. Simulated EMs are used by risk managers to test risk characteristics and by quant developers to build and test quantitative financial systems against market behaviour.
Computational Simulation Environments (Experiment 2):this study investigates the design, implementation and
Envi-Abstract 3
ronment consists of a set of distributed, multi-threaded, event-driven, real-time, Linux services communicating with each other via an asynchronous messaging system. The Environment allows multi-user real and virtual trading. It provides a proprietary application programming interface (API) to support research into algorithmic trading models and strategies. It supports advanced trading-signal generation and analysis in near real-time, with use of statistical and technical analysis as well as data mining methods. It provides data aggregation functionalities to process and store market data feeds.
Portfolio Selection System (Experiment 3): this study investigates a key component of Computational Finance
systems to discover exploitable relationships between financial time-series applicable amongst others to algorith-mic trading; where the challenge lays in identification of similarities/dissimilarities in behaviour of elements within variable-size portfolios of tradable and non-tradable securities. Recognition of sets of securities characterized by a very similar/dissimilar behaviour over time, is beneficial from the perspective of risk management, recognition of statistical arbitrage and hedge opportunities, and can be also beneficial from the point of view of portfolio diversifi-cation. Consequently, a large-scale search algorithm enabling discovery of sets of securities with AT domain-specific similarity characteristics can be utilized in creation of better portfolio-based strategies, pairs-trading strategies, sta-tistical arbitrage strategies, hedging and mean-reversion strategies.
This thesis has the following contributions to science:
Electronic Markets Simulation - identifies key features, modes of operation and software architecture of an
elec-tronic financial exchange for simulated (virtual) trading. It also identifies key exchange simulation models. These simulation models are crucial in the process of evaluation of trading algorithms and systemic risk. Majority of the proposed models are believed to be unique in the academia.
Computational Simulation Environment - design, implementation and testing of a prototype experimental
Com-putational Simulation Environment for ComCom-putational Finance research, currently supporting the design of trading algorithms and their associated risk. This is believed to be unique in the academia.
Portfolio Selection System - defines what is believed to be a unique software system for portfolio selection
con-taining a combinatorial framework for discovery of subsets of internally cointegrated time-series of financial securities and a graph-guided search algorithm for combinatorial selection of such time-series subsets.
Declaration
I, Michal Galas, confirm that the work presented in this thesis is my own. Where information has been derived from other sources, I confirm that this has been indicated in the thesis. Some of the work presented in this thesis has previously been published and submitted by the author in the following papers:
1. Galas, M., Brown, D., & Treleaven, P.”A Computational Social Science Environment for Fi-nancial/Economic Experiments”, CSSSA2012.
2. Treleaven, P., Galas, M.”Algorithmic Trading, Flash Crashes & IT Risk”, Risk Management in Financial Institutions, Euromoney Books, 2013.
3. Treleaven, P., Galas, M., & Lalchand, V.”Algorithmic Trading: review”, Communications of the ACM 56.11 (2013): 76-85.
4. Galas, M., Grochmalicki, J., & Treleaven, P. ”Algorithmic Trading Development Process”, Manuscript Submitted.
Acknowledgements
I believe that Experimental Computational Simulation Environments will have significant impact on the way research is conducted in Computational Social Science. The EPSRC and ESRC are each inter-ested in funding data infrastructure projects: including Big Data Analytics, Systemic Risk Modelling and scientific approaches to Socio-Economic-Financial Simulation. Investments in Big Data Analyt-ics infrastructure will, in authors opinion, naturally evolve into experimental Computational Simulation Environments (cf. Financial Wind Tunnels).
The Computational Simulation Environment investigated in the thesis was successfully deployed over a network of servers in UCL. The environment is used for financial economics research and for the organization of algorithmic and manual trading competitions on a UK, European and global scale. Col-laborators included Euronex (Deutsche Borse), Barclays, Knight, City, LMAX, Microsoft. Various com-ponents of the experimental system were utilised in commercial projects with LMAX, Tower Trading and Microsoft.
All the core elements of the three experiments were designed and implemented by the author with support of a group of approximately 60 BSc, MSc and PhD students over the period of 4 years. The author of the thesis was responsible for the research and design of the software architecture of the elements, for implementation of the key algorithms, for the design of experiments and for supervision of multiple groups of students that were testing the created systems.
The author would like to express his sincere gratitude to Prof Philip Treleaven and Dr Dan Brown for supervision of the thesis. The author would also like to thank Dr Jan Grochmalicki, Vidhi Lalchand, Akash Parvat Goswami, Kacper Chwialkowski and numerous groups of BSc, MSc and PhD students for their help.
Contents
1 INTRODUCTION 10
1.1 Motivation and Context . . . 10
1.2 Problem Statement . . . 11
1.3 Research Methodology . . . 13
1.4 Thesis Structure . . . 14
1.5 Contributions . . . 16
2 BACKGROUND AND LITERATURE REVIEW 18 2.1 Computational Simulations for Financial Economics . . . 18
2.2 Components of Computational Simulation Environments . . . 20
2.2.1 Financial Data Streaming and Market Information Services . . . 21
2.2.2 Big Data Facilities and Data Warehousing . . . 22
2.2.3 Complex Event Processing Engines . . . 22
2.2.4 Analytical Tools and Libraries . . . 22
2.2.5 Experimental and Simulation Environments . . . 23
2.2.6 Trading Platforms for Manual and Algorithmic Traders . . . 23
2.2.7 Social Media Platforms for Sentiment Analysis . . . 23
2.3 Algorithmic Trading (AT) . . . 24
2.3.1 AT Classification . . . 28
2.4 System Architectures for AT . . . 30
2.4.1 External Communication Layer . . . 30
2.4.2 Internal Communication Layer . . . 31
2.4.3 Business Logic Layer . . . 32
2.5 Conclusions & Summary . . . 34
3 ELECTRONIC MARKET SIMULATION MODELS 35 3.1 Electronic Markets (EMs) . . . 35
3.1.1 Electronic Market infrastructure . . . 37
3.1.2 Standard Order Instructions . . . 39
3.1.3 Order Book and Matching Process . . . 40
3.2 Software Engineering principles and drivers . . . 47
3.2.1 Market Participants . . . 47
3.2.2 Trading Approaches . . . 48
3.2.3 Trading Stimulus . . . 48
3.2.4 Algorithmic Trading Development Process . . . 49
3.3 Simulation with Electronic Market Models . . . 52
3.3.1 Simulation Types and Applications . . . 53
3.3.2 Experimenting with EM Simulators . . . 55
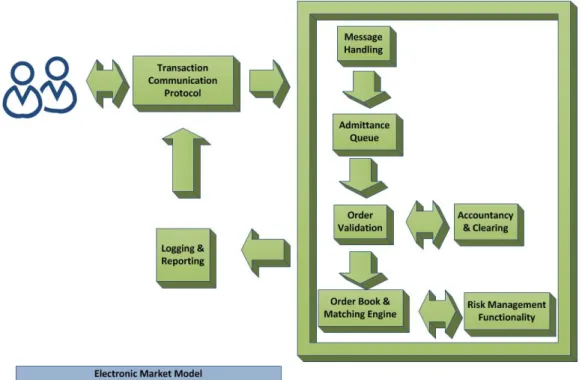
3.4 EM System . . . 56
3.4.1 EM Functionality . . . 56
3.4.2 EM Software Architecture . . . 57
3.4.3 EM Dynamic Data Flows . . . 59
3.5 Summary Discussion . . . 61
3.5.1 Performance Tests . . . 62
4 COMPUTATIONAL SIMULATION ENVIRONMENT FOR AT (ATRADE Platform) 64 4.1 Experimental Computational Environments . . . 64
CONTENTS 7
4.1.1 Research Questions . . . 64
4.1.2 Common Systems Architecture . . . 65
4.1.3 ATRADE Functionality . . . 68
4.1.4 SocialSTORM Functionality . . . 69
4.2 Algorithmic Trading Environment . . . 70
4.2.1 The Server-Side Services . . . 71
4.2.2 The Internal Communication Bus . . . 71
4.2.3 The Connectivity Engine (CONN) . . . 72
4.2.4 The Order Management Engine (OME) . . . 73
4.2.5 The Smart Order Routing (SOR) . . . 73
4.2.6 The Authentication & Authorization . . . 74
4.2.7 The Data Aggregation & Processing Engines . . . 75
4.2.8 The Developer Client . . . 75
4.2.9 The User Client . . . 76
4.2.10 The Statistics Client . . . 77
4.3 Summary Discussion . . . 78
4.3.1 Performance Tests . . . 79
5 PORTFOLIO SELECTION SYSTEM (PSS) 82 5.1 Financial Portfolio Selection/Construction . . . 82
5.1.1 Research Questions . . . 82
5.2 Time-Series Similarity Measures . . . 86
5.3 Time-Series Subset-Search and Clustering . . . 88
5.4 PSS Functionality . . . 89
5.5 PSS Software Architecture . . . 90
5.6 Summary Discussion . . . 96
5.6.1 Performance Tests . . . 99
6 EVALUATION AND ASSESSMENT 101 6.1 Evaluation of Environment quality . . . 102
6.2 Evaluation of Environment performance . . . 104
6.3 Evaluation with Trading Competitions . . . 106
6.3.1 Algorithmic Trading Competition 2010 . . . 107
6.3.2 Algorithmic Trading Competition 2011 . . . 111
6.3.3 Manual Trading Competition 2012 . . . 116
6.4 Evaluation Summary . . . 119
6.4.1 Comparison with other Environments . . . 119
6.4.2 Discussion on applicability of used technologies . . . 120
7 CONCLUSIONS AND FUTURE WORK 124 7.1 Conclusions . . . 124
7.1.1 Computational Simulation Environment for AT (ATRADE Platform) . . . 125
7.1.2 Electronic Market Simulation Models . . . 127
7.1.3 Portfolio Selection System (PSS) . . . 128
7.2 Contributions to Science . . . 130
List of Figures
1.1 Experiments Relationship. . . 11
2.1 Key stages of Algorithmic Trading process. . . 25
2.2 Low-level Algorithmic Trading Taxonomy. . . 28
2.3 Cisco Trading Floor Architecture [Risca, 2008], where ECN is an acronym for Electronic Communication Network. . . 30
3.1 Key elements of an Electronic Market. . . 37
3.2 Electronic Market Simulator performance statistics. . . 63
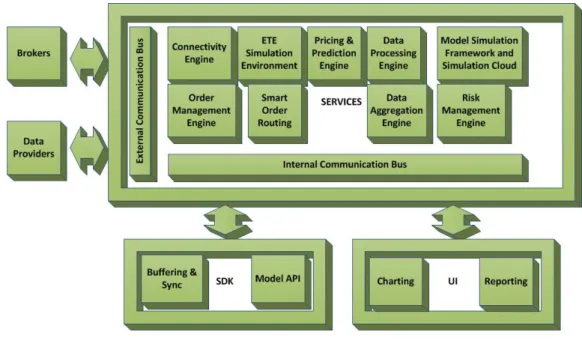
4.1 Key elements of a typical Computational Simulation Environment. . . 66
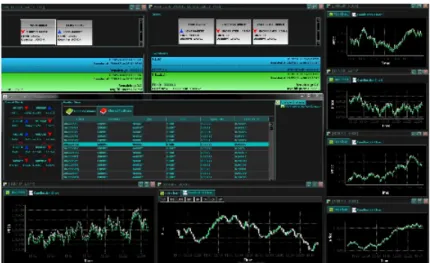
4.2 The Graphical User Interface screen shot of the User Client. . . 77
4.3 Server spec. . . 79
4.4 Client spec. . . 80
4.5 Inbound Tick Data. . . 80
4.6 User Statistics. . . 80
5.1 Key elements of the Portfolio Selection System. . . 90
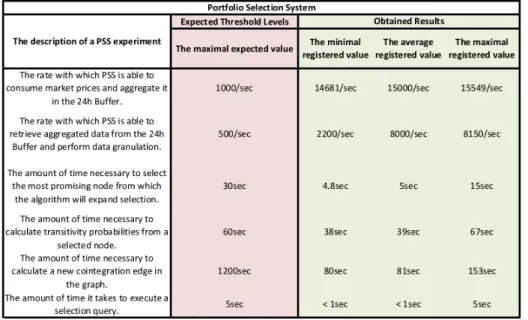
5.2 PSS Environment performance statistics. . . 99
6.1 Example Sonar’s Dashboard functionality for one of the evaluated source-code reposito-ries (JMS). . . 103
6.2 Example Sonar’s Hotspots functionality for one of the evaluated source-code repositories (JMS). . . 104
6.3 Example Sonar’s Time Machine functionality for one of the evaluated source-code repos-itories (JMS). . . 104
6.4 Example TeamCity’s statistics for one of the evaluated source-code repositories (JMS). . 105
6.5 Inbound Tick Data. . . 105
6.6 User Statistics. . . 106
6.7 Server spec. . . 106
6.8 Client spec. . . 106
LIST OF FIGURES 9
6.9 Total Profit. . . 108
6.10 Maximal amount of consecutive win and loss trades. . . 109
6.11 Total number of trades per group. . . 109
6.12 Risk analysis results. . . 110
6.13 Maximum single trade fall. . . 110
6.14 Profit & Loss . . . 111
6.15 Statistics for trades and their potential ratio. . . 112
6.16 Consecutive win and loss transactions. . . 114
6.17 Daily Return Volatility and example P&L Evolution. . . 114
6.18 Sharpe ratio. . . 115
6.19 Ranking of the 2011 competition ordered by P&L. . . 115
6.20 General Statistics of the competition. . . 116
6.21 List of futures held by the top ranking participants. . . 117
6.22 Evolution of P&L results of top traders. . . 118
6.23 Remaining margin. . . 118
Chapter 1
INTRODUCTION
This chapter introduces the concept of Computational Simulation Environments for financial experiments and describes three applications of such environments to the problem of algorithmic trading. The chapter gives a brief summary of the objectives set for the thesis, the study of the problems and the contribution of the covered topics to science. Finally, it provides an overview of all the other chapters in the thesis.
1.1
Motivation and Context
This thesis investigates experimental computational environments for simulation of trading algorithms and their associated risk. Algorithmic Trading (AT) is a relatively new discipline of computational fi-nance that investigates applications of computers to the automation of one or more stages of investment strategies, including automation of risk management and asset allocation [Nuti et al., 2011]. Automa-tion of investment strategies implies the existence of exploitable, repetitive patterns of behaviour of the traded securities. Discovery of such patterns of behaviour requires significant amount of research and computational power, and therefore justifies the existence of computational environments for algorithmic experiments.
To conduct a rigorous investigation of algorithms and risk associated with various potential investment scenarios, one requires a software system able to evaluate the quality (’utility’) of strategies being ex-posed to different ’temporal’ circumstances. One also requires a management and reporting system able to execute different hypotheses. This scientific rigour can be imposed by the simulation environments and the way they allow users to operate. The environments may enable repetition and replay of experi-ments, monitoring of the behaviour of experiments and most importantly direct utilisation of successful experiments without a need of recoding. Given the above one can argue that the field of computational finance focus on the computational investigation of financial systems, models of behaviour of financial algorithms, and finally on the ways to measure/summarize such algorithms. One important consequence
1.2. Problem Statement 11
of this state of affairs is the fact that experimental simulation environments may shape evolution of algorithmic trading and general social sciences for the coming decades.
1.2
Problem Statement
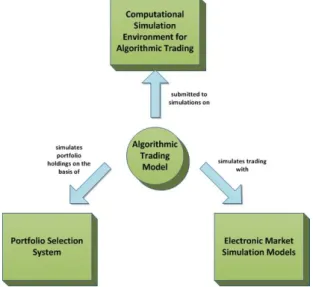
In the light of the above, three different experiments were conducted to create computational simulation systems suitable for experimentation in the design of trading algorithms, their performance and risk. The relationships between the experiments are summarized by Figure 1.1.
Figure 1.1: Experiments Relationship.
An ability to investigate and evaluate behaviour of models is central to computational finance. The author identified seven general simulation types that can be conducted to experiment with such models: 1) a Free-Run, 2) a Back-Test (normal circumstances), 3) a Stress-Test (abnormal circumstances), 4) a Forward (Monte-Carlo)-Test, 5) a Sensitivity-Test, 6) an Optimisation, and 7) a Multi-Agent-Simulation version of the described tests.
Free-Run is a process of simulation on-the-fly, with results being generated on the basis of newly provided input parameters, as soon as they appear.
Back-Test is a process of simulation on the basis of historical records of event occurrences.
Stress-Test is a process of simulation on the basis of ’abnormal (highly unexpected) data stances’, while i.e. the back-test can be considered a run over historic ’expected data circum-stances’.
Forward (Monte-Carlo) -Test is a process of simulation on the basis of synthetic data generated for multiple, alternative, scenarios most commonly with use of a form of linear drift and an element enforcing stochastic process.
1.2. Problem Statement 12
Sensitivity-Test is a process of model simulation on the basis of synthetic data of different time and values granularity that allows us to estimate the models’ sensitivity characteristics.
Optimisation is a process of running multiple disconnected simulations on the same model but on the basis of different model parameters, with a goal to maximize or minimize an outcome of a simulation measured by the utility function on the model.
Multi-Agent Simulation is a process of model simulation with more than one active, decision taking elements. All the previously mentioned types of simulations and optimisation can be performed on a single-agent model or a multi-agent model. Typically, a single-agent model implies that the model itself is the only active element in the simulation that reacts to the stimuli generated by the simulation process.
For the purpose of the thesis the first two listed simulation types will be applied to experiment with the algorithmic trading models, in a form of a software platform.
A crucial option while experimenting with algorithmic trading is a possibility of executing order instruc-tions with no involvement of real funds. For this reason two models of electronic market exchanges were researched and experimented with. The first model enables the simulation of execution of order instruc-tions against an end-of-day price being streamed to the model from an actual exchange. The second model enables the simulation of execution of order instructions against real-time prices being streamed from external life exchanges. This type of simulation allows testing of trading capabilities in real-time, but is limited to testing ’market taking’ (passive) capabilities due to the fact that it is impossible to influence prices and volumes with instructions issued to the exchange simulator. Design of exchange simulators in this way enables fine-grained experiments customized for:
1. high-frequency traders interested in immediate reactions to real-time prices with positions in traded securities maintained over short periods of time with bursts of order instructions;
2. experiments for intra-day traders interested in identifying daily market regimes and benefiting from maintaining a few hour to one-day positions, with use of a few order instructions a day;
3. portfolio managers to perform experiments with long-term positions adjusted at the end or begin-ning of a day.
As previously stated, automation of investment strategy execution implies existence of exploitable, repet-itive patterns in information describing behaviour of tradable securities and more generally in analytical data used to trade securities. Two approaches can be taken in the process of discovery of tradable patterns. One can either look for behavioural patterns of individual securities or for patterns in relation-ships between groups of securities. The former is well explored in academia (e.g., [Ca˜nete et al., 2008],
1.3. Research Methodology 13
[Gabrielsson et al., 2012], [Huang et al., 2011]) and therefore will not be a subject of investigation in this thesis. The latter fits into the general framework of Markowitz’s Modern Portfolio Theory (going back to [Markowitz, 1952]) and Lo’s Adaptive Markets Hypothesis [Lo, 2004], and due to challenges related to the discovery of stable relationships between securities is far more interesting from the perspective of this thesis. Consequently, the third described experiment involves research of a computational simula-tion system capable of combinatorial searches over a decision space defined by financial time-series to deliver sets (portfolios) of securities with the strongest stable relationships and the largest amounts of securities in the discovered sets.
1.3
Research Methodology
This work focuses on computational finance rather than performance problems encountered in software engineering research. As a result the scientific effort is directed at holistic, operational results of the experimental systems and the applicability of proposed software architectures to a given financial eco-nomic problem of algorithmic trading. Consequently, the methodology steps assumed in this thesis can be considered as follows:
1. To build the knowledge of experimental computational simulation environments the author will summarize existing background knowledge and research related to academic literature.
2. The author will then focus on the design of individual experiments and on implementation of experimental environments to support such work.
3. This will be followed by integration of all the experimental systems, to support access for academic community; that will allow further evaluation.
4. When all the experimental components of the environment are in order, the author will organize a few trading competitions with varying degrees of complexity and trading circumstances; to capture the cross-section of interested academic community (or at least a representative subset) over a longer periods of time.
5. During the organized competitions the author will observe and evaluate the behaviour of partic-ipants through the behaviour of their trading models in the created environment. This will also allow observation of the experimental components of the environment.
6. Finally, based on such qualitative observations of participants and quantitative evaluation of mod-els, a summary can be drawn. This will include the overall holistic, operational behaviour of the experimental computational simulation environment, as well as a discussion of suitability of individual experimental components of the environments.
1.4. Thesis Structure 14
A software engineering approach was assumed to be the most suitable to study the applications of com-putational simulation environments in algorithmic trading. Consequently, for every designed experiment a software system was created to enable simulation. Such systems were constructed in a modular way to connect individual modules into a larger architecture, with the architecture constituting an algorithmic trading environment. All the designed experiments involved utilisation of created software modules to investigate behaviour of the functionality. This approach was found advantageous due to the following: a) it enables experimentation with a possibility of having reusable components on the basis of which more complex systems and consequently more sophisticated experiments can be conducted; b) each ex-periment enforces high test coverage in the component, which has a positive influence in the stability of the environment.
Given the large-scale on which the experiments were conducted as well as a need for sufficiently tested software capable of supporting academic community (competition participants), parts of imple-mentation and testing of the computational simulation systems involved groups of students working on less critical software components. The following software development practices were utilised: a) an agile development practices (Scrum, [Wikipedia, 2013b]) were used to manage execution of tasks & Sprints (a period of time during which specific set of tasks has to be completed) and for organisation of daily-, weekly- & sprint- handover meetings; b) continuous integration methodolo-gies were used to cleanly integrate new additions to the already existing source & binary reposi-tories; c) a test-driven development was used to ensure that necessary quality of the code and to drive development of functionalities; d) a pairs-review and self-documentation methodologies were used to improve quality & readability of committed code; e) to support the above development prac-tices the following technologies were used: Git (http://git-scm.com/), Maven (http://maven.apache.org/), YouTrack (http://www.jetbrains.com/youtrack/), TeamCity (http://www.jetbrains.com/teamcity/), Sonar (http://www.sonarsource.org/) and Nexus (http://www.sonatype.com/Products/Nexus-Professional).
1.4
Thesis Structure
The research methodology described above is reflected in the structure of the thesis. Given the unique-ness and large-scale of the designed experiments, case studies of individual environments are described in separate chapters, containing performance results compared to assumed expectations. Furthermore, an overall operational experiment that utilise all the designed environments is described in a separate chapter. The experiment is provided in a form of behavioural results of various trading competitions that utilised the experimented environments.
The evaluation criteria for individual experiments focus on justification of designed software architec-ture. Limited quantitative evaluation of software performance is also provided. To quantify the overall
1.4. Thesis Structure 15
applicability of utilised architectures, a set of experiments in a form of trading competitions quantify the behaviour of models in the environment, and consequently, indirectly quantify the quality and stability of software architectures.
Chapter 2: BACKGROUND AND LITERATURE REVIEWdiscusses existing research, software ar-chitecture designs and technologies applicable to experimental computational simulation environments. To provide the reader with a sufficient understanding o financial economics modelling, a background knowledge of the on-the-fly and historical simulation of algorithmic trading is provided. Furthermore, since the main focus of the thesis is on the software architecture designs of simulation environments (e.g., market simulations) a variety of separate, but nevertheless related building blocks of such envi-ronments is presented. The sources can be grouped into the following categories: a) Data Streaming & Information Services, b) Analytical Tools & Business Intelligence, c) Experimental & Simulation Envi-ronments, d) Trading Platforms for Manual and Algorithmic/Automated Traders, e) Big Data Facilities & Data Warehousing, and f) Complex Event Processing Engines.
Chapter 3: ELECTRONIC MARKET SIMULATION MODELSinvestigates the simulation of Elec-tronic Trading Exchanges, used to trade virtually without the risk of losing real money. Chapter 3 de-scribes two simulation models that embody the key features of an electronic market exchange. The models incorporate functionalities for order book, matching engine, account management, profit & loss (P&L) clearing, event-based price streaming and order instruction/confirmation messaging to harness the most primitive features of a modern electronic market exchange.
Chapter 4: COMPUTATIONAL SIMULATION ENVIRONMENT FOR ATdescribes the research and design of an experimental Computational Simulation Environment able to support a variety of AT strategies. The environment consists of a set of distributed, multi-threaded, event-driven, on-the-fly, Linux services communicating with each other via an asynchronous messaging system. The Environ-ment allows multi-user real and virtual trading. It provides a proprietary API to support developEnviron-ment of algorithmic trading models and strategies. It allows advanced trading-signal generation and analysis in near real-time, with use of statistical and technical analysis as well as data mining methods. It also provides data aggregation functionalities to process and store market data feeds.
Chapter 5: PORTFOLIO SELECTION SYSTEMdescribes a large-scale search algorithm for dis-covery of sets of securities with an AT domain-specific similarity characteristics that can be utilized in the creation of improved portfolio-based strategies, pairs-trading strategies, statistical arbitrage strate-gies, hedging and mean-reversion strategies. Discovery of exploitable relationships between financial time-series is important in AT. Recognition of sets of securities characterized by a very similar/dissimilar behaviour over time, can be beneficial from the perspective of risk management, recognition of statis-tical arbitrage and hedge opportunities, and can be also beneficial from the point of view of portfolio
1.5. Contributions 16
diversification.
Chapter 6: EVALUATION AND ASSESSMENTpresents evaluation of the outcomes of the three performed experiments by investigating the quality, performance and stability of the created experimental systems. The evaluation is performed in three stages: stage one presents results of software testing through continuous integration, stage two presents performance tests of the Environment, and stage three describes a holistic approach to testing stability of the systems through utilisation in algorithmic and manual trading competitions.
Chapter 7: CONCLUSIONS AND FUTURE WORKdiscusses the overall results obtained from the three experiments. The results are examined with respect to the initial objectives set in the Introduction chapter and are related to the literature and publications review in Chapter Two. A discussion on ap-plicability of the experimental computational simulation environments in a variety of other problems is presented. Relevant conclusions are drawn, accompanied by a list of contributions to the field of Compu-tational Finance and Algorithmic Trading. Finally, a discussion, on what was learned during the course of the case studies, is presented with conclusions on possibilities for further research.
1.5
Contributions
This thesis investigated the experimental Computation Simulation Environments for the study of trading algorithms and their risk. The principal scientific contributions can be considered as follows.
Electronic Markets Simulation - identifies key features, modes of operation and software architecture of an electronic financial exchange for simulated (virtual) trading. It also identifies key exchange simulation models. The models of Electronic Markets are frequently used as part of Computational Simulation Environments either by quantitative developers interested in simulating their trading models or by financial economists interested in modelling e.g., the stability of banking systems. Consequently, an academic study of such simulations is important in future research of this field.
Computational Simulation Environment - design, implementation and testing of a prototype exper-imental Computational Simulation Environment for Computational Finance research, currently supporting the design of trading algorithms and their associated risk. Computational Simulation Environments are at the heart of the Big Data Analytics and consequently are an important topic that will shape the future of Computational Social Science. A goal is to make the experimental Environment available to the academic community.
Portfolio Selection System - defines what is believed to be a unique software system for portfolio se-lection containing a combinatorial framework for discovery of subsets of internally cointegrated time-series of financial securities and a graph-guided search algorithm for combinatorial selection of such time-series subsets.
1.5. Contributions 17
Low-Level AT Classification - the thesis also classifies key AT strategies and their low-level features and presents how such classification can be used in evaluating similarity of trading models (this is an important subject from the point of view of diversification of trading strategies). This knowl-edge is then uniquely incorporated into the Computational Simulation Environment via a software framework supporting event-driven and service-oriented paradigms for building such AT strate-gies.
Key Computational Finance Simulation Types - finally the thesis identifies the key simulation pro-cesses in experimental computational simulation environments, that can be performed on analytic models, including: a free-run, a back-test, a stress-test, a sensitivity-test, an optimisation and a multi-agent versions of the listed simulations.
Chapter 2
BACKGROUND AND LITERATURE
REVIEW
The chapter presents existing background information related to the concept of Computational Simulation Environments for financial experiments, including re-search, technologies, architectural designs and implementation techniques.
The thesis focuses on the experimental Computational Simulation Environments for Computational Fi-nance, specifically on its application to Algorithmic Trading. A variety of separate, however, related work exists both in academia and the industry. To provide sufficient background to the reader, this re-view describes the following subjects: a) Computational Simulations for Finance, b) Components of Computational Simulation Environments, c) Algorithmic Trading, and d) System Architectures for AT.
The description of computational simulations in finance, presents the variety of available techniques and consequently the complexity of algorithms being subjected to simulations. To introduce the reader to the environment within which proposed experimental algorithms may work, a high-level overview of Computational Simulation Environments is provided. The background to algorithmic trading is neces-sary to understand the intended application of this study. Information about the software architecture trends in the AT is required to give the reader a description of possible software technologies applicable to the study. Finally, the description of an infrastructure for financial systems gives an insight on the underlying hardware, software and network infrastructure.
2.1
Computational Simulations for Financial Economics
To effectively conduct a large-scale research in finance and economics, the researchers need access to terabytes/petabytes of real-time and historic data [Cukier and Mayer-Schoenberger, 2013] (e.g., finan-cial, economic, social/news, retail, healthcare, etc.) stored in the large-scale, distributed data banks e.g., Hadoop/MapReduce-like [Abouzeid et al., 2009]. The main components of such an environment are: a)
2.1. Computational Simulations for Financial Economics 19
big databanks; b) real-time streamed data feeds, such as trading data and social media data; c) high-performance computing; d) analytics using data mining, simulation modelling and stream processing; e) computational science using complex systems, computational statistics and machine learning techniques; and f) a user-interface for controlling and visualising the computations, including the programmatic con-trol and machine readable reporting. On the basis of the listed components it is possible to run various types of simulations, either in a historic or live mode.
One of the key original contributions of this thesis to financial economics is a list of possible types of simulations considered from the point of view of experimental computational simulation environments (rather than i.e. statistics) that the author believes is unique and has never been described before. The list was introduced in Chapter 1. However, for completeness, the following set of paragraphs describes again in more detail the most common types of simulations.
Free-Runis a process of simulation on-the-fly, with results being generated on the basis of newly pro-vided input parameters, as soon as they appear. A key property of the free-run process is the fact that the investigated model can not affect the input data and consequently the environment in which it resides (the sandbox effect, a lack of the feedback loop to the environment). This property is the main differentiator between the free-run and the actual execution of the model.
Back-Testis a process of simulation on the basis of historical records of event occurrences. The goal of the process is an observation of a potential behaviour of a model in the past, to eliminate any unexpected and disadvantageous behaviours, and to maximize the impact of advantageous behaviours in the future. Furthermore, the back-test processes are used for a model-tuning and for estimation of model behaviours. Stress-Testwhile the back-test can be considered a walk over the historic ’expected data circumstances’, the stress-test is a process of simulation on the basis of ’abnormal (highly unexpected) data circum-stances’. The goal of such process is to estimate and improve the model’s susceptibility to such data circumstances.
Forward (Monte-Carlo) -Testis a process of simulation on the basis of a synthetic data generated for multiple, alternative, scenarios most commonly with use of a form of a linear drift and an element en-forcing stochastic process. Often the scenarios are generated with parameters for the drift and stochastic process estimated from the historic data to enforce continuity between the history and the potential future scenario. This approach is used to estimate the most probable statistical distribution of future scenarios and consequently the most probable statistical distribution of model behaviours. This approach can also be used to bind the model within the most advantageous thresholds of future scenarios.
Sensitivity-Testis a process of model simulation on the basis of a synthetic data of different time and values granularity that allows estimation of models’ sensitivity characteristics: susceptibility to the min-imal changes in such data granularities. This approach is used to evaluate the most optmin-imal range of the
2.2. Components of Computational Simulation Environments 20
data granularity for the model, as well as the boundaries within which the model exhibits the expected behaviour.
Optimisationis a process of running multiple disconnected simulations with use of the same model but on the basis of different model parameters, with a goal to maximize or minimize an outcome of a simulation measured by the utility function of the model. The key feature of optimisation is a possibility of repetitiveness of an achieved outcome. Given that the free-run, the back-test, the stress-test, the forward-test and the sensitivity-test are all forms of simulation, they can be used as an underlying process for optimisation (with an exception that different goals of an outcome for each type of simulation are expected).
Multi-Agent Simulationall the mentioned types of simulations and optimisation can be performed on a single-agent model or a multi-agent model. Typically, a single-agent model implies that the model itself is the only active element in the simulation that reacts to the stimuli generated by the simulation process. In a multi-agent simulation the model is an aggregate of the active elements being active & reactive to the simulation process and the rest of the active elements in the model.
Given the already large-scale of all investigated environments, this thesis focuses on experiments with the free-run and the back-test simulations, rather than all types of mentioned simulations.
2.2
Components of Computational Simulation Environments
Experimental computational simulation environments, although unique in financial economics, share some characteristics with existing algorithms and systems. For example, such environments need to support the on-the-fly data provision to models; this provides relationship to the existing financial data streaming and market information services. The environments need to also support historic data provi-sion on a large scale, this provides relationship to the existing big data and data warehousing facilities. If a given model processes complex information on-the-fly, the supporting environment will most likely draw from complex event processing engines. All models simulated in the designed environments may be considered analytic models and consequently this provides relationship to various analytic tools & libraries as well as other simulation environments. Finally, particular application of the investigated ex-perimental environments is algorithmic trading, this provides relationship to trading platforms and social media platforms that feed analytic information to trading models. The following literature review aims to familiarize the reader with concepts that may become features of the investigated environments.
Trading Environments are complex, enterprise-size systems that allow their users to trade, by providing the entire supporting infrastructure and manage the variety of risk factors on a micro and macro scale. Financial institutions interested in trading design their systems with respect to the speed of execution, the ability to handle large volumes of data in a rapid manner, and the possibilities of advanced data analytics.
2.2. Components of Computational Simulation Environments 21
Moreover, the physical location of trading and risk models is often chosen to be co-located with trade execution venues, while the location of modelling and simulation functionalities is often co-located with sources of the historical data.
According to [IBM, 2008] the ’high processor performance, ultra-fast communications and very low latency messaging systems are collectively approaching theoretical limits that accelerate the critical systems supporting trade matching. The physical distance is quickly becoming the boundary for any message to travel so new achievements in speed will be more of a commodity rather than game-changing. As the speed attribute becomes a commodity the focus of many execution venues will refocus on their total system capabilities’.
The increase of the amount of derived analytic data goes hand in hand with the growth of the amount of streamed and processed data. All such information needs to typically be handled and processed in real time. To add to the complexity of the problem, the appearance and disappearance of financial instruments from the markets needs to be dynamically accommodated by the trading and risk systems (as a consequence of the fact that the trading advantage is achieved from the data analysis and risk estimation, and not only from the speed). As a consequence, all the mentioned problems force the designers of financial environments to make it highly scalable, with the possibility of deployment and removal of financial instruments (and consequently supported streaming and processing functionalities) in a rapid fashion.
Yet another trend that can be observed in the industry is an architectural shift towards the Service-Oriented Architectures (SOA), e.g., [Erl, 2006] and Event-Driven Architectures (EDA), e.g., [Michelson, 2006]. These approaches significantly reduce the complexity and the cost of integration, and allow virtualization of the entire environments with an increase of the speed of trading through a suitable collocation.
While investigating software architecture trends in IT, a variety of related work concerning financial data and environments was identified both in academia and the industry. They can be grouped into: a) Financial Data Streaming and Market Information Services; b) Analytical Tools and Business Intelli-gence; c) Experimental and Simulation Environments; d) Trading Platforms for Manual and Algorith-mic/Automated Traders; e) Big Data Facilities and Data Warehousing; and f) Complex Event Processing Engines. These are reviewed below.
2.2.1
Financial Data Streaming and Market Information Services
A number of papers survey data sharing services, such as the market information services (e.g., [Shepherd, 1997], [Ainsworth, 2009]), or the messaging systems and the large scale live data stream-ing of financial data (e.g., [Andrade et al., 2009], [Fusco et al., 2010] and [Turaga et al., 2010]).
2.2. Components of Computational Simulation Environments 22
The major academic platforms for financial and economic data are the Wharton Research Data Services (https://wrds-web.wharton.upenn.edu/wrds), which provides web-based, terminal-based and programmatic access to its resources for data mining.
The major commercial platforms for financial data are the Bloomberg (www.bloomberg.com) and the Thomson Reuters (www.thomsonreuters.com) platforms. Both are capable of streaming large quantities of data in either live or historical mode, and both architectures provide big data storage on the server-side and buffering capabilities on the client-side. Apart from the data streaming, both platforms provide basic data analytics on the client-side and charting functionalities for data visualization.
2.2.2
Big Data Facilities and Data Warehousing
The term ’big data’ describes an extremely large, distributed dataset in a scale beyond the capabilities of the commonly used software (e.g., petabytes); while the term ’data warehousing’ describes the dataset used for reporting and analysis. Research on these subjects is covered by [Agrawal et al., 2011] and [Abouzeid et al., 2009].
2.2.3
Complex Event Processing Engines
CEP Engines are capable of processing events organized in an SQL-style type of queries, constructed on the basis of table-like buffers created and maintained in near-real time. CEP technologies can be con-sidered general analytical tools best utilized for the purpose of the on-the-fly monitoring and analytical calculations (see [Barga et al., 2006], [Wu et al., 2006], [Luckham, 2008], [Chandramouli et al., 2010]).
Prominent commercial CEP Engines include: StreamBase (www.streambase.com) and StreamInsight (http://msdn.microsoft.com/en-us/library/ee362541.aspx). Both systems offer SQL-like languages to query events on-the-fly. Open source systems also exist with Esper (http://esper.codehaus.org) being well re-garded.
2.2.4
Analytical Tools and Libraries
Analytical tools are the mainstay of scientific and engineering, spanning statistical libraries, data mining frameworks and machine learning toolkits ([Gangadharan and Swami, 2004], [Khan and Quadri, 2012]).
Well-known general-purpose analytical toolkits are: Matlab (www.mathworks.com), R (www.r-project.org), Mathematica (www.wolfram.com/mathematica), SPSS (www.spss.com) and SAS (www.sas.com). Their de-sign supports access to historical and live sources, and quantitative data manipulations on the processed data. Matlab, R and Mathematica can be considered lower-level platforms, providing rich environments consisting of libraries of application-specific analytical functions where users can code in the platform-specific languages. R and Mathematica focus mainly on historical data analytics, although limited event analytics is also possible. SPSS and SAS can be considered higher-level analytical platforms with a strong support for machine learning and data mining functionalities.
2.2. Components of Computational Simulation Environments 23
Well-known analytical libraries include: the Numeric Algorithms Group (www.nag.co.uk) which pro-vides a variety of numerical libraries, compilers and visualization tools for engineering, scientific and research applications. Likewise, machine learning frameworks, usually available on an open-source basis, include: Mahout (http://mahout.apache.org), Weka (www.cs.waikato.ac.nz/ml/weka) and Encog (www.heatonresearch.com/encog).
2.2.5
Experimental and Simulation Environments
Computing clouds, grids and clusters are often utilized as experimental environments for running simulations, to model data and to calibrate models, especially for large scale financial analytics (see [Bullock, 2011], [Blog, 2012], [Cloudscaling, 2012]). Various commercial environments exist, with the most prominent being Google Cloud Services (www.google.com/enterprise/cloud/index.html), Amazon Web Services (http://aws.amazon.com/) and Microsoft Azure Cloud (www.windowsazure.com/en-us).
All major universities provide experimental environments of these types. For example, UCL currently hosts three research computing facilities: the Legion Cluster, the Unity SMP, and the Condor Pool (www.ucl.ac.uk/isd/common/research-computing/services).
2.2.6
Trading Platforms for Manual and Algorithmic Traders
Trading platforms are systems capable of supporting manual and algorithmic traders. Such systems typi-cally support data provision, visualization and data analytics, and the forwarding of trades to exchanges. More sophisticated trading platforms also support risk management and post-trade analysis, and provide an API for implementation of trading models.
Major banks and hedge funds typically have proprietary trading platforms. There are also vendor plat-forms, such as MetaTrader, TradeStation and X Trader amongst others, and even open source systems e.g., Marketcetera.
The majority of academic research on algorithmic trading is devoted to data analytics and algorithms for forecasting, pricing and risk, etc. Significantly less academic work investigates the trading platforms and the trade-support infrastructure (see [Batten et al., 2012] and [Risca, 2008]).
2.2.7
Social Media Platforms for Sentiment Analysis
Social media platforms are analytic systems designed to aggregate, process and analyse large quantities of publicly available social data including i.e. RSS feeds and web blogs. This types of platforms are capable of supporting analysis of data, data modelling & monitoring as well as model simulation and evaluation. This includes social pattern recognition, data mining and predictive analytics.
Platforms and services for social analytics are being provided by Thompson Reuters (www.thomsonreuters. com), Google (www.google.com/analytics/features/social.html) and SAP (www.sap.com/solutions/solutionextens
2.3. Algorithmic Trading (AT) 24
ions/social-media-analytics/index.epx) amongst other vendors. Various smaller service providers are also available i.e. Lexalytics (www.lexalytics.com/industries/social-media-monitoring), Social-mention* (http://socialmention.com/). The academic and open source communities currently fo-cus their efforts on storage & search facilities for unstructured data (e.g., http://lucene.apache.org/, http://glaros.dtc.umn.edu/gkhome/software,http://uima.apache.org/) and on natural language processing and text analytics (e.g.,http://alias-i.com/lingpipe/,http://gate.ac.uk/,http://nlp.stanford.edu/software/).
Academic research investigates numerous areas of social analytics. While the early research focused on the basic relationships between social features e.g., brand recognition and its relationship with finan-cial performance of companies (i.e. [Yoon et al., 1993]) later research focuses on sentiment detection and analysis (i.e. [Vovsha and Passonneau, 2011]), technologies that support sentiment analysis (i.e. [Chua et al., 2009]), and predictive influence that social data may have, for example, on trading (i.e. [Vincent and Armstrong, 2010]).
To summarize the above section, all the mentioned systems and technologies are capable of providing partial, very limited functionality of computational simulation environment. The experimental computa-tional simulation environment combine the mentioned systems as features of a large-scale environment for algorithmic trading. Such simulation environment is believed to be unique in academia for Financial Economics modelling.
Having the above ’big picture’ in mind, we should now focus on the algorithmic trading requirements related to modelling. This is to help with investigation of the key model types, modes of operation and data flows that the experimental environment should support.
2.3
Algorithmic Trading (AT)
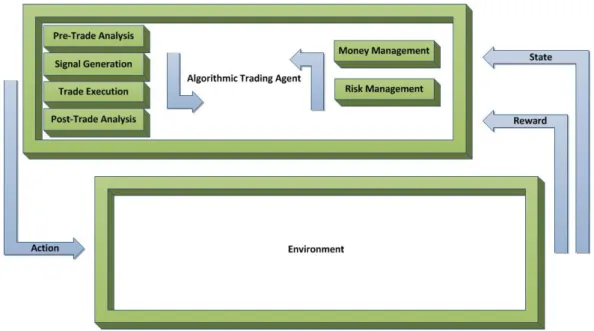
In electronic financial markets, algorithmic trading [Treleaven et al., 2013] is a field of computational finance that combines different analytical techniques, amongst others (from statistics, machine learning, physics and economics) to create algorithms capable of taking, executing and administering investment decisions with optimal levels of profit and risk. AT aims to automate one or more stages of the trading process, where the stages can be defined as: a) pre-trade analysis (data analysis, state of the world analysis); b) signal generation (decision taking process, policy formation); c) trade execution (execution of actions, policy execution) and d) post-trade analysis (evaluation of results, utility analysis). Trade execution [Nuti et al., 2011] is subdivided into two broad categories: agency/broker execution, when a system optimizes the execution of a trade on behalf of a client, and principal/proprietary trading, where an institution is trading on its own account. Historically, AT draws from cybernetics [Ashby, 1956], [Maruyama, 1963] and control systems by introducing one or more feedback loops into the process; typically between post-trade analysis and pre-trade analysis. Two stages that are typically part of such
2.3. Algorithmic Trading (AT) 25
feedback loops are money management (asset allocation) and risk management.
Figure 2.1: Key stages of Algorithmic Trading process.
A typical algorithmic trading process may execute as follows: 1) during the pre-trade analysis stage, the trading model acquires and abstracts the information about the current state of the financial markets and retrieves the most indicative (with respect to a pre-defined utility function) set of features of analysed data, 2) such indicators are then utilised in the signal generation step, where the features are filtered by a set of rules that define circumstances when a trading signal should occur, 3) every time new market information arrives, it is streamed through the pre-trade analysis process and signal generation process, 4) in an instance the signal generation process indicates that tradable opportunities exist in the model, a signal is sent to the trade execution element responsible for generation of a set of instructions to trade particular securities defined in the strategy, 5) to be able to evaluate the utility of the executed transaction, the algorithm performs a post trade analysis.
Apart from the describe stages, the most advanced strategies also utilise the money management and the risk management elements, where: 6) the money management element allocates a specific amount of assets to each transaction with an aim to maximise a utility of the model, 7) while the risk management is responsible for minimising risk of a loss and can also be expressed in a form of a utility function. The Pre-Trade Analysis[Madhavan, 2002] aims to help trading strategies to take the most optimal action at a specific time, given all the available information. Such analysis forms a first step in the creation of trading decisions in a model. It is a process of analysis of input data properties that leads to identification and quantification of a set of data features on the basis of which strategies can take their trading decisions. Such data features can be used to predict the future behaviour of financial instruments (that the algorithmic system is intended to trade), can be used to evaluate the levels of exposure/risk
2.3. Algorithmic Trading (AT) 26
associated with the financial instruments, and can be also used to calculate potential costs associated with trading the financial instruments.
During this phase, the strategy may identify exploitable relationships between various assets (rather than just features of one of the assets alone) on the basis of which it may generate profitable transactions. Identification of co-movement patterns, in securities the strategy trades, can be considered one type of data relationship that can be exploited to generate profit in AT.
The pre-trade analysis is intended to improve indicativeness of the input data in AT. Raw input data is assumed to seldom carry a desired degree of information to support the decision-taking process. To improve the quality of data, the pre-trade analysis stage may be further divided into pre-processing, feature selection, feature extraction and feature cross-validation. The pre-processing stage ensures that the raw data is de-noised, de-trended, normalized etc., before being considered further. The feature selection stage ensures selection of a set of relevant statistical features of the pre-processed data. The feature extraction stage ensures calculation and retrieval of the selected statistical features. Finally, the feature cross-validation stage ensures that only the most indicative features in a set are being used. Given such a list of strong indicators a trading algorithm may start to form patterns out of the selected data features. The formed patterns may then be utilized in signal generation and other decision-taking processes. Formation of trade-exploitable patterns is often based on recognition of co-relations between different features of the input data.
Data Mining is a method of discovery of useful information in data, and is particularly applicable to this building block of an algorithmic trading strategy. Finding non-obvious patterns in datasets is compara-ble to identification of indicative features relevant to trading strategies. The processes used for feature selection and cross-validation are often similar in both fields.
The Signal Generationstage [Chootong and Sornil, 2012] is another building block of algorithmic trad-ing strategy. It is responsible for generation of signals that define the behaviour of a tradtrad-ing model, on the basis of the most indicative features identified during the pre-trade analysis process. Trading strategies can be defined in terms of tasks (actions) they are to perform. Such tasks are constrained by the given information, or more precisely by the sets of features of the given information identified as influential during the pre-trade analysis process. When a given set of constraints is met, it defines a signal for the execution of particular task of the strategy process, e.g., signal for issuing orders or maintaining, closing and rebalancing market positions. Furthermore, the stage may also be responsible for the generation of support signals for e.g., risk management and money management.
There are two approaches to the process of the definition of behaviour of models that drive execution of risk management, money management and trade execution blocks of algorithmic trading strategies, in
2.3. Algorithmic Trading (AT) 27
the next time horizon. These are the static and dynamic approaches. In the static approach, the behaviour of a model is defined once, typically in a form of a set of logic rules with thresholds; where the values of the thresholds can be optimised when the model no longer passes the fitness test of its utility function. In the dynamic approach, the definition of the behaviour of a strategy is defined in a continuous manner during a learning process.
From the perspective of the signal generation stage Artificial Neural Networks and Support Vector Ma-chines are able to model complex, non-linear relationships in data, and therefore are particularly suitable for mapping data inputs (in the form of the most indicative features identified during the pre-trade analy-sis process) to data outputs (in the form of signals that define the trading, the risk and money management behavioural policy). Furthermore, Evolutionary Algorithms are particularly suitable to the process of op-timisation of parameters of static strategies. In case of a dynamic control system the machine learning approaches, i.e. the Reinforcement Learning methodologies are particularly applicable.
The Trade Executionstage [Cesari et al., 2012] can be viewed as a process that defines optimal exe-cution of order instructions and transactions. After the trading signal has been generated, the risk and transaction costs estimated and accepted, and the assets allocated for a specific investment horizon the execution functionality issues a set of order instructions (of a specific type and with required parame-ters), and manages the execution of orders (until successful or unsuccessful completion of transactions). For best execution and to minimize the market impact, advanced trading platforms provide a smart order routing [Foucault and Menkveld, 2008] functionality that allows the division of large instructions into small, more optimal orders.
The Post-Trade Analysisstage [Kissell and Malamut, 2005] is responsible for generation and evalua-tion of results of the trading activity, such as the final execuevalua-tion price, the account profit & loss (P&L) and the remaining margin. The results of such analysis are then fed back to the pre-trade analysis process and can be used to improve the future actions of the strategy.
The Money Management (asset allocation)stage [Tsagaris et al., 2012] is a decision process respon-sible for the division and assignment of available funds. The process can be applied to a portfolio of orders, a portfolio of trading models managing the orders, a portfolio of accounts managing funds of the trading models, a portfolio of institutions managing the accounts etc. Consequently, the process is applicable to multiple levels of the AT abstraction.
The Risk Managementstage ([McNeil et al., 2005], [Clark, 2010], [Berkowitz, 2001]) in some respects is similar to the asset allocation approaches, where multiple levels of risk are identified and the risk fea-tures are monitored to influence behaviour of trading algorithms according to the generated risk signals.
2.3. Algorithmic Trading (AT) 28
2.3.1
AT Classification
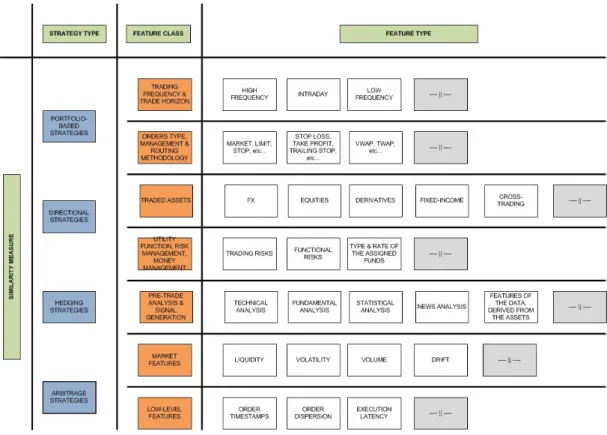
The most natural way of classifying AT [Domowitz, 1993] is on the basis of standard strategy classes and major elements of the strategies. The major classes of strategies that one can differentiate are: a) Arbitrage-based strategies, b) Hedging strategies, c) Directional strategies and d) Portfolio-based strate-gies.
Figure 2.2: Low-level Algorithmic Trading Taxonomy.
The Arbitrage-based strategies:[Ross, 1973] are the class of strategies that attempt to benefit from the difference in the price of simultaneously purchased and sold assets. A variety of possibilities may be explored in this group, such as the classical transactions on the same or similar financial instruments traded on different markets or the statistical arbitrage.
The Hedging strategies:[StuIz, 1984] are a class of strategies that attempts to hedge the risk of a trans-action by purchasing opposite positions in the market. This class of transtrans-actions benefits from the fact that more aggressive and hence riskier strategies can be utilized in trading since the risk of losses is min-imised. It is often possible to mix the hedging and portfolio-based strategy classes (the major difference being the amount of assets traded by a strategy).
The Directional strategies:[Fiorenzani et al., 2012] are a class of strategies based on the assumption of a correct prediction of a market movement. A majority of the breakout, mean-reversal, trend following and statistical prediction strategies falls into this category.
2.3. Algorithmic Trading (AT) 29
The Portfolio-based strategies:that originate from the [Markowitz, 1959] are a class of strategies based on the idea of a diversified portfolio of asset classes with different risk exposure characteristics. The main driving forces of these types of strategies are pricing, risk management, replication, neutralisation and rebalancing.
The above major classes of strategies can also be characterized by a set of features that describe the strategies’ key characteristics, e.g., trading frequency, trading horizon and similar. The trading frequency is a measure of generated trades in a specified period of time, while the trade horizon is the amount of time a particular position was held on the market. If one was aiming at comparing trading strategies, the trading frequency and the trading horizon features would be measured, and, if the obtained results were similar, it could indicate that the strategies may share a similar underlying functionality.
Algorithmic trading strategies can also be classified in terms of the order types they issue, the func-tionalities used to manage the already issued orders, and also the methods employed to route orders. If the compared strategies use similar order sequences, if they manage orders with similar mechanisms and they route orders to brokers using similar policies, then the compared strategies would share similar trading mechanisms.
To enable an algorithmic trading strategy to take successful trading decisions, every strategy needs to be able to handle a variety of asset classes and analytical information derived from the assets the strategy is trading. The comparison of assets that a given strategy trades (and the assets it takes into account during the pre-trade analysis process) gives a strong indication of the similarity of the strategies. An analogy can be made to an analysis of a black box, where we analyse inputs (data feeds) and outputs (orders) of the black box to evaluate how the black box performs.
Advanced algorithmic trading strategies are designed to be able to maximise or minimise some pre-defined utility function. This function can be a simple, single-factor function i.e. maximisation of profit, or it may be defined as a multi factor function (with variety of different features) that needs to be maximised or minimised. Quite often a part of the utility function is related to the risk and money management features of the strategy. An attempt can be made to recognize such general factors and use them in a similarity measure.
The markets have the power to affect the execution of strategies, especially when the trading strategies respond to the market events or try to predict the events. It should be possible to capture some of the features on the basis of which the strategies trade (by monitoring the state of the markets at or around the time of trades).
Finally, a set of low-level strategy features may also help to identify similarities between different strate-gies (the concept of strategy similarity measure is important from the point of view of strategy
diversi-2.4. System Architectures for AT 30
fication). The timestamps, the sizes and the dispersion of orders should confirm/negate the fact that the compared strategies act on the same or similar underlying market patterns. At the same time, a similar execution latency, measured at the same location and the same machine, should at least strengthen the assumption of similarity of the underlying functionalities.
2.4
System Architectures for AT
Algorithmic Trading and risk platforms can be considered three-tier systems, where the first tier consists of external communication elements, the second tier is responsible for internal communication, and finally the third layer provides the actual business logic. Cisco’s Trading Floor [Risca, 2008] presents a good representation of a typical architecture of a trading & risk system.
Figure 2.3: Cisco Trading Floor Architecture [Risca, 2008], where ECN is an acronym for Electronic Communication Network.
2.4.1
External Communication Layer
The bottom layer of the Cisco’s Trading Floor represents a wider, external communication layer and a low-level hardware & network architecture of the trading floor. This also comprises the external sys-tems with which the trading floor exchanges information. The performance of the platform depends on various interrelated factors with the most important one being the speed of the underlying hardware and networks. Consequently, when considering the architecture of this type of financial systems, the emphasis needs to be put on the hardware and connectivity. Apart from the hardware and network, the operating systems on which the platform relies must also be chosen with care. In majority of cases the platform is distributed amongst many servers in a cloud (the operating system on the servers needs to be able to deliver such distributed functionality). When speed is of essence (and in majority of cases it is),
2.4. System Architectures for AT 31
the customization of the underlying hardware, software and network architecture is paramount. One can consider dedicated hardware for specific needs of either a fast execution, storage or multi-processing. Kernels of utilized operating systems can be tailored to specific needs of the underlying hardware as well as the platform. All the unnecessary drivers may be removed, and the kernel may be optimized and recompiled to support a particular need. The network architecture may also be optimized by reor-ganization of its structure, collocation of services with markets and exchanges, and also by utilization of dedicated connection lines. In addition to the architecture and organization of the network, the com-munication protocols also play a major role; they need to be able to transport information - quite often a substantial volume of it - in the quickest possible way, with a guaranteed delivery.
The Cisco’s Trading Floor also defines the external communication layer from the data-streams perspec-tive, and it specifies the ’market data’ stream and the ’trading orders’ stream. The ’market data’ stream [Risca, 2008]”carries pricing information for financial instruments, news, and other value-added infor-mation such as analytics. It is unidirectional and very latency sensitive, typically delivered over UDP multicast. It is measured in updates/sec. and in Mbps. Market data flows from one or multiple exter-nal feeds, coming from market data providers like stock exchanges, data aggregators, and ECNs. Each provider has their own market data format. The data is received by feed handlers, specialized applica-tions which normalize and clean the data and then send it to data consumers, such as pricing engines, algorithmic trading applications, or human traders”. The ’trading orders’ stream [Risca, 2008]”is a type of traffic that carries the actual trades. It is bi-directional and very latency sensitive. It is measured in messages/sec. and Mbps. The orders originate from a buy side or sell side firm and are sent to trading venues like an Exchange or ECN for execution”.
2.4.2
Internal Communication Layer
The middle layer of the Ciscos Trading Floor is a service layer that allows internal communication within the platform. The internal communication is a backbone of every enterprise-size platform. It needs to be reliable and fast, it also needs to be flexible and modular. The internal communication is necessary as a result of the distribution of elements of the platform. A modern approach to development of trading & risk platforms incorporates both the service and event-oriented methodologies.
From the functional point of view, the internal communication layer of an enterprise trading & risk environment can be divided into three types of application components: the components that produce information, the components that consume information and the components that both publish and sub-scribe. Every middleware communication bus provides multiple data streams (queues or memory-less topics) that allow communication of publishers with subscribers. Such data streams ensure that groups of subscribers receive only the relevant information provided by the groups of publishers connected to a particular data stream.
![Figure 2.3: Cisco Trading Floor Architecture [Risca, 2008], where ECN is an acronym for Electronic Communication Network.](https://thumb-us.123doks.com/thumbv2/123dok_us/9845732.2477600/30.892.223.725.419.766/figure-cisco-trading-architecture-acronym-electronic-communication-network.webp)