Huang et al. World Journal of Engineering Research and Technology
INDEPENDENT STUDY: GEOGRAPHIC INFORMATION DATABASE
SYSTEM
1
Anthony Malgapo and 2*Ching-yu Huang 1
Senior student, Department of Computer Science, Kean University, Union, NJ.
2
Assistant Professor, Department of Computer Science, Kean University, Union, NJ.
Article Received on 24/02/2017 Article Revised on 17/03/2017 Article Accepted on 06/04/2017
ABSTRACT
This paper goes over an independent study that focuses primarily on
Geographical Information Database System (GIS) with focus on
backend design and implementation as well as the way of thinking
behind GIS and how it differs from standard Information Systems. The
data type of GIS includes points, lines and polygons geometry data.
These data cannot be stored directly like int, float and text regular data types. Saving and
retrieving the GIS data need additional processes. Later within the paper, ideas are given on
how GIS can be used within programs and applications and then concluded with how
students and teachers can form a class within universities that teaches GIS as an
interdisciplinary course.
INDEX TERMS: Database, GIS, Web server, Polygon.
INTRODUCTION
Information Systems in a wide scope is an excellent course that teaches students the basics of
how data is transferred from front-end applications to back-end applications. The professors
and students alike at Kean University find that this course is essential for the use of databases
within coursework or a pursuit of a career within data systems. As a student who has taken
Information Systems and found success but also more importantly, a passion for management
of databases, this independent study is directed more so on the specific scope of Geographical
Information Systems (GIS). This paper shows it can be taught to other students in a
World Journal of Engineering Research and Technology
WJERT
www.wjert.org
SJIF Impact Factor: 4.326*Corresponding Author
Ching-yu Huang
classroom format. Also, included in the end is what will be done with the rest of the study
and any other information that may help integrating GIS with different projects.
Backend Applications
At first the study began with the idea of an Augmented Reality application built between 3
colleagues using Geographic Information similar to the viral application Pokémon Go. The
work was split into sections between students and this study will specifically be on the
back-end implementation of GIS. Back-back-end design and creation is generally taking the data from
the user and storing it into a database to be used later.
Database Design
The study was tested with actual geographical data and it was decided that photos that had
geodata would be the most effective way to see if the code/data transfer worked. Geodata
includes vital data within photos, mostly .jpeg files that include data such as latitude and
longitude of the photo when it was captured, what direction the camera lens was facing at the
time of capture, and other specific minor data such as aperture, ISO level.
The idea was taking the necessary data that was the latitude, longitude, and direction of the
photo and storing that information so that it could be used on the front-end side within a
Google Maps API page. Therefore the ‘photos’ table within the database needed a schema
that included columns for these data types. The database schema provided gives a view of
what the tables would look like within similar applications of GIS.
The back-end app of course needed the front-end user app to store photos within the database.
One caveat with storing photos is that they are massive amounts of data when added up with
numerous photos simply because of the size as well as the quality of the photo. With this in
mind, a path is used to store the photo within the database rather than the entire size of the
photo itself. In hindsight, this saves an immense amount of space within our server that the
database resides.
Database Implements
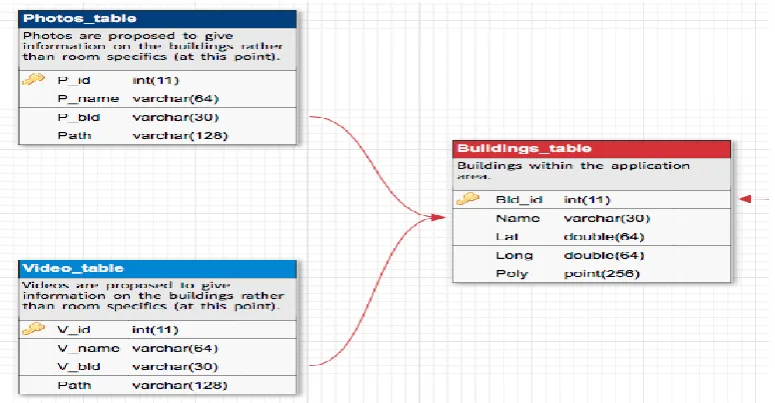
The database photo schema of the application is shown in Figure 1 which collects the
metadata within the image files. Figure 2 shows how binary objects such as photos and
videos saved in the database. The location includes data such as buildings, floors and rooms
Future Endeavors
The next areas to focus on within the independent study would be the addition of other tables
to be used within our application. This requires the study of spatial data and how it is
implemented within a MySQL database. Adding a page that saves geometrical spaces that
represent building or other areas within the Google Map API will be essential to the final
application and how it will work with augmented reality spaces. These spaces are viewed as
polygons on the Google Map and are known to be difficult to both store and retrieve within
the database. Fortunately, the developers’ page for implementing the Google Map API using
JavaScript is a great resource to learn from and will be included within the Teaching Students
section of this paper.
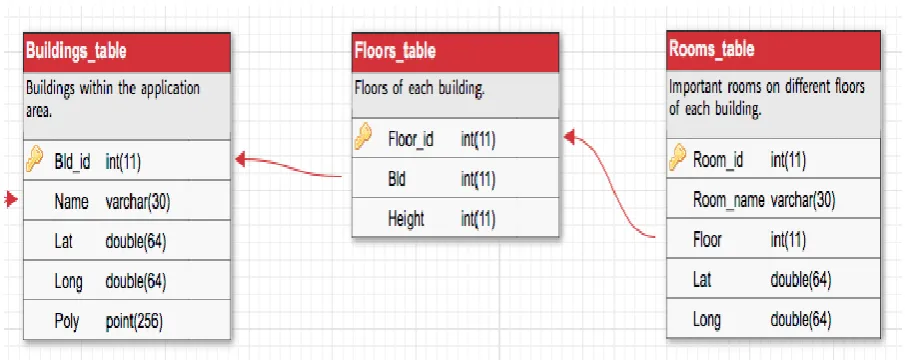
Figure 1: Full GIS database schema for application.
Figure 3: Shows that buildings will be floor specific as well as room specific within the application.
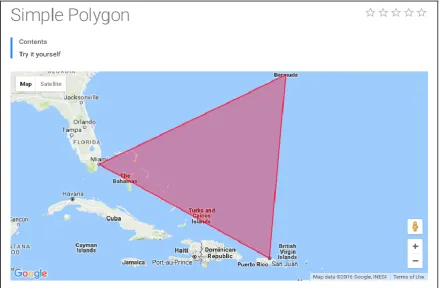
Working with Polygons
Saving polygons to a database requires the coordinates for each point used on the Map. Each
polygon created starts and ends with the same coordinate, therefore all points need to be
saved within a data type of the database. It should also be noted that this will be done with
coordinates saved together and not separately, this should save space within the database. An
application has been developing to achieve the goal. The frontend GUI is for the user to
upload a photo is shown in Figures 4 and 5. Once the geodata is extracted and loaded into the
database, a confirmation will be displayed as shown in Figure 6. With the help of Google
Maps API developer tools as shown in Figure 7, polygons can be used to give users visuals
on the maps for all purposes. Within the application, the user can upload a photo and when
the geodata is taken, it updates the map to show where the photo was taken and in what
direction it was taken as well which is shown in Figure 8. Specifically, this was done properly
using the longitude & latitude coordinates as well as the direction the camera was facing
during the time the photo was taken and placing it onto the map in the form of a marker that
can visualize direction.
Figure 5. Choosing a JPEG photo that has known metadata within.
Figure 6: Showing a message that says that the file has successfully transferred to the database.
Figure 8: Place marker added to the map after geodata was taken from photo.
Working With Z-Coordinates
The plan for the final application is for it to know how to define 3D spaces in real time. This
means that not only will it know latitude and longitude; it will also work with altitude. This
requires a z-coordinate along with x and y that must be defined within the database. There
may be a caveat here where photos and/or videos may not be accurate with their respective
geodata and could skew the augmented reality aspects of the application. An example could
be a photo that was taken on the third floor of a building and acts as a placeholder of one of
the more important rooms within the building but could show up on the application slightly
outside of the room itself in physical space.
Working With Data Files
The final application is also planned to play an integral part for students to see spaces within
the world via augmented reality with the help of photos and videos within the application’s
virtual space. This is very similar to Pokémon Go and their view on the Pokémon characters
within their AR view. The application’s difference will be pointing the phone towards
buildings and seeing photos and videos pop-up during tours to guide the user with
information on the specific areas.
As mentioned before, these videos and photos maybe a huge problem in terms of storage and
memory because of how big the files can be within the database. It is advised to use paths
TEACHING GIS
Since not every school can offer Geographical Information Systems related courses,
especially for Computer Science programs, this paper shows it can be achieved through
independent study.
It is recommended that GIS is a course with a prerequisite of Database Management Systems
and programming skills, this is so students have an idea on database design and
implementation. Having this knowledge will give students an easier transition in learning
terminology such as spatial data and geographical data. It’s also important to define GIS at
first and compare the differences and similarities to DBMS. Just like DBMS, GIS has a wide
scope and takes time to learn every piece of the subject matter. Starting with implementation
of spatial data with hands-on training could be the best way to get students involved with
creating their own databases with geographic properties. More information will come to
fruition within the study on how to guide students in the most effective way possible.
CONCLUSIONS
In conclusion, this study was used with MySQL databases although other database
management systems can be used to implement GIS for students or programmers looking to
either learn or implement to their programs. Recommended skills/knowledge that should be
required before learning about GIS is an introduction to Information Systems before moving
onto geographical database management. Experience with basic Javascript programming is
also recommended for applying frontend applications to test if the backend works (i.e.
database access and input/output).
REFERENCES
1. PHP 5 Tutorial, http://www.w3schools.com/php/
2. MySQL Database, http://www.w3schools.com/php/php_mysql_intro.asp
3. shell_exec — Execute command via shell and return the complete output as a string,
http://php.net/manual/en/function.shell-exec.php.
4. PHP 5 Manual and Documentation – Reference Documentation for PHP programing,
http://php.net/manual/en/intro.spl.php
5. Google Map API – Javascript,

![Crystal structure and Hirshfeld surface analysis of (E) 2,4 di tert butyl 6 [(3 chloro 4 methylphenylimino)methyl]phenol](data:image/gif;base64,R0lGODlhAQABAIAAAP///wAAACH5BAEAAAAALAAAAAABAAEAAAICRAEAOw==)