Computational Efficiency Analysis of Customer Churn Prediction
Using Spark and Caret Random Forest Classifier
Olayemi Olasehinde .1* Olanrewaju Victor Johnson1 Johnson Tunde Fakoya1 1. Department of Computer Science, The Federal Polytechnic, Ile-Oluji, Ondo State, Nigeria
Abstract
Today’s businesses are buying into technological advancement for productivity, profit maximization and better service delivery. Meanwhile technology as also brought about data coming in at an alarming rate in which businesses need to re-strategize how these data are being handled for them to retain ability to turn them to value. Traditional data mining techniques has proofed beyond doubt that data can be harnessed and turn into value for business growth. But the era of large scale data is posing a challenge of computational efficiency to this traditional approach. This paper therefore address this issue by under-studying a big data analytics tool-Spark with a data mining technique Caret. A churn Telecom dataset was used to analyse both the computational and performance metrics of the two approaches using their Random Forest (RF) classifier. The Classifier was trained with same the train set partitioning and tuning parameters. The result shows that Spark-RF is computational efficient with execution time of 50.25 secs compared to Caret-RF of 847.20 secs. Customer churning rate could be minimized if proper management attention and policy is paid to tenure (ShortTenure), Contract, InternetService and PaymentMethod as the variable importance plot and churn rate count mechanism confirm that. The Classifier accuracy was approximately 80% for both implementation.
Keywords: Spark, Caret, Random Forest, Churn, accuracy
1. Introduction
Customers are the most important asset in any organization, they are considered as the main profit source. In an era of mature markets and intensive competitive pressure, organisations and entrepreneurs will not be able to uphold and increase their performance without customers (Buttle, 2004; Gupta and Zeithaml, 2006). It is fundamental for companies to manage relationships with their customers, in order to increase their revenues. In business economics, this concept is known as the "Customer Relationship Management" (CRM), which is a business strategy that aims at ensuring customers' satisfaction.
Customer churn or defection is a widespread phenomenon across a variety of industries. A recent report estimated 20% annual churn rates for credit cards in the US, and 20%- 38% annual churn rate for mobile phone carriers in Europe (Bobbier, 2013). As customer acquisition costs continue to rise, managing customer churn has become critically important for the profitability of companies, the cost of keeping an existing customer is at least 5 times cheaper than the cost of acquisition of a new customer (Aurélie and Sunil, 2013). The problem with focusing solely on customer acquisition is like filling a bucket with a leak.
Customer churn is a fundamental problem for companies and it is defined as the loss of customers because they move out to competitors. Customer churning will likely result in the loss of businesses. Customer churn has been divided into three types (Yang and Chiu, 2006):
Involuntary churn: This occurs when customers fail to pay their bill and as a result, they stop buying product or subscribing to service.
Inevitable churn: This occurs when customers die or migrate resulting in omitting customer from market completely.
Voluntary churn: This occurs when customers prefer to switch to another operator because of more value
Churn prediction has received increasing attention in the marketing and management literature over the past year. In addition, it shows that a small change in the retention rate can result in significant impact on businesses (Van den and Lariviere, 2004).
The ability to predict that a particular customer is at a high risk of churning, while there is still time to do something about it, represents a huge additional potential revenue source for every business, besides the direct loss of revenue that results from a customer abandoning the business, the costs of initially acquiring that customer may not have already been covered by the customer’s spending to date.
In order to succeed at retaining customers who would otherwise abandon the business, companies must be able to;
i. predict in advance which customers are going to churn through churn analysis and
ii. know which marketing actions will have the greatest retention impact on each particular customer. Churn prediction modelling techniques attempt to understand the precise customer behaviours and attributes which signal the risk and timing of customer churn. The accuracy of the technique used is obviously critical to the success of any proactive retention efforts. After all, if the marketer is unaware of a customer about to churn,
no action will be taken for such customer. Predicting and preventing customer churn represents a huge additional potential revenue source for every business.
Today’s businesses are experiencing a sporadic growth in terms of data (companies’ data both transaction and customer-based reaching Zetabytes-250 of data) being generated within a defined and constrained timeframe and the need to turn this large data into opportunities for the businesses. This growth is largely due to more ICT-awareness of the teaming population called-customers around the world in which Nigeria is not an exception. Sustaining this growth, with its intending benefits while rendering effective services, requires businesses to re-strategize. Traditional data mining techniques have delivered immerse result by turning data into gold-mine, customer analysis not being left out, but it is being faced with the challenge of computational efficiency in today’s era of big data. Therefore, Businesses re-strategizing, while still maintaining good customer relationship policy, requires the application of Big Data Analytics.
This challenge thus becomes a leverage point for Big Analytics to thrive by achieving computational efficiency as well as maintaining robust predictive task. Many Big Data platforms exist today with major driving force from Hadoop, Spark, H2O, Oracle BigData, etc.
This paper, therefore, provides both intuitive computational and predictive comparison between a Big Data Analytics tool - Spark and a traditional classification algorithm using a Churn Telecom dataset while focusing on voluntary churn retention analysis.
2. Literature Review
Wouter et al (2011) proposed the application of Ant-Miner+ and ALBA algorithms on a publicly available churn prediction dataset in order to build accurate as well as comprehensible classification rule-sets churn prediction models. Ant-Miner+ is a high performing data mining method based on the principles of Ant Colony Optimization which allows to include domain knowledge by imposing monotonicity constraints on the final rule-set. The advantages of Ant-Miner+ are high accuracy, comprehensibility of the generated models and the possibility to demand intuitive predictive models. Active Learning Based Approach (ALBA) for SVM rule extraction is a rule extraction algorithm, which combines the high predictive accuracy of a non-linear support vector machine model with the comprehensibility of the rule set format.
Previous works about predicting churn in telecommunication networks use graph processing techniques (Chakraborty et al., 2012). They identified already churned customers and analysed a graph model to infer interactions with the current customers with the aim of predicting new churners based on these interactions. Others predict customer churn by analysing the interactions between the customer and the Customer Relationship Management (CRM) data Eilam et al. (2013).
Benlan et al. (2014) suggested a customer churn prediction methodology based on SVM model, and used random sampling method to improve SVM model by considering the imbalance characteristics of customer data sets. A support vector machine constructs a hyper-plane in a high or infinite dimensional space, which can be used for classification. Random sampling method can be used to change the distribution of data in order to reduce the imbalance of the dataset. Imbalance in dataset is caused due to the low proportion of churners.
Ning et al. (2014) performed an experimental investigation of customer churn prediction in telecom industry and proposed the use of boosting to improve the customer churn prediction model. The author suggested to separate customers into two clusters based on the weight assigned by the boosting algorithm. The proposed model provides an opportunity to an “Implementation Zone” where customers with the highest churn propensity can be addressed for retention actions.
Pendharkar (2009) suggested two Genetic Algorithm (GA) based neural network (NN) models to predict the customer churn. The first GA-based NN model used a cross entropy based criteria to predict customer churn, and the second GA based NN model made some efforts to directly increase the prediction accuracy of customer churn. Using real-world customer dataset and three various sizes of NNs, they compared the two GA-based NN models with a statistical Z-score model using model evaluation criterion like prediction accuracy, top 10% docile lift and area under Receiver Operating Characteristics (ROC) curve. The results of experiments indicated that both GA-based NN models outperform the statistical Z-score model on all performance criteria.
Lee et al. (2011) focused on building an accurate and succinct predictive model with the purpose of churn prediction by using a Partial Least Squares (PLS) based method on highly correlated data sets among variables. They not only present a prediction model to accurately predict customers churning behaviour, but also a simple but implementable churn marketing program was employed. The proposed methodology allows the marketing managers to maintain an optimal (at least a near optimal) level of churners effectively and efficiently through the marketing programs. Here, PLS is employed as the prediction modelling method. Allahyari et al. (2012) applied clustering techniques to evaluate factors affecting customer churn of insurance companies. The results indicated that educated people leave the company mostly because of employees’ attitude while Merchants leave it because of company’s reputation.
that the most significant factor in banks’ customer churn is entering the wrong password several times.
In determining significant factors affecting customer churn and retention in South Korean mobile telecommunications service market, Bingquan et al. (2012) applied seven data mining methods in order to evaluate customer churn in the mobile phone market. The results indicated that these methods are more reliable than traditional methods in predicting customer churn.
The work of Chen et al. (2011) is based on the use of SAS Enterprise Miner to design a predictive model for churn management, providing the foundation for predicting the data of customer churn and reduce the number of churns. Shan et al. (2012) emphasizes on a predictive model to find out possible churners and provide personalized services.
3. Churn Retention Analysis
Churn predictions is a classification predictive task, which model prediction problems and to make forecasts. In particular, the classification assumes that the event we want to predict is represented by a finite and discrete domain of possible outcome values (i.e. classes). It is define as follows:
Given a dataset of N records, where each ∈ T consists of m attributes with domains (i.e. t(Aj ) ∈ Dj ∀j = 1...m), and a class attribute C, such that ti(C) ∈ Γ (the nite and discrete domain of classes), the classification task is to build a function f : → Γ, which is called classification model or classifier.
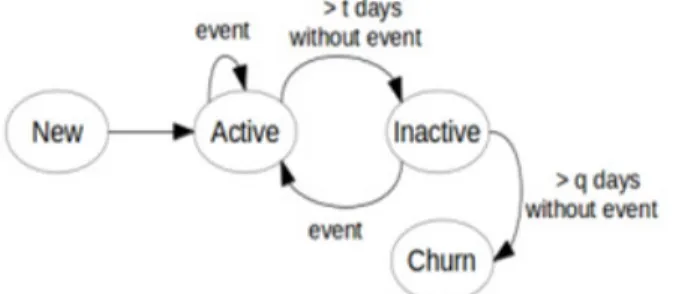
Customer churn prediction is a supervised classification problem where the behaviour of previously known churners and non-churners are used to train a binary classifier. During the prediction phase new users are introduced in the model and the likelihood of becoming a churner is obtained. Depending on the balance replenishment events, each customer can be in one of the following states: (i) new, (ii) active, (iii) inactive or (iv) churn (see Figure 1). Customer churn is always preceded by an inactive. This future inactive state threshold as a proxy can be used to predict churn.
The focus of every company is to retain customer and avoid customer churn. Blattberg et al. (2001) state that customer retention is taking place when a customer keeps on buying the same market offering over a long period of time. Payne (2000) defines customer retention rate as ‘the percentage of customers at the beginning of the period who still remain customers at the end of the period. Measuring the customer retention rate is seen as the initial step in improving loyalty to, and the profitability of, a service organization (Payne, 2000a), yet many organizations do not understand the importance of improving customer retention rates, and the impact of these on profitability (Clark, 1997).
Customer churn happens due to product not addressing the user’s needs, slow customer support, product cyclicality, periodic usage, wrong channel strategy, pricing and economic conditions. Saturated markets and high levels of competition within industries have necessitated the practice of customer retention strategies (the probability that a customer will not leave) among firms (Honts and Hanson, 2011). Companies which that apply CRM to their business will greatly improve their customer retention capability.
Companies can increase their profits by 25 to 95 percent with a mere increase of 5 percent in customer retention rates. Thus, it is wise to conclude that a small increase in customer retention rate will further accelerate firm’s profits (Ryals & Knox, 2005). According to Gartner Group 80% of your company’s future revenue will come from just 20% of your existing customers.
4. Proposed Framework: Spark and Caret
4.1 Spark Architecture
Spark (Apache Software Foundation) as the most active open-source project in big data world, leading over Hadoop is gaining quantum momentum in Machine Learning and dramatically help businesses to fast-track turning data into value. Spark is an in-memory cluster computing framework for processing large dataset much similar to Hadoop MapReduce mechanism. It provides simple yet a robust programming interface for deploying computing hardware resources in such way that scale up big data processing with seamless effort. Key features include: (i) Ease of usage, (ii) Fast, (iii) General-purpose (iv) Scalable and (v) Fault tolerant.
Spark comes pre-packaged with an integrated set of libraries for graph computing (GraphX), machine learning (MLlib), stream processing, batch processing interactive analysis and much more easily co-exist with languages such as Scala, Python, R and Native Java. Spark can easily be deployed on a single machine as a standalone, Mesos and YARN configured. It can also be deployed on a full-fledge cluster machine to maximize its potentials. The flexibility of Spark is extensive in that it is robustly easy to work with existing Hadoop infrastructure such as Hadoop MapReduce, Hive, Pig, Impala, HDFS, Hadoop Catalog and host of others. Figure 2 explains the high-level architecture exhibited by Spark. The architecture consists five key entities namely: a driver program, a cluster manager, workers, executors and tasks. Basic Spark architectural features are:-
i. Workers: Spark application is provided with CPU, memory, and storage utilities. The workers run a Spark application as distributed processes on a cluster of nodes.
ii. Cluster Managers: This feature provides acquisition of cluster resources to Spark for executing jobs. Spark is deployable as standalone, Mesos and YARN.
iii. Driver Programs: A driver program is an application that uses Spark as a library. It provides the data processing code that Spark executes on the worker nodes. A driver program can launch one or more jobs on a Spark cluster.
iv. Executors: A JVM (Java virtual machine) is the executor that Spark uses to create process on each worker for an application. It executes application code concurrently in multiple threads. It can also cache data in memory or disk (in-memory: a powerful mechanism that gave Spark notch ahead others). v. Tasks: The atomic unit of work that an executor receives from the Spark. It is executed by a thread in an
executor on a worker node.
4.2 Caret Architecture
Caret (Classification And REgression Training) is a package built under R language. It is a really nice wrapper function for a variety of machine learning models, including random forests. It makes model tuning smooth and parallel processing a breeze. It was necessitated by the need to build a platform that allow many machine learning algorithms to be tuned and deployed with the same template or uniform interface. It was developed by Max Kuhn (2008).
4.3 Random Forest Model
Random Forest, the work of Breiman (2001), is one of the best known classification machine learning algorithms with ability to work with large dataset. The process of learning is described as follows: To minimize model variance, random forests use n bootstrapped samples for ntrees, and use a random sample of the predictors to fit each decision tree. Then the first couple of splits for every tree is not the same couple of very important predictors, resulting in similar, highly correlated trees across the forest. Averaging across highly correlated trees is not as effective at reducing variance as averaging across less correlated trees, hence the use of random sampling of predictors for each tree.
5. Dataset
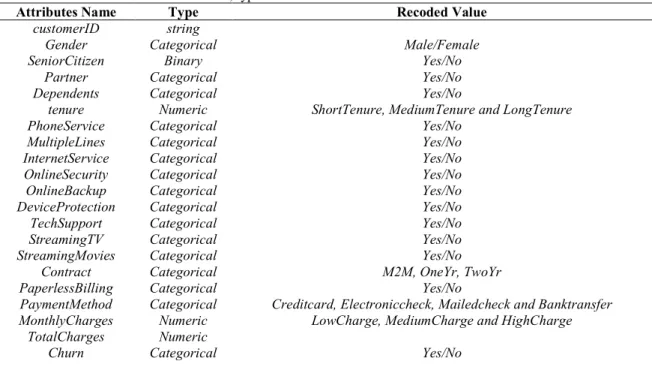
The churn Telecom dataset was employed in this work. It consists of Twenty-One (21) attributes including the target class “Churn” and 7043 instances. Although the dataset is not a large dataset, the reason is to enable the traditional algorithm implemented to be able to cope with the dataset for analysis knowing fully well that big data tools like Spark can scale up any size of a dataset. A recoding technique was carried-out to transform the dataset appropriately in order to succinctly fit into the model adopted for the work. The list of the attributes showing the transformation is as shown in Table 1 below. The dataset was randomly split into training and test sets on probability of 0.85 to 0.15 respectively and a pre-conversion of Churn attributes from character column to numeric before loading it unto Spark platform.
CustomerID and TotalCharges attributes were removed during the reprocessing stage while the tenure and MonthlyCharges were discretised using quartile-based technique as shown in Table 2 and 3 respectively.
6. Result and Discussion
The adopted Random Forest classifier from CARET package and ML-Spark was implemented on HP ProBook 6460b core i5 2520M, 2.50GHz with 16 GB RAM running 64-bit R(R Core Team, 2017) and Apache Spark 2.1.0 with the same dataset partitioning and tuning parameters.
6.1 Retention Rate
Meanwhile, a retention rate based on churn rate count mechanism with the result presented using visualization approach was first carried-out. Figure 3 shows the result with tenure-ShortTenure as the most critical attribute for churn rate to be on the high side, while Contract-TwoYr as most critical attribute for churn rate to be less. Further analysis was carried-out to validate this result later in this section.
6.2 Computational Efficiency
Training the implemented algorithm-Random Forest under same train set and parameters, the following results were obtained for both caret and Spark implementation as depicted in Table 4.
Figure 4 from SparkUI further validates the correctness of execution time as obtained from Sparklyr R interfacing Apache Spark. The actual execution time from SparkUI is 46 secs. The time difference experienced is due to communication time between R and Spark environments. It therefore, shows that with large data running to millions of records, it will be practically time expensive for traditional implementation of predictive
algorithms that is even if the data can be loaded or read. Spark, thus proved to be computationally efficient and preferred with large dataset.
6.3 Confusion Matrix, Accuracy and Precision
The accuracy and precision are obtained from the Confusion Matrix of the trained model before or after the model is applied on the test set. Confusion Matrix comprises the following features: True Positive (TP), False Positive, True Negative and False Negative for obtaining the performances metric of the algorithm implemented. We presented in Table 5 the performance results of RF on both platforms.
6.4 Variable Importance
The variable importance is the measured of attributes relevance to the predictive task under processing. The variable importance shows the degree at which each attributes affect the training of the model, thereby deducing which attributes are more important and which ones less significant. Figure 5 and Table 6 provide with the importance variable measure of caret-random forest and Spark-random forest outputs.
The plot reveals that Contract, tenure, PaymentMethod and InternetService are the most critical variable for churn prediction while on the other hand tenure:ShortTenure, InternetService: Fiberoptic, Contract: TwoYr and PayementMethod: Electroniccheck are the most important variables generated from the Spark-Random Forest classifier as shown in Table 5.
We finally deduce that churn rate can be best minimized if proper management attention and policy is paid to tenure (ShortTenure), as the variable importance result in Table 5 validates our early churn rate count approach (see Figure 3) and others like Contract, InternetService and PaymentMethod.
7. Conclusion
As the focus of every company is being paid to advancement in technology for better service delivery in order to retain customer and avoid customer churn, the demand to manage customer data is the challenge companies need to overcome. Turning large scale dataset into profitable value for organizational growth within a limited time-frame has therefore becomes the priority of big data tools in today’s analytical world, Spark not in exception. This paper has shown considerably the computational efficiency demonstrated by Spark Technology in minimizing time while still maintaining outstanding performance metric measure for machine learning algorithms.
Developed countries around the world are incorporating these synergy to gain attendance in customer relationship. Developing nations like ours must therefore embrace such by providing a platform in businesses data are seamlessly captured and turn to value.
Further work is encouraged by using algorithms that are capable of generating rules that could be application in designing a full-fledged integrated system for customer churning prediction.
8. References
Allahyari Soeini, R., & Vahidy Rodpysh, k. (2012) Applying Data Mining to Insurance Customer Churn Management, IACSIT Hong Kong Conferences.
Apache Software Foundation: Spark, https://spark.apache.org/
Aurélie L. & Sunil G. (2013) Managing churn to maximize profits, 2013. Harvard Business School
Benlan H., Yong S., Qian W., Xi Z. (2014) Prediction of customer attrition of commercial banks based on SVM model, Proceedings of 2nd International Conference on Information Technology and Quantitative Management (ITQM), Procedia Computer Science 31 ( 2014 ) 423 – 430.
Bingquan, H., Kechadi, M.T and Buckley, B. (2012) Customer churn prediction in telecommunications, Expert Systems with Applications, 39, 1414–1425.
Blattberg R.C, Getz G, and Thomas J.S (2001). Customer Equity: Building and Managing Relationships as Valuable Assets. Boston, Massachusetts: Harvard Business School Press.
Bobbier, T. (2013) Keeping the Customer Satisfied: The Dynamics of Customer Defection, and the Changing Role of the Loss Adjuster,” CILA Report, http://www.cila.co.uk/publication/articles/keeping-customer-satisfied-tony-boobier, accessed July 2017
Breiman, L. (2001). Random Forestss. Statistics Department University of California, Berkeley.
Buttle, F. (2004) Customer Relationship Management: Concepts and Tools. Elsevier Butterworth-Heinemann, Oxford.
Chakraborty D., Singh B., and Dasgupta R. (2012) Method for Predicting Churners in a Telecommunications Network. US Patent 8194830 B2.
Chang, D., Wang, Y., Lee, S., and Lin, C. (2003) Goal Oriented Sequential Pattern for Network Banking Churn Analysis. Expert Systems with Application, 25(3), 293-302.
Company, Proceeding of IEEE Fourth International Conference on Business intelligence and Financial Engineering.
Clark M (1997) Modelling The Impact of Customer-Employee Relationships on Customer Retention Rates in a Major UK Retail Bank. Management Decision, 35(4): 293-301.
Eilam, B., Lubowich Y., and Lam. H. (2013) Method and Apparatus for Predicting Customer Churn.US Patent 8615419 B2
Gupta, S. and Zeithaml, V. (2006). Customer Metrics and Their Impact on Financial Performance. Marketing Science, 25(6): 718–739
Honts, R. and Hanson, J. (2011). Maximizing Customer Retention a Strategic Approach to Effective Churn Management. Accenture White Paper. PUBLISHER
Kuhn, M. (2008). Caret package. Journal of Statistical Software, 28(5)
Lee, H. Lee, Y., Cho, H., Im, K., and Kim, Y. S. (2011) Mining Churning Behaviours and Developing Retention Strategies Based on a Partial Least Squares (PLS) Model”, Decision Support System 52 (2011) 207–216.
Mohammed Guller (2015), Big Data Analytics with Spark- A practitioner’s Guide to Using Spark for Large Scale Data Analysis, Apress Publisher, pp 51-55, ISBN-13 (electronic): 978-1-4842-0964-6.
Ning L., Hua L., Jie L., and Guangquan Z. (2014) A Customer Churn Prediction Model in Telecom Industry Using Boosting, IEEE Trans. Ind. Inform. 10 (2014) 1659– 1665.
R Core Team (2017). R: A language and environment for statistical computing. R Foundation for Statistical Computing, Vienna, Austria. URL https://www.R-project.org/
Ryals, L.J. and Knox, S. (2005). Measuring Risk-Adjusted Customer Lifetime Value and Its Impact on Relationship Marketing Strategies and Shareholder Value. European Journal of Marketing. 39 (5/6): 456-472.
Payne A. (2000) Relationship Marketing: Managing Multiple Markets. (In Cranfield School of Management. (ed.), Houndmills: Macmillan Press, pp. 16-30.
Payne A. (2000a) Customer Retention. (In Cranfield School of Management. (ed.). Marketing management: a Relationship Marketing Perspective. Houndmills: Macmillan Press, pp. 110-122.)
Pendharkar, P. C. (2009) Genetic Algorithm Based Neural Network Approaches for Predicting Churn in Cellular Wireless Network Services, Expert System Application 36 (2009) 6714–6720.Wouter
Shan, J,Y. Meng, C. Fan,F. and Peng, Q. (2012) The Research on Applying Data Mining to Telecom Churn Management, Proc. of 2nd International Conference on Materials, Mechatronics and Automation, 2012, Vol. 15, 2012, pp.39-45.
Van den, P.D, and Lariviere, B. (2004) Customer Attrition Analysis for Financial Services Using Proportional Hazard Models. Eur J Oper Res 2004; 157(1): 196-217.
Verbeke, D. M., Christophe, M., and Bart, B. (2011) Building Comprehensible Customer Churn Prediction Models with Advanced Rule Induction Techniques”, Expert Systems with Applications 38 (2011) 2354– 2364.
Yang, L. S. and Chiu, C. (2006). Knowledge Discovery on Customer Churn Prediction, Proceeding of the 10th WSEAS international conference on applied mathematics, Dallas, texas, USA.
Appendix
Figure 1. Possible customer states based on the balance replenishment events and specific thresholds t and q (Adapted from “Using Deep learning to Predict Customer Churn in Mobile Telecommunication Network)
Figure 2. Spark Architecture, (source: Big Data Analytics with Spark- A practitioner’s Guide to Using Spark for Large Scale Data Analysis by Mohammed Guller, 2015)
Table 1. List of churn Dataset attributes, type and recoded value
Attributes Name Type Recoded Value
customerID string
Gender Categorical Male/Female
SeniorCitizen Binary Yes/No
Partner Categorical Yes/No
Dependents Categorical Yes/No
tenure Numeric ShortTenure, MediumTenure and LongTenure
PhoneService Categorical Yes/No
MultipleLines Categorical Yes/No
InternetService Categorical Yes/No
OnlineSecurity Categorical Yes/No
OnlineBackup Categorical Yes/No
DeviceProtection Categorical Yes/No
TechSupport Categorical Yes/No
StreamingTV Categorical Yes/No
StreamingMovies Categorical Yes/No
Contract Categorical M2M, OneYr, TwoYr
PaperlessBilling Categorical Yes/No
PaymentMethod Categorical Creditcard, Electroniccheck, Mailedcheck and Banktransfer MonthlyCharges Numeric LowCharge, MediumCharge and HighCharge
TotalCharges Numeric
Churn Categorical Yes/No
Table 2. Tenure attribute discretization
Min. 1st Qu. Median Mean 3rd Qu Max.
0.00 9.00 29.00 32.37 55.00 72.00
1-9 ShortTenure 9-29 MediumTenure 29-72 LongTenure
Table 3.0: MonthlyCharges attribute discretization
Min. 1st Qu. Median Mean 3rd Qu Max.
18.25 35.00 70.35 64.76 89.85 118.75
Figure 3. Customer Retention Rate Analysis graph
Table 4. Computational Comparison of Caret and Apache Spark Random Forest Classifier
Platform in R Algorithm Number of Trees Maximum Depth Execution Time
Caret Random Forest 500 10 847.20 secs
Apache Spark Random Forest 500 10 50.25 secs
Table 5. Performance Metric of Spark and Caret Random Forest Classifier
Platform in R Algorithm Accuracy Precision
Caret Random Forest 0.7982018 0.9115646
Apache Spark Random Forest 0.7934272 0.7825538
Table 6. Variable Importance from Spark-Random Forest Classifier
S/N Feature Importance S/N Feature Importance
1 tenure_ShortTenure 0.153588 13 Partner_Yes 0.025625 2 InternetService_Fiberoptic 0.107440 14 StreamingMovies_Yes 0.025357 3 Contract_TwoYr 0.090611 15 gender_Male 0.024868 4 PaymentMethod_Electroniccheck 0.089549 16 MultipleLines_Yes 0.023550 5 Contract_OneYr 0.057182 17 Dependents_Yes 0.023323 6 OnlineSecurity_Yes 0.043848 18 DeviceProtection_Yes 0.022774 7 TechSupport_Yes 0.042271 19 StreamingTV_Yes 0.022530 8 InternetService_No 0.040459 20 MonthlyCharges_LowCharge 0.022163 9 PaperlessBilling_Yes 0.034348 21 MonthlyCharges_MediumCharge 0.018254 10 tenure_MediumTenure 0.031125 22 PhoneService_Yes 0.015953 11 OnlineBackup_Yes 0.028858 23 PaymentMethod_Mailedcheck 0.015601 12 SeniorCitizen_Yes 0.026410 24 PaymentMethod_Creditcard 0.014311