A University of Sussex
PhD
thesis
Available
online
via
Sussex
Research
Online:
http://sro.sussex.ac.uk/
This
thesis
is
protected
by
copyright
which
belongs
to
the
author.
This
thesis
cannot
be
reproduced
or
quoted
extensively
from
without
first
obtaining
permission
in
writing
from
the
Author
The
content
must
not
be
changed
in
any
way
or
sold
commercially
in
any
format
or
medium
without
the
formal
permission
of
the
Author
When
referring
to
this
work,
full
bibliographic
details
including
the
author,
title,
awarding
institution
and
date
of
the
thesis
must
be
given
T O P I C A L S U B C AT E G O R Y S T R U C T U R E I N T E X T C L A S S I F I C AT I O N
r i s t o m at t i j u h a n i ly r a
submitted for the degree of Doctor of Philosophy Department of Informatics
School of Engineering and Informatics University of Sussex
D E C L A R AT I O N
I hereby declare that this thesis has not been and will not be, submitted in whole or in part to another University for the award of any other degree.
Brighton, United Kingdom, January2018
you don’t stop when you’re tired you stop when the gorilla is tired.
— Fausto Coppi
In memory of my godfather Matti Lamminen. 1958–2017
A B S T R A C T
Data sets with rich topical structure are common in many real world text classification tasks. A single data set often contains a wide variety of topics and, in a typical task, documents belonging to each class are dispersed across many of the topics. Often, a complex relationship exists between the topic a document discusses and the class label: positive or negative sentiment is expressed in documents from many different topics, but knowing the topic does not necessarily help in determining the sentiment label. We know from tasks such as Domain Adaptation that sentiment is expressed in different ways under different topics. Topical context can in some cases even reverse the sentiment polarity of words: to be sharp is a good quality for knives but bad for singers. This property can be found in many different document classification tasks.
Standard document classification algorithms do not account for or take advantage of topical diversity; instead, classifiers are usually trained with the tacit assumption that topical diversity does not play a role. This thesis is focused on the interplay between the topical structure of corpora, how the target labels in a classification task distribute over the topics and how the topical structure can be utilised in building ensemble models for text classification. We show empirically that a dataset with rich topical structure can be problematic for single classifiers, and we develop two novel ensemble models to address the issues. We focus on two document classification tasks: document level sentiment analysis of product reviews and hierarchical categorisation of news text. For each task we develop a novel ensemble method that utilises topic models to address the shortcomings of traditional text classification algorithms.
Our contribution is in showing empirically that the class association of document features is topic dependent. We show that using the topical context of documents for building ensembles is beneficial for some tasks, and present two new ensemble models for document classification. We also provide a fresh viewpoint for reasoning about the relationship of class labels, topical categories and document features.
I want to thank my Professor, David Weir, for giving me the opportunity to do a PhD. Thank you for your time and support in iterating through one failed experiment and unworkable idea after another, for having the patience to comment on badly structured drafts and for setting an example on what to aim for. Thank you for maintaining good spirits in the lab, for hosting Christmas and Summer parties and fostering a productive environment.
Thank you Jeremy Reffin, first of all, for convincing David that setting up TAG lab was worthwhile. I doubt I would be submitting anything without your input and (con-structive) criticism. I’ve never once shown you results without you finding a critical flaw in my thinking, an insight in the results I hadn’t considered or an altogether new per-spective to the thesis. Thank you for the Christmas parties, for hosting Sara and me and for looking after the new recruits, myself included.
Luc Berthouze for supporting me throughout my bachelor’s degree and for giving me the opportunity to be a Junior Research Associate, I would not have done a PhD without my involvement in a research project during my Bachelor’s degree.
Thank you to Jussi Sarkola and Pentti Halonen for your early involvement in my education. I finally figured out what all that linear algebra can be applied to.
My thesis relies on software that was written by other people and made available at no cost (to me). I owe a great deal to the creators and maintainers of open source libraries especially in the Python community. Thank you to Travis Oliphant for creating NumPy, Travis Oliphant (again), Eric Jones, and Pearu Peterson for SciPy, John Hunter for mat-plotlib, Fernando Pérez for iPython, Wes McKinney for pandas, Radim ˇReh ˚uˇrek and Lev Konstantinovskiy for gensim and Olivier Grisel, Matthieu Blondel, Gilles Louppe, Andreas Müller, Jake VanderPlas, Gael Varoquaux and other core developers of scikit-learn, and of course to the BDFL himself. Thank you also to anyone who has worked on Project Jupyter and to all the people who have contributed code, documentation, bug reports or ideas to the open source projects. Your work in creating open source tools
for scientific computing has allowed me to focus on experimentation and data analysis instead of writing software. Thank you to NumFOCUS and PyData for supporting open source software for scientific computing.
My time at Sussex was significantly (p = 1−15, 1-tailed t-test) longer than the three year Bachelor’s degree initially intended. I would not have made it through all the set backs, bugs, failed experiments and wrong results without my friends and colleagues by my side. It would have also been lonely and somewhat pointless to celebrate the successful experiments on my own. Thank you to Miro, Sasho, Thomas, Phil, George, Jack, Stana, F. Slorian, Ben, Novi, Viktorija, Emma, Roland, David, David (you know who you are) and Sam – for listening to me, for providing advice when it was needed but not requested, for dragging me out of the office every once in a while and for generally keeping me sane for the past six years. Thank you especially to Sasho and Miro for making me drive across the continent (three times), the holiday was always needed and much appreciated. Thank you to Ben, Miro and F. Slorian for the bike rides. Thank you George for providing me somewhere to stay overnight, for the beer, food and arguments about politics, data structures, networks and everything else. Thank you Thomas and Phil for hosting me and Thomas especially for providing access to his apartment on occasion.
The PyData community specifically in Berlin and generally across the world has been very important for sharing knowledge about experimental methodologies, software best practices but also for the community spirit. I want to thank Katharine Jarmul for her support, encouragement and guidance and for always being the one to put a positive spin on things. Noa, Chris, Adi, Elad, David, Sylvain, Matteo and Adrin for listening to my concerns and for pushing me forwards when I did not have the strength to do so myself. Most of all, thank you for giving me something else to think about when the thesis got to be too much.
The support of my family has been crucial throughout my life, thank you for all the times you bit your lip and did not ask "how’s the PhD going?", I’ll overlook all the times you didn’t. Thank you to my grandmother, Maiju, for being interested in what I do and for asking lots of questions, explaining my thesis to you has helped clarify my own thoughts. Thank you to my mother, Tuula, for never giving up on me and for always asking when the next graduation date is. Thank you to my Sister, Anu, for always being
put into raising us. Thank you to my sister, Sanna, for looking after me.
Thank you to my in-laws, Regina and Werner, for all their support and encourage-ment.
Finally, I want to thank my wife, Sara, for all of the above and below. Thank you for coming along for the ride, for the mental, financial, physical and meta-physical support, for believing in me when I did not and for bringing back down to earth when I got ahead of myself. Thank you for not letting me quit and for sharing the successes as well as the failures. Thank you for your patience and understanding during the three years that turned into four that turned into six, thank you for never quitting on me. Your unconditional, unwavering support for yet another great idea of mine is the reason this document exists.
C O N T E N T S
i i n t r o d u c t i o n 1
1 i n t r o d u c t i o n 2
2 r e l at e d w o r k 7
2.1 Sentiment Classification . . . 8
2.1.1 Sentiment Mining and Summarisation . . . 10
2.1.2 Fine-Grained Sentiment Analysis and Encoding Lexical Polarity . 12 2.1.3 Domain Aware Sentiment Classification and Out-of-domain Data 14 2.1.4 Subjective Language . . . 17
2.2 Algorithms for Document Classification . . . 19
2.2.1 Statistical Document Classification . . . 19
2.2.1.1 Feature Extraction . . . 20
2.2.1.2 Feature Selection and Dimensionality Reduction . . . 21
2.3 Classification Models . . . 23
2.3.1 Decision Trees . . . 23
2.3.2 Logistic Regression . . . 24
2.3.3 Support Vector Machines . . . 25
2.3.4 Weighted Support Vector Machines and SVM+ . . . 26
2.4 Ensemble Models . . . 27 2.4.1 Boosting . . . 28 2.4.1.1 Adaptive Boosting . . . 29 2.4.1.2 Gradient Boosting . . . 29 2.4.2 Bagging Ensembles . . . 30 2.4.2.1 Averaging Predictors . . . 30 2.4.2.2 Bootstrap Aggregation . . . 32 2.4.2.3 Pasting . . . 32 2.4.2.4 Random Subspaces . . . 32 2.4.2.5 Random Patches . . . 33 ix
2.4.2.6 Random Forests and Extremely Randomized Trees . . . . 33
2.5 Topic Models . . . 34
2.5.1 Latent Semantic Analysis . . . 34
2.5.2 Probabilistic Latent Semantic Analysis (pLSA) . . . 35
2.5.3 Latent Dirichlet Allocation . . . 36
2.5.3.1 Supervised Extensions to LDA . . . 38
2.5.3.2 Topic Models in Classification Tasks . . . 41
2.5.3.3 Evaluating Topic Models . . . 43
2.6 Multi-label Learning . . . 44
2.6.1 Label Set Modifications . . . 45
2.6.2 Algorithm Modifications . . . 47
2.6.3 Label Dependence . . . 49
2.6.4 Multi-label Classification in Other Domains . . . 51
ii t o p i c a l e n s e m b l e s 53 3 t o p i c a l e n s e m b l e s f o r s e n t i m e n t c l a s s i f i c at i o n 54 3.1 A Topical Ensemble . . . 55
3.1.1 Closely Related Models . . . 57
3.2 Datasets - Amazon Product Reviews . . . 59
3.2.1 Vocabulary Agreement . . . 61
3.3 Evaluation . . . 64
3.4 Experimental Methodology . . . 66
3.5 Experiments - Balanced Categories and Classes . . . 68
3.5.1 Baseline Performance . . . 68
3.5.1.1 Unweighted Majority Voting . . . 69
3.5.1.2 Weighted Majority Voting . . . 70
3.5.1.3 Oracle . . . 70
3.5.1.4 Tied Predictions and Errors Committed by the Ensembles 71 3.5.2 Scale of Learning Weights . . . 73
3.5.2.1 Error Analysis . . . 75
3.5.3 Summary . . . 77
3.6 Experiments - Category and Class Imbalance . . . 79
c o n t e n t s xi
3.6.1.1 Data set (b)500-500/4500-4500. . . 80
3.6.1.2 Data set (c)500-4500/4500-500 . . . 80
3.6.1.3 Data set (d)4500-500/4500-500. . . 81
3.6.1.4 Data sets (e) and (f) . . . 81
3.6.2 Topical Ensemble Performance (b) - (d) . . . 81
3.6.2.1 Topical Bias or Random Variation? . . . 82
3.6.3 Topical Ensemble Performance (e) - (f) . . . 84
3.6.4 Summary . . . 84 3.7 Learning Curve . . . 85 3.8 Summary . . . 89 4 t o p i c a l e n s e m b l e s f o r h i e r a r c h i c a l m u lt i-l a b e l c l a s s i f i c at i o n 90 4.1 Multi-label Learning . . . 92 4.1.1 Evaluation Methods . . . 94
4.2 Topic Based Multi-label Classifier . . . 96
4.3 Data sets . . . 99
4.4 Experiments . . . 103
4.4.1 Data Sets and Preprocessing . . . 103
4.4.2 Comparison Models . . . 103 4.4.3 2-level hierarchy . . . 105 4.4.3.1 Summary . . . 109 4.4.4 4-level hierarchy . . . 109 4.5 Summary . . . 115 5 c o n c l u s i o n s a n d f u t u r e w o r k 116 5.1 Topical Ensembles in Sentiment Classification . . . 116
5.2 Topical Ensembles for Topical Content . . . 120
iii a p p e n d i x 123 a c h a p t e r 3 - a m a z o n d ata s e t s 124 b c h a p t e r 3 - b a l a n c e d d ata, n o w e i g h t s c a l i n g 132 c c h a p t e r 3 - s u b-s a m p l e r e s u lt s 136 d c h a p t e r 4 - c at e g o r y c o u n t s 140 e c h a p t e r 4 - p e r c at e g o r y p e r f o r m a n c e 146
f s o f t wa r e e n v i r o n m e n t 149
L I S T O F F I G U R E S
Figure1 Plate diagram for Probabilistic Latent Semantic Indexing. Docu-ment labelsdand wordsware both treated as observed variables linked together via latent unobserved topicz. There is no natural way of determining the topic mixturezof unobserved documents as the topic mixtures are directly linked to data observed during training. . . 35
Figure2 Plate diagram for Latent Dirichlet Allocation where only words are observed variables. The parametersαandβdescribe Dirich-let distributions that allow for sampling multinomial document-topic (θ) and word-topic (φ) distributions. The wordsware each sampled from a separate topic distribution. . . 36
Figure3 Author-Topic model (Rosen-Zvi et al.,2004) and Supervised LDA (sLDA) (Blei and McAuliffe,2007) . . . 39
Figure4 Discriminative LDA. Notice that the causality between the document-topic distribution (z) and the response variableyis reversed com-pared to sLDA (Figure 3b). π is a prior distribution for the
re-sponse variable and T is a linear transformation matrix learned from data using Expectation Maximisation. The learned matrix is applied to document-topic distributions to allow the topics to discriminate between different target labels. . . 40
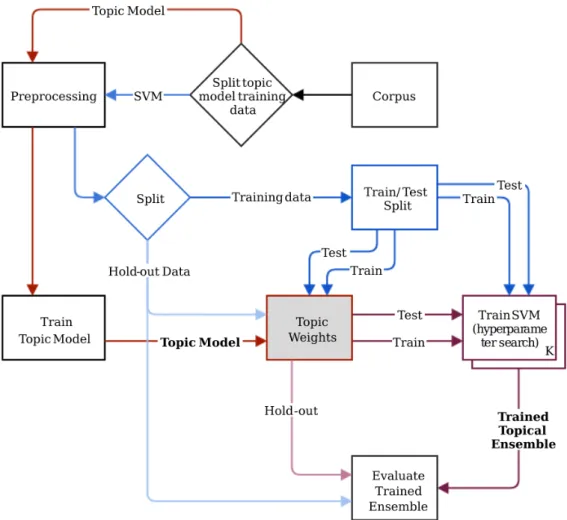
Figure5 Training workflow for a topical ensemble. Notice that unlike in previous work we use the topic weights as additional input for the ensemble training, but they are not used as the document representation. . . 56
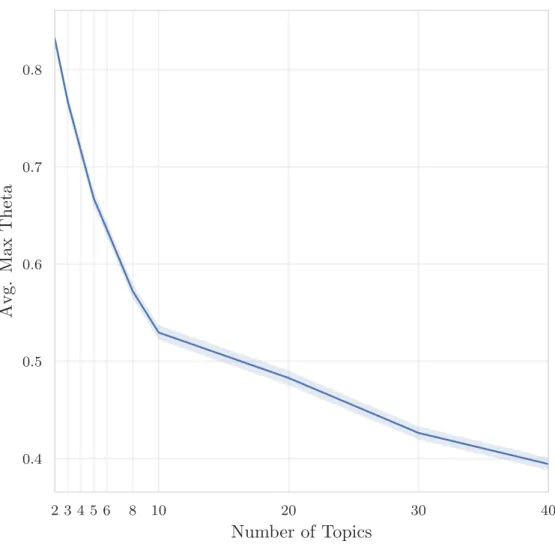
Figure6 Average maximum document topic weight across the ensemble with the 95% confidence interval. When the max weight drops below0.5a single "expert" model can be out-voted by the rest of the ensemble when using weighted majority voting. . . 71
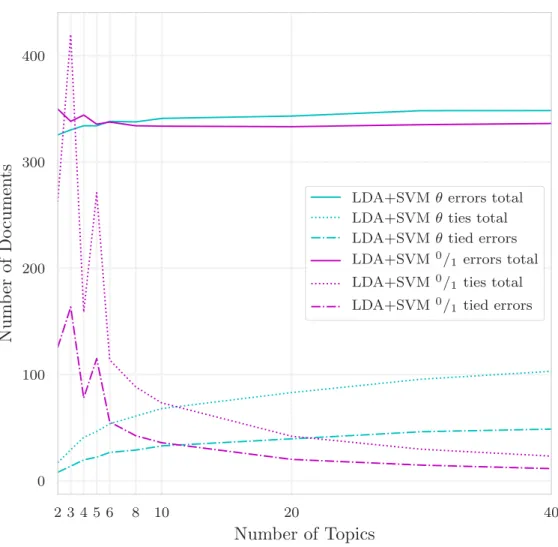
Figure7 Average number of errors committed by the two ensemble model variants using unscaled LDA document-topic proportions. The number of tied predictions and the number of errors due to tied predictions are displayed as dotted and dash-dotted lines respec-tively, the unweighted ensemble is shown in magenta and the weighted ensemble in cyan. Total size of the test set is2000 docu-ments, giving an error rate of approximately17% on the balanced dataset (Table3a). . . 72
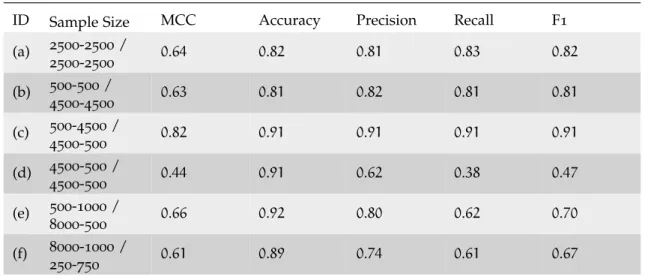
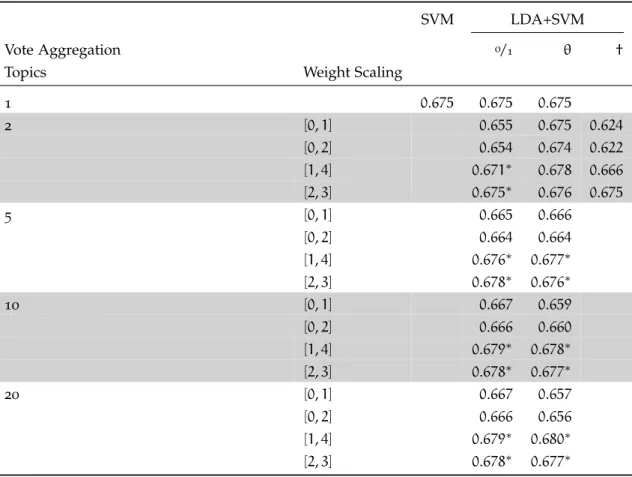
Figure8 Average number of errors committed by the two ensemble model variants with weight scaling[1,4]. The number of tied predictions and the number of errors due to tied predictions are displayed as dotted and dash-dotted lines respectively. A tied prediction for the unweighted ensemble is one where the class votes are less than2 votes apart, and for the weighted ensemble less than 0.15 apart. . . 78
Figure9 Absolute (top) and relative (bottom) improvements in single SVM performance, measured as Matthews Correlation Coefficient, on all of the Amazon Product Review datasets. . . 87
Figure10 Relative improvement of the ensemble (20 topics, weight scale [1,4]) compared to single SVM. Blue is unweighted majority vot-ing, green is document-topic weighted majority voting. The re-sults marked with a * are statistically significant at the 5% level (McNemar’s test). . . 88
Figure11 Training workflow for a topical ensemble. Unlabelled training data is used to train a topic model. Labelled training data is used to compute similarities between topic weights and cate-gory assignments. The catecate-gory assignments are normally dis-crete meaning thatp(D|c=1)is a vector of binary values, but the method can handle probabilistic category assignments as well. . 97
Figure12 Category overlap for the1sttier labels as absolute document counts (left) and percentages (right). . . 101
Figure13 Percentage category overlap for the2nd tier labels. . . 102
Figure14 Precision-Recall trade-off for all models on the4-tier label hierarchy.112
Figure15 F1-score against training data size for the two best performing models. The shaded areas show the quartiles of the F1-score dis-tribution for each model. . . 114
Figure16 Top 100topic term values for a 20 topic model. Thick black line is the mean. Each grey line is an individual topic. . . 119
L I S T O F TA B L E S
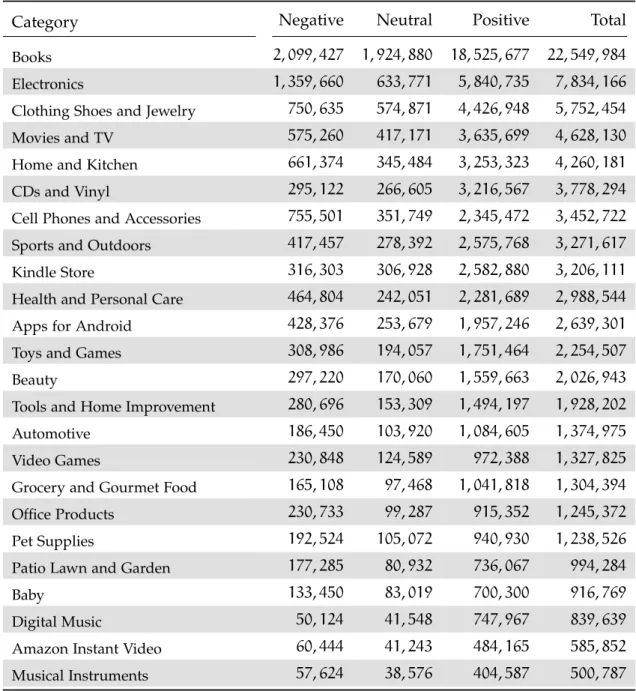
Table2 Document counts for each sentiment class for the24categories in the Amazon Product Reviews dataset. Negative documents have a sentiment rating 6 2, positive documents > 4 and those in between are neutral. . . 60
Table3 Different splits of data sampled from the Amazon Product Re-views dataset. The splits are created in such a way that each split tests specific aspects in the ensemble. Split (3a) is a baseline
con-dition where both the categories and the classes are balanced. In (3b) the classes are balanced but the categories are imbalanced. In
(3c) the categories and classes are balanced overall but the class
distribution is flipped between the two categories. In (3d)
cate-gories are balanced but the classes have a large imbalance. Splits (3e) and (3f) should best reflect real world data sets where both
the categories and the classes are imbalanced. . . 62
Table4 Five different evaluation metrics for the single SVM classifier on different data splits for theMovies and TV vs. Pet Suppliescategory pair. Each sample contains10000documents in total with varying class and category imbalances. Accuracy is a bad evaluation met-ric as substantial changes in Precision and Recall are not reflected in Accuracy as the class imbalance of the dataset changes. . . 66
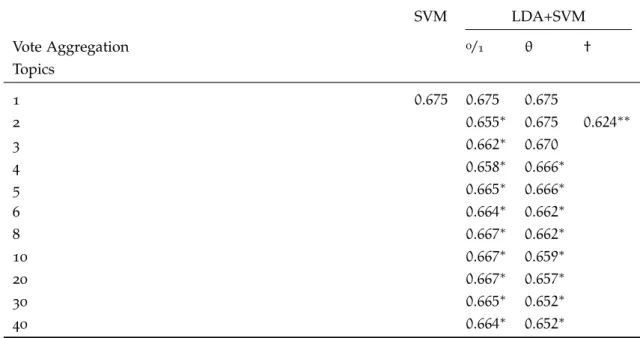
Table5 Matthews Correlation Coefficient of the topical ensemble against a single SVM and an oracle. Results marked with ∗ are signifi-cantly different at the5% level (McNemar’s test, p-value <0.05). The topic model variants are based on the way in which the en-semble votes are aggregated:0/1uses a simple unweighted major-ity andθ uses a majority vote weighted based on the document topic proportions of test documents. The last column (†) is an oracle model that has access to the gold-standard category in-formation. The 1 topic case is a sanity check to make sure the software implementation works correctly. There is no difference between the models in the1topic case. . . 69
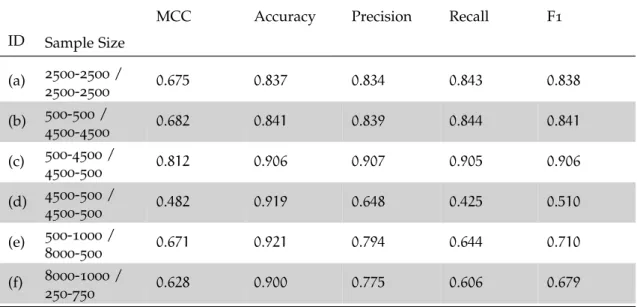
Table6 Matthew’s Correlation Coefficient for the balanced data set ((a) 2500-2500/2500-2500). The weight scale settings that are signif-icantly better than the[0/1]weight scaling for the corresponding model settings are marked with a superscript * (p < 0.05, McNe-mar’s test.) . . . 75
List of Tables xvii Table7 Average agreement in numbers of documents for predictions
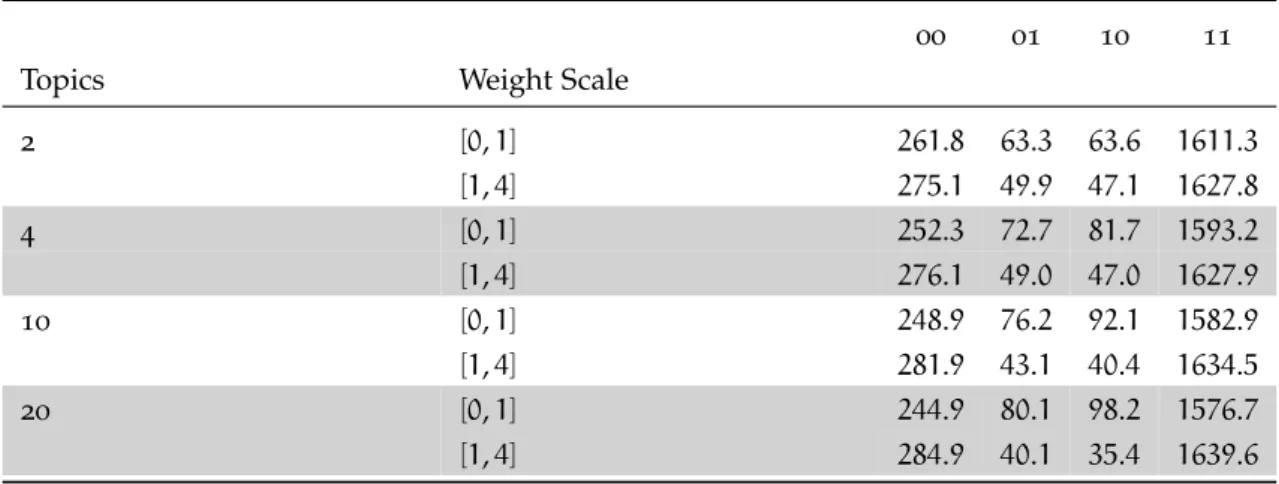
be-tween SVM and weighted ensemble. The columns are:00number of documents where both models made an error, 01 number of documents where only SVM made an error,10number of docu-ments where only the ensemble made an error and11number of documents where both models made the correct prediction. . . . 76
Table8 Single SVM performance on different data splits over all8 cate-gory pairs. Each sample contains10000 documents in total with varying class and category imbalances. . . 80
Table9 Summary Table of Matthews Correlation Coefficient comparing the ensemble model to the single SVM for datasets (b), (c) and (d). 82
Table10 Summary Table of Matthews Correlation Coefficient comparing the single SVM and our ensemble model to an ensemble where each SVM is trained with unit weights for all training data (LDA+SVM†). Note that the weight scaling does not apply to the LDA+SVM†as all the weights are set to one for that model. The differences are not statistically significant at the5%-level. . . 83
Table11 Summary Table of Matthews Correlation Coefficient comparing the ensemble model to the single SVM across a number of differ-ent datasets. . . 85
Table12 Precision @K metrics for state-of-the art model in multi-label clas-sification on the RCV1dataset. As our model only creates discrete label assignments, not a ranking, we are not able to measure the precision @k metric. . . 94
Table13 Topic codes, category sizes and the topic code explanation for a selection of topic codes from the RCV1. The full table can be found in the Appendix (Table25) . . . 100
Table14 Mean number of documents per category for each category in the 2-level hierarchy over25 random samples. . . 106
Table15 0/1-loss, precision, recall and label ranking loss for all models on documents labelled with the top2levels of the Reuters label hi-erarchy. For the 0/1-loss lower is better. Precision and recall are measured as the average per document precision and recall, i.e. the multi-label variants of the metrics. The comparison ensemble models have200estimators in them, and the topic based ensem-bles use a topic model with200topics. . . 107
Table16 Per category average (unweighted macro) performance metrics for all labels and the different label tiers separated out. . . 108
Table17 Mean number of documents per category for the4-level hierarchy over 25 random samples. The full data table is available in the Appendix (Table26) . . . 110
Table18 0/1-loss, precision, recall and label ranking loss for all models on documents labelled with the4 levels of the Reuters label hierar-chy. For the 0/1-loss and label ranking loss lower is better. Preci-sion and recall are measured as the average per document preci-sion and recall. The comparison ensemble models have200 esti-mators in them, and the topic based ensembles use a topic model with200topics. . . 111
Table19 Per category binary Precision, Recall, F1-score and Accuracy av-eraged across all label tiers (unweighted macro). . . 111
Table20 Per category binary Precision, Recall, F1-score and Accuracy for the different label tiers separated out. Note that the F1-score dis-played is not the harmonic mean of the listed precision and recall values but the average of the individual F1-scores for each category.113
Table21 Vocabulary agreement scores (see Section 3.2.1) and number of
shared vocabulary items for the category pairs used in Chapter3. 124
Table22 Vocabulary agreement scores (see Section 3.2.1) and number of
shared vocabulary items for the category pairs used in Chapter3. 131
Table23 Mathews Correlation Coefficient for balanced data (dataset (a), see Section3.2Table3. . . 135
Table24 Mathews Correlation Coefficient for sub-sampled ensemble train-ing. . . 139
Table25 Topic codes, category sizes and the topic code explanation for every topic code in RCV1. . . 142
Table26 Average category counts for the4-level hierarchy over25random samples. . . 145
Table27 Per category average (macro) performance metrics for labels and the different label tiers separated out. Note that the F1-score dis-played is not the harmonic mean of the listed precision and recall values but the average of the individual F1-scores for each category.148
A C R O N Y M S
AdaBoost Adaptive Boosting
LSA Latent Semantic Analysis
pLSA probabilistic Latent Semantic Analysis
LSI Latent Semantic Indexing
IR Information Retrieval
SVD Singular Value Decomposition
LDA Latent Dirichlet Allocation
sLDA supervised Latent Dirichlet Allocation
DiscLDA Discriminative Latent Dirichlet Allocation
MedLDA Maximum entropy discrimination LDA
FLDA Frequency LDA
DFLDA Dependency Frequency LDA
MLTM Multi Label Topic Model
MCMC Markov Chain Monte Carlo
MLP Multilayer Perceptron
PMI Pointwise Mutual Information
TF Term Frequency
TF-IDF Term Frequency Inverse Document Frequency
SVM Support Vector Machine
FSVM Fuzzy Support Vector Machine
MCC Matthew’s Correlation Coefficient
OvR One versus Rest
OvO One versus One
i.i.d. independently and identically distributed
ID3 Iterative Dichotomiser3
CART Classification and Regression Tree
Extra Trees Extremely Randomised Trees
PCA Principal Components Analysis
KNN K Nearest Neighbours
RAKEL Random K Labelsets
AUC Area Under the ROC Curve
ROC Receiver Operating Characteristic (a graph showing false positive rate against the true positive rate)
a c r o n y m s xxi HMM Hidden Markov Model
CNN Convolutional Neural Network
1
I N T R O D U C T I O NDocument classification is an active field of research with a long history. It has been applied to many problems from early email sorting systems, spam filtering and more recently sentiment classification, relevancy filtering and topic annotation. To perform these tasks automatically an algorithm is given labelled data to establish statistical pat-terns between document contents and target labels. This mapping usually associates occurrence patterns of words to a class label such as Positive or Negative sentiment, Rel-evant or Not RelRel-evant in the context of relevancy filtering or possibly a category label such as Sports, Weather, Travel or Economics.
A key factor in creating document classification systems is the relationship between the contents of a document and the class label. Considering the class labels above, we see that there are at least two different types of document classification. The last example with labels such as Travel and Weather is a task that is inherently topical, i.e. assigning a class label depends on the topical content or what the document is about. This stands in contrast to sentiment classification, which requires understanding the propositional content (Lyons, 1995)1: a document expresses positive or negative sentiment towards a target entity through the author proposing negative or positive sentiment rather than a topic the document discusses.
These two types of tasks are sometimes differentiated in the literature as document categorisation for topical content and document classification for propositional content although the terms are often used interchangeably. The distinction, however, is impor-tant as it helps us understand the kind of variability a machine learning model is likely
1 In addition to propositional content sentiment classification is considered to require accounting for
extra-propositional content, such as author attitude, framing, irony and uncertainty. We review these issues in more detail in Section2.1.4.
to encounter. We are especially interested in the variability of the statistical patterns be-tween document content and the target labels. Since these patterns are the signal that classification algorithms rely on to decide which label to apply, they need to be consis-tent across a model’s entire life cycle and application domain in order for the model to be useful in practice. However, inconsistencies in the classification signal can arise due to topical diversity.
Data sets with rich topical structures are common in many real world text classifica-tion tasks, but many standard document classificaclassifica-tion algorithms do not take this factor into account. Instead, classifiers are often trained with the assumption that topical diver-sity does not play a role. However, there is good evidence to suggest the opposite2
due to the target labels being expressed in different ways under different contexts.
To understand the role topical context plays in shaping how the target label is ex-pressed consider Game Console product reviews and a classifier trained to differentiate positive from negative sentiment. The model will learn that typically negative senti-ment is associated with certain words while positive sentisenti-ment is associated with others. Those words, however, are not guaranteed to have the same class association in a differ-ent context. For instancerestartcould have a negative association for reviews under the Game Consoles category as people complain about having to restart their console, but the same feature can have no class association under the Books category. This has two consequences: first, a classifier trained on Game Console reviews incorrectly interprets the classification signal when applied to Book reviews. Second, a classifier trained on both Game Console and Book reviews would lose a part of the signal that is useful for only a portion of the corpus as the overall corpus wide statistics do not support using restart as a feature for the negative class. These issues are aggravated for words with opposing class associations across topical boundaries.
This thesis is focussed on how changes in topical context can impact the performance of standard classification models and how the topical information could be used to im-prove performance on topically rich datasets. An example of this is Domain Adaptation (Blitzer, Dredze, and Pereira,2007) where a classifier trained on data from one domain is applied to data from a different domain. The assumption in domain adaptation is that
2 In Domain Adaptation tasks it is well known that the similarity of a source domain to a target domain
impacts the difficulty of adapting a classifier from one to the other. For instance Blitzer, Dredze, and Pereira (2007) show that a sentiment classifier trained on book reviews performs worse on kitchen reviews than a classifier trained on electronics reviews.
i n t r o d u c t i o n 4
the source and target domains are known, however, there are many scenarios where a topically diverse corpus exists but the exact topical composition is not known. For instance, many product review websites allow users to submit reviews for a variety of product categories without explicitly defining a category. Similarly data collection meth-ods from online sources often do not allow one to define explicit topical structures. Data collection from Twitter has to happen using a boolean keyword query; in order to collect a large enough sample of documents related to a particular study the queries typically need to be broad and fairly relaxed. The broad, relaxed queries in turn mean that a lot of documents unrelated to the task end up in the data set thus broadening the topical scope of the corpus.
In some cases the topically diverse data sets are cleaned in a pre-filtering stage where documents are classified into Related and Unrelated classes. Documents that are unre-lated can be discarded, simplifying later steps in the processing pipeline. This is illus-trated in the ACL Shared Task on Aspect-based Sentiment in Social Media Customer Feedback, or GermEval 20173. The task is to extract aspect based sentiment from cus-tomer tweets about the service of the German train operator Deutsche Bahn. The task is divided into4sub-tasks, the first of which is relevance classification: "Determine whether a social media post contains feedback about the "Deutsche Bahn" or if the post is off-topic/contains no evaluation". In other words, discard data that was not intended to be collected in the first place. Note that the algorithm deployed in the pre-filtering stage needs to deal with topical diversity and has to be able to determine the relevance of documents for potentially topically very rich data4
.
Applying standard classification algorithms to these kinds of topically diverse corpora can be challenging due to the class association of words changing across topical contexts. Ensemble models offer a solution for restoring the consistency. Ensemble models were developed to address issues with overfitting: classifiers learning to replicate statistical anomalies in training data that are not useful overall for the task. Traditionally, ensem-bles are trained by taking repeated random samples from the training data and building multiple models, one per sample. The data samples are taken at random to guarantee
3 https://sites.google.com/view/germeval2017-absa/
4 A motivating factor for the thesis was a project that involved building a pre-filtering system in a media
that the statistical properties of the samples reflect those of the original data set and due to a lack of prior knowledge about the data being sampled.
Given that document classification deals with natural language we do have prior knowledge about the data, more specifically, we know that natural language is topical. The topic of a discussion or a document constrains the vocabulary to revolve around the topic itself; an article about the World Cup final is likely to refer to goals, footballs, player groupings and team tactics and less likely to refer to black holes, anti gravity or German politics.
The aim of this thesis is to explore whether the topicality of natural language can be used to guide building ensemble classifiers; in Chapters 3 and 4 we develop novel
en-semble methods that rely on a topical decomposition of a corpus. In Chapter3we focus
on a sentiment analysis task and build an ensemble from linear classifiers together with topic modelling5
. In general, the ensemble consists of linear classifiers that are biased towards specific topics during training by modifying the objective function of the classi-fier. In Chapter 4we focus on a hierarchical multi-label classification task and develop
a new learning framework for topical ensemble models. Our framework combines topic modelling with an efficient weight computation and significantly outperforms several comparison models.
The contribution of this thesis is as follows:
1. We show that the class association of word types is topic dependent, and that accounting for topical context is beneficial for some tasks.
2. We develop a novel ensemble method based on topic modelling and linear classi-fiers for document classification.
3. We show that using an ensemble method for tasks that depend on propositional content is beneficial.
4. The empirical findings further show that tasks that require understanding proposi-tional content, such as sentiment analysis, do not necessarily benefit from the top-ical information although using an ensemble model improves performance. This finding suggests an alternative explanation to the improvement shown by Xiang and Zhou,2014.
i n t r o d u c t i o n 6
5. We present a novel ensemble method for hierarchical multi-label classification and show that it significantly improves performance over baseline models in a real world task.
6. We present a "vocabulary agreement" metric for measuring how much the classifi-cation signal diverges in a binary task between two different appliclassifi-cation domains. The rest of this thesis is structured as follows: Chapter2reviews the relevant literature,
and presents the algorithms used in this thesis. Chapter3addresses the problem of
sen-timent classification and develops a topical ensemble model for that scenario. Chapter4
deals with hierarchical multi-label document classification and presents a novel ensem-ble classifier based on a topical division of the data. Chapter5concludes the thesis and
2
R E L AT E D W O R KThis thesis focuses on document classification of datasets with a broad topical range. We investigate how the topical information can be utilised to improve the performance of a classification algorithm. The two tasks we focus on are sentiment classification and hierarchical multi-label classification. In sentiment classification we focus on document level binary sentiment in user generated product reviews, and in multi-label classifica-tion we focus on topical categorisaclassifica-tion of newswire text. These tasks have normally been performed using algorithms that are insensitive to topical context, but recent research has investigated how topical context could be used to benefit classification methods. We present methods that add to the existing literature by using topical information and embedding topically biased classifiers in classifier ensembles.
This Chapter provides context to our work by presenting previous research in doc-ument classification, ensemble models and topic models, and is structured as follows. Sections 2.1 and 2.2 give background information for understanding document
clas-sification and give an overview of sentiment clasclas-sification. Section 2.4 describes both
foundational research in model ensembles and more recent research in building model ensembles for topically rich document classification scenarios. Section2.5describes topic
models and how they have been used previously to address the tasks that are the focus of this thesis. Section2.6covers the kinds of modifications made to standard algorithms
to handle multi-label problems and provides context for the kinds of application scenar-ios where multi-label classification is needed.
In the discussion until now we have used the term "document classification" as a general concept. Since this thesis explores utilising topical information to improve clas-sification algorithms it is important to make a note on terminology: the terms
2.1 s e n t i m e n t c l a s s i f i c at i o n 8 cation and categorisation are used somewhat interchangeably by researchers. Most use categorisation when the task is to assign documents into topical categories, tasks where the categories correspond to our intuitive notion of a topic such as Politics, Sports or Weather. When the task is to assign documents to non-topical groups such as Positive or Negative sentiment the task is normally referred to as classification. Classification, however, is sometimes also used to refer to the former and as such is a term that encom-passes all tasks where a label or collection of labels is assigned to documents. We will useclassortarget labelto refer to the target labels of a classifier, whether the target labels are topical or non-topical in nature. It will be clear from context which kind of target label is being discussed. It is important to note that in some scenarios the category or topic of a document is aligned with the class of the document and in others it is not. In sentiment analysis, for instance, the class is different from the category or topic.
Finally, categoryandtopicare often also used interchangeably. We will usecategoryto refer to a human understandable semantic grouping such as Politics or Weather and topicto refer to the output of a probabilistic topic model.
section 2.1
Sentiment Classification
Manufacturers, retailers and service providers are interested in what customers think of their product or service. Managing the brand identity is important in a competitive marketplace and customer loyalty can be increased by promptly addressing questions or grievances. The frustrations and grievances as well as positive feelings are often ex-pressed on social media or on review websites, making those platforms useful resources for detecting positive or negative sentiment towards a product or company. Sentiment Classification (Turney,2002; Pang, Lee, and Vaithyanathan, 2002; Pang and Lee,2004) is a general term for a number of different classification tasks. At its simplest Sentiment Classification is the task of automatically assigning a positive or negative sentiment label to a document such as a product review or a tweet. Sentiment Classification can also be a multi-class task where the class labels can be positive, negative and neutral (Poursep-anj, Weissbock, and Inkpen, 2013; Chalothorn and Ellman, 2013; Becker et al.,2013) or an even finer grained sentiment polarity task with five classes, 13 classes (Chaovalit and Zhou,2005) or possibly a continuous rating scale for positive or negative sentiment.
Sentiment classification is diverse also in the types of data the methods are applied to. Sentiment classification can be done on the document level, as is the case in this thesis, or on smaller units such as sentence level or word level. Sentiment analysis can also be oriented towards specific aspects of a product or a service (see Section 2.1.2). This
Section gives an overview of the types of sentiment classification tasks that researchers have looked at in the past and the methods proposed to solve those tasks.
Seminal work in Sentiment Classification by Turney (2002) used heuristic methods to extract sentiment containing phrases and Information Retrieval (IR) methods to as-sociate sentiment to the extracted phrases. They first extract subjective language (See Subsection 2.1.4) and then score the extracted phrases (bi-grams) according to their
se-mantic orientation. The sese-mantic orientation is calculated as the difference between the Pointwise Mutual Information (PMI) score of a phrase with a highly positive word (the word "excellent") and thePMIscore with a highly negative word ("poor"). Finally a doc-ument is classified as positive ("recommend" in their use case) if the average semantic orientation score of phrases extracted from the document is positive. The work is highly relevant for this thesis as one of the key challenges identified by Turney (2002) is the variability in semantic orientation of sentiment bearing phrases across domains. This variability is a key reason for them to use adjective/noun bi-grams instead of single ad-jectives as the document features; they specifically note the importance of the contextual information noting that: “. . . the adjective “unpredictable” may have a negative orienta-tion in an automotive review, in a phrase such as “unpredictable steering”, but it could have a positive orientation in a movie review, in a phrase such as “unpredictable plot””. This exact same problem is a motivation for the work in this thesis. We also use a scor-ing technique that is similar to theirs for findscor-ing words that have a high variability in their semantic orientation across different domains (see Section3.2.1). Our method
how-ever is not limited to just positive or negative sentiment but generalises to any binary classification task.
Pang, Lee, and Vaithyanathan (2002) extended the work of Turney (2002) and evalu-ated standard machine learning models – Naïve Bayes, Maximum Entropy and Support Vector Machines – on movie review data. They evaluate a host of different feature ex-traction methods and show that machine learning models have competitive performance against human counterparts on a sentiment analysis task on movie reviews. They also
2.1 s e n t i m e n t c l a s s i f i c at i o n 10 provide a pertinent discussion about how people tend to express opinion noting that sim-ple bag-of-words classifiers are unlikely to excel at the task. Their error analysis shows that the machine learning models commonly make mistakes on documents where a negation of a previous negative sentiment is used as a rhetorical device. Having a bet-ter contextual understanding on how sentiment is expressed might help. Various ap-proaches for contextualising how sentiment is expressed have later been proposed both in the field of computer science (Socher et al.,2013) and in linguistics Polanyi and Zae-nen (2006) and Benamara, Chardon, Mathieu, et al. (2011). These approaches and more are reviewed in the following4Subsections.
2.1.1 Sentiment Mining and Summarisation
As product review websites, personal blogs and user forums have gained in popularity the need for mining information from those online sources has grown. A number of sys-tems have been developed to aid aggregating user opinions from online sources. These systems are often motivated by a need to have a complete picture of user opinions. Both Morinaga et al. (2002) and Dave, Lawrence, and Pennock (2003) developed methods for addressing this need and designed systems for searching and displaying the aggregated opinions through a query interface.
Morinaga et al. (2002) presented a sentiment extraction tool that collected opinions about specific products from free text on web pages given specific product names as query terms. Their system extracts opinion expressions based on a pre-defined dictio-nary and ranks the extracted statements based on how likely they are to contain an opinion. Stochastic complexity (Rissanen,1996) is used to automatically construct classi-fication rules from statements that both contain an opinion and occur in the vicinity of a product mention. The rules are essentially word lists that contain typical opinion words for certain products. The words alone do not provide enough context for the user of the system to evaluate typical opinions about the target product so a word co-occurrence analysis is used to extract larger contexts for the opinions. Finally, full sentences that contain opinions are ranked based on the information extracted earlier. These sentences are used to contextualise the opinions users typically hold of a certain product. An infor-mal analysis shows that the system is able to extract opinions from free text and provide
some context to product oriented sentiment analysis. However as no quantitative eval-uation or comparisons with other systems or baselines is done it is difficult to say how effective the system is.
Dave, Lawrence, and Pennock (2003) developed a tool for aggregating and summaris-ing user generated product reviews from online sources. They first train a Naïve Bayes classifier on user rated reviews from C|net or product reviews from Amazon. They tested a number of feature selection and smoothing techniques and compared the Naïve Bayes classifier to a method that uses averages of feature scores with the Naïve Bayes classifier having better performance. Dave, Lawrence, and Pennock (2003) highlight a few issues that are of interest in the context of this thesis. They note the large number of contexts in which a product is mentioned and specifically note that a specialised genre classifier is likely needed to assign phrases into coherent topical categories. Secondly, as the methods they use are statistical the document features that carry high positive or negative scores can be unexpected features from a linguistic standpoint. For instance, in their study "headphones" was a negatively weighted feature due to the word being used much more in negative reviews. This is an interesting observation as it highlights how some product features tend to be ones the are cited more in negative contexts while other are cited more in positive contexts. The product features themselves are not as such positive or negative, but they can serve as a useful signal of sentiment in statistical models. Although the presented system works well on product reviews the performance degrades when applied to general web content which may or may not contain opinion-ated text.
Yi et al. (2003) extended the work of Dave, Lawrence, and Pennock (2003) by focussing on extracting sentiment about a given topic1
and on improving the performance on gen-eral web text. They also use linguistic patterns to extract opinion features, but introduce two novel statistical feature selection methods to select and assign polarity scores to the extracted features. The first feature selection method uses multinomial language models – one for general language and one for topic specific language – to compute topic
spe-cialised feature scores. The second method uses a statistical likelihood test introduced by Dunning (1993). The final sentiment classification is done using hand crafted
heuris-1 Yi et al. (2003) use the words "topic" and "subject" somewhat interchangeably, but crucially they are not re-ferring to a topic in the strict sense of topic modelling but rather in the more common "a topic of discussion" sense.
2.1 s e n t i m e n t c l a s s i f i c at i o n 12 tic methods. On product reviews the system has comparable performance with that of Dave, Lawrence, and Pennock (2003), but far outperforms ReviewSeer on general web content.
Hu and Liu (2004) demonstrate a system for summarising user written product re-views that relies on identifying opinionated sentences and the polarity of those sen-tences before finally producing summaries of the aggregated reviews. The identification of important opinion words is different to Dave, Lawrence, and Pennock (2003) in that specifically adjectives are extracted as opinion words. The polarity of the extracted ad-jectives is determined from WordNet (Miller et al.,1990) synsets using a set of seed ad-jectives with known polarity as the basis and expanding those known polarities through the WordNet synonym / antonym adjective graphs. One major issue with the adjective seeding process of Hu and Liu (2004) is that the they come up with the positive and negative adjectives, 30 in total, themselves. This both restricts the applicability of their method to sentiment analysis and does not account for the variability in language use pointed out in previous research (Dave, Lawrence, and Pennock,2003; Pang, Lee, and Vaithyanathan, 2002; Turney,2002).
2.1.2 Fine-Grained Sentiment Analysis and Encoding Lexical Polarity
An important aspect of sentiment analysis pipelines is the accurate identification of polar expressions and the subsequent encoding of their polarity. A number of studies have taken the approach of Hu and Liu (2004) and used WordNet as a lexical resource to determine the sentiment polarity of lexical items.
Kamps et al. (2004) suggested using the minimum path length of a target word to a known polar adjective ("good" / "bad") as a measure for the target word’s semantic polarity and Ding, Liu, and Yu (2008) propose including context dependent opinion words in an opinion lexicon. They determine the contextual polarity of words using linguistic features combined with WordNet (Miller et al., 1990) synonym / antonym pairs. For instance, if the word "long" is found to be positive in the context of "battery life" then long’s antonym "short" is assigned negative polarity for that context regardless of "short" having been observed in that context or not. Both Hu and Liu (2004) and
Ding, Liu, and Yu (2008) use their respective methods to extract fine grained sentiment information about product features.
Jin, Ho, and Srihari (2009) presented an integrated machine learning model that learned a Hidden Markov Model (HMM) over a sequence of word part-of-speech tag pairs. To make learning the model parameters computationally feasible the authors re-strict the Markov chain to be first-order. They address feature sparsity bu using the polarity propagation methods presented by Hu and Liu (2004). Overall the results show that although statistical machine learning methods are computationally expensive they can also have competitive performance if tuned correctly.
The motivation for extracting sentiment about specific aspects of a product comes from a realisation (Hu and Liu,2004) that while a review may overall be positive it can contain information about some negative aspects of the product being reviewed. For a manufacturer knowing about these negative aspects is important. The task has later been named Aspect Based Sentiment Analysis (Pontiki et al., 2014). The approaches to Aspect Based Sentiment Analysis have multiplied and range from supervised and unsu-pervised machine learning approaches (Gupta and Ekbal,2014; García Pablos, Cuadros, and Rigau, 2014) to extracting syntactic and lexical features (Negi and Buitelaar, 2014; Hangya et al.,2014) to creating distributed word representations (Blinov and Kotelnikov, 2014).
While aspect based sentiment analysis has been established as a discrete sub-task it is not the only fine grained sentiment analysis tasks that has received attention. Socher et al. (2013) introduced a sentiment treebank that builds on the work of Pang and Lee (2005). The data set contains over10000sentences with their entire parse tree annotated with fine grained sentiment information. The aim is to facilitate research in composi-tionality, that is, how the sentiment expressed in a sentence is composed out of smaller units and what impact for instance negation has. Socher et al. (2013) present a neural network model that is trained on the sentiment treebank and show that performance at a binary sentence level classification task increases by∼7% when accounting for the compositionality of sentiment over a sentence.
The advent of neural network approaches to sentiment analysis has shifted the focus away from explicitly extracting and scoring sentiment polarity and towards encoding sentiment information into distributed word representations. These approaches often
2.1 s e n t i m e n t c l a s s i f i c at i o n 14 do not need complex linguistic feature extraction processes but instead use pre-trained word embeddings (Mikolov, Chen, et al., 2013; Mikolov, Sutskever, et al., 2013; Pen-nington, Socher, and Manning, 2014), or a task that allows sentiment information to be encoded in the word embeddings during training. Kim (2014) showed that using pre-trained word-embeddings together with a Convolutional Neural Network (CNN) ar-chitecture yields competitive performance with the state-of-art and that fine-tuning the word embeddings during training allows further performance gains to be made. The fine-tuning is done simply by allowing the pre-trained word embeddings to be changed based on the task specific loss function and training data.
Ye, Li, and Baldwin (2018) focus on encoding external sentiment information into word embeddings by jointly learning a sentence level sentiment classifier and a sepa-rate model that predicts the sentiment distribution of words in the current sentence. Contrary to the fine-tuning method of Kim (2014) this method encodes sentiment in-formation that is not directly dependent on the primary prediction task (sentence level sentiment classification). The approach is interesting as it provides a way of integrating any number of different external information sources. For instance, the method could be used to encode topical information in addition to sentiment information. Their method beats multiple baselines both on document level binary sentiment classification tasks as well as fine-grained sentence level sentiment classification.
2.1.3 Domain Aware Sentiment Classification and Out-of-domain Data
Supervised learning methods often require lots of labelled training data. This is often a problematic limitation for sentiment classification systems as labelled training data for many domains is not available or is expensive to acquire. Several studies have focussed on the specific problem of cross domain sentiment classification Bollegala, Weir, Carroll, and Ishizuka (2010), Zhou et al. (2015), Zhang, Hu, et al. (2015), and Bollegala, Weir, and Carroll (2011). In this task training data exists or can be labelled for a source domain but not for a target domain. Since sentiment is expressed in different ways between the domains this presents at least two challenges: features observed in one domain may be absent from another and the polarity of features under one domain can be different in the other.
Aue and Gamon (2005) showed that a standard Support Vector Machine (SVM) classi-fier suffered a very substantial drop in accuracy when applied to a domain the classiclassi-fier was not trained on. They consequently conducted a number of experiments comparing different ways of combining labelled and unlabelled data from the source and target do-mains and an ensemble model to overcome the domain specificity. Their results indicate that using data, either labelled or unlabelled, from the target domain is beneficial. In all experiments the best performing model was a modified Naïve Bayes classifier (Nigam et al.,2000) that utilises information from unlabelled instances sampled from the target domain.
Read (2005) showed that sentiment classifiers are both training domain and time de-pendent, i.e. classifiers are biased not only by the training domain but also by the tem-poral sentiment trends present in the training corpus. They proposed using an external source of information to train a sentiment classifier that should allow the classifier to be less dependent on the domain of the training data. They extracted Usenet discussions that contain emoticons and used a context window around positive / negative emoti-cons to train a sentiment classifier. The trained classifier was then applied to test data from a different domain for instance movie reviews. Their results show that although the Usenet emoticon based classifier is effective in classifying in-domain data it performs only slightly better than a random classifier on the out-of-domain target data. The poor performance is attributed to noise in the Usenet data and poor coverage of tokens in the test data.
Both Wu, Tan, et al. (2009) and Ponomareva and Thelwall (2013) used graph based methods to approach the problem of cross domain sentiment analysis. Wu, Tan, et al. (2009) used an approach that is conceptually similar to a K Nearest Neighbours (KNN) classifier (Cover and Hart,1967). Their method assumes that a training data set and a test data set come from different but related domains, and that the sentiment labels of both training and test documents are similar to those of the documents’ neighbours. In order to build the document graph, similarities between the documents must be computed. This is done using cosine similarity on Term Frequency Inverse Document Frequency (TF-IDF) document vectors (see Section2.2.1.1). The assumptions made by Wu, Tan, et al.
(2009) are somewhat counter to the hypothesis of this thesis. For their method to work well the sentiment labels of two documents would need to have a near linear relationship
2.1 s e n t i m e n t c l a s s i f i c at i o n 16 with the overall similarity of the documents. However, defining document similarity is a tricky task (see Section2.5.3.3) and there is no reason to assume that two documents
that, for instance, discuss the Brexit vote share their sentiment polarity about the topic. Indeed, Ponomareva and Thelwall (2013) specifically point out that in order for the graph methods to be meaningful ". . . [the] vector representation of the data must contain sentiment markers rather than topic words". Nevertheless the results of Wu, Tan, et al. (2009) indicate that their method is at least better than the baselines it was compared to. Ponomareva and Thelwall (2013) further explore using graph methods for cross domain sentiment analysis. They use a slightly modified label propagation technique (Zhu and Ghahramani,2002) and show competitive results on a small sentiment analysis dataset. More recently Wu, Huang, and Yuan (2017) address the problem of domain specific sentiment classification by fusing information from multiple sources. Their approach is motivated by the understanding that sentiment is expressed in different ways in dif-ferent domains, and that a machine learning model for sentiment classification in one domain is not necessarily suitable for data from a different domain. Their approach uses labelled data in both the target and source domains as well as external sentiment lexicon features. The sentiment of words contained in an external sentiment lexicon can be prop-agated to domain specific sentiment words not found in the lexicon by looking at the frequency at which the words co-occur in certain contexts. Their results beat multiple baselines on an Amazon product reviews data set.
Out-of-domain data in the context of sentiment classification is often understood to be data from a different online source or topical category. For instance, Read (2005) used data from Usenet and movie reviews, whereas Ponomareva and Thelwall (2013) and Blitzer, Dredze, and Pereira (2007) used different product categories. An alterna-tive take on different domains is exemplified in the NTCIR-6, NTCIR-7 and NTCIR-8 cross-domain classification tasks (Seki, Evans, Ku, Chen, et al., 2007; Seki, Evans, Ku, Sun, et al., 2008; Seki, Ku, et al., 2010). In these tasks the domains reach across lan-guage boundaries. For instance, the multilingual opinion question answering sub-task in NTCIR-8involves questions in English and answers in traditional Chinese, simplified Chinese and Japanese. The sub-tasks also include finding opinion holders and opinion targets. These tasks show how varied sentiment analysis as an application field can be. The best performing approaches to NTCIR-8were similar to the ones already presented
here: feature extraction and filtering based on linguistic features and polarity scoring based on external lexical resources (Balahur et al.,2010).
2.1.4 Subjective Language
Sentiment analysis concerns itself with finding and correctly classifying language that expresses sentiment. As such sentiment analysis is related to recognising subjective lan-guage. Wiebe et al. (2004) argue that sentiment analysis methods can benefit from specif-ically accounting for subjective language and should, in order to function properly, do so. Polanyi and Zaenen (2006) further argue that only focussing on the polarity of indi-vidual terms often leads to an incorrect interpretation of the meaning of the text. This Subsection gives a brief overview of the research conducted in recognising subjective language in so far as it related to this thesis. For a thorough review of subjectivity and sentiment we refer the reader to Benamara, Taboada, and Mathieu (2017).
Wiebe et al. (2004) argue that many subjective expressions also have objective usages and that recognising subjective language is therefore context dependent. The authors focus on extracting subjective language based on three different clues: words that occur only once in a corpus, collocations that are indicative of subjectivity and distributional similarity (Lin,1998). All three methods improve the precision of identifying subjective language over a baseline model.
Riloff and Wiebe (2003) developed a statistical framework for learning linguistic pat-terns of subjective language. In their framework high precision classifiers that rely on pre-existing word lists are used to separate subjective from objective texts; these sets of texts are then used to learn new extraction patterns from subjective language by com-puting the conditional probability of a subjective expression given the subjective and objective texts. The subjectivity patterns extracted by Riloff and Wiebe (2003) were later used by Wilson, Wiebe, and Hoffmann (2005) in a hierarchical classification model for sentiment analysis. The authors first identify subjective language phrases and then dis-ambiguate those phrases into positive and negative sentiment.
Language is not necessarily subjective only when explicit subjective phrases are used. Subjective language can be much more subtle as demonstrated by Polanyi and Zaenen (2006). They argue that the ways in which ". . . lexical items reflect attitudes is more
2.1 s e n t i m e n t c l a s s i f i c at i o n 18 complex than simply counting the valences of terms". Their central argument is that the valence2
of lexical items can be strengthened or weakened by cultural context the presence of other lexical items and the discourse structure of the text. The work pro-vides crucial context for why sentiment analysis is difficult, and more specifically, why sentiment analysis on corpora with complex topical structures is difficult. Among the aspects that change the valence of lexical items are: modals3
, connectors that modify or negate the meaning of an utterance ("Although Boris is brilliant at math, he is a horrible teacher."), genre constraints and cultural context. Genre constraints is of particular inter-est here as Polanyi and Zaenen (2006) point out that movie reviews4 tend to have two types of information: information about the movie plot, locations and characters and information about the production of the movie. For sentiment analysis it is the latter information that is of relevance.
Benamara, Chardon, Yannick, et al. (2012) looked more specifically at the issue of negation and modality. They presented native speakers with sentences that contain (do not contain) negation or modal expressions and asked the native speakers to score opin-ionated sentences or if the sentence expresses an established opinion. Their empirical work shows that negation affects both the polarity and strength of opinion expressed and that modality impacts the strength of opinion expressed.
Recasens, Danescu-Niculescu-Mizil, and Jurafsky (2013) extended the discussion around subjective language to the more general biased language which includes linguistic traits such as epistemological and framing bias. Epistemological bias is exhibited in statements that are commonly held to be true (false) and are presupposed in word choices. For in-stance, "he believed sentiment analysis to be a complex problem" versus "he realised sentiment analysis was a complex problem". The use of "realised" in the latter sentence implies that he came to understand a universal fact as opposed to just holding a per-sonal belief. Framing bias refers to the usage of terms that reveal the writer’s stance on a particular issue; a good example of this are the terms "pro-life" and "anti-abortion". Although the terms both refer to the same political stance the former contextualises that stance positively while the latter does the opposite. Their method works in three steps:
2 Valence is the negative or positive attitude that a lexical item communicates.
3 The example given in the paper is the difference in sentiment between "Mary is a terrible person. She is
mean to her dogs." and "If Mary were a terrible person, she would be mean to her dogs." The latter sentence does not suggest that Mary is either a terrible person or mean to her dogs.
4 At the time of publication the movie review data set of Pang, Lee, and Vaithyanathan (2002) was the de facto standard for testing sentiment analysis methods.
finding biased phrases, identifying the biased terms in the phrase and finally correcting the biased terms. They apply a logistic regression model to the task and show that their model is very close to the human baseline performance.
Benamara, Chardon, Mathieu, et al. (2011) used methods from discourse analysis to perform subjectivity analysis. They extracted discourse fragments which were then used to contextualise the subjectivity / objectivity of statements within the fragments. They also provide a four-way breakdown of the ways in which sentiment can be expressed within the discourse segments: explicit positive or negative sentiment statements, posi-tive or negaposi-tive statements implied in an objecposi-tive statement, non-subjecposi-tive statements and subjective statements that do not express sentiment.
Recently Abdul-Mageed (2018) compared deep learning models with carefully fea-ture engineeredSVMs on Arabic language Tweets. They show that using social context and structural features such as hashtags, URLs, quotations etc. for SVMs significantly improves performance over a baseline model and that recurrent neural networks further improves the prediction accuracy for subjective language.
section 2.2
Algorithms for Document Classification
In this Section we formally define the problem of statistical document classification and outline common method for representing documents in machine learning tasks. Our focus is on methods that address the application areas dealt with in this thesis and methods that share similarities to those presented within it. For a complete historical per-spective on feature selection we refer the reader to existing literature by Aggarwal and Zhai (2012), Shalev-Shwartz and Ben-David (2014), Manning, Raghavan, and Schütze (2008), and Forman (2003).
2.2.1 Statistical Document Classification
Statistical document classification is the problem of determining which class label(s)
y∈Y to assign to instancesX ={x1,x2. . .xn}. The setY is a discrete set of class labels of size |Y|, and the documents X are normally represented as a vector of document featuresx∈RNorx∈{0,1}N. The dimensionsNtypically encode words in a document
2.2 a l g o r i t h m s f o r d o c u m e n t c l a s s i f i c at i o n 20 but can also represent other information such as latent topics inferred using a topic model5
.
To perform automatic document classification a statistical model is trained from a labelled data set Dl; the set Dl consists of pairs documents with their correct labels
Dl = ((x1,y1),(x2,y2). . .(xn,yn)). Normally only one label from Y is assigned to each document. Multi-label classification is an exception; in multi-label classification any number of labels can be assigned to a document.
Before a machine learning algorithm can learn a mapping from text to labels, the raw text in documents has to be transformed into some document representation. The general description of document classification above leaves out the details of what the feature vectors x ∈ X are composed of and as a result what kind of a signal the docu-ment representation provides. The docudocu-ment representation needs to carry a consistent signal of the target classes in order for the algorithms to learn something useful. This signal is determined by the preprocessing steps applied to the documents to extract document features. Some preprocessing methods are designed to separate signal from noise while others aim to highlight unique document features. The following three Sub-sections briefly cover the areas of feature extraction, feature values and feature selection.
2.2.1.1 Feature Extraction
The most common method for transforming raw text into feature vectors is the bag-of-words representation. This representation encodes the vocabulary of a dataset as word index locations and each document as a vector whose length is equal to the size of the vocabulary; words (features) present in a document are marked with a positive integer and everything else is 0. Most entries in a document’s feature vector will be zeros and usually only a handful will be non-zero.
The bag-of-words representation encodes documents in a purely symbolic form: words that are meaningful to humans are encoded as unique index positions that carry mean-ing only through their relation to the target classes. That relation is established usmean-ing Term Frequency (TF) feature values that encode the frequency of words in each
docu-5 Modern neural network based approaches often do not have an explicit document representation, instead
the algorithms consume the input one document feature at a time generating an implicit document repre-sentation (Howard and Ruder,2018).
![Figure 8: Average number of errors committed by the two ensemble model variants with weight scaling [1, 4]](https://thumb-us.123doks.com/thumbv2/123dok_us/9953689.2487977/100.892.190.748.313.850/figure-average-number-errors-committed-ensemble-variants-scaling.webp)