POUR L'OBTENTION DU GRADE DE DOCTEUR ÈS SCIENCES
acceptée sur proposition du jury: Dr J. Van Herle, président du jury
Prof. F. Maréchal, Prof. A. Wokaun, directeurs de thèse Dr S. Biollaz, rapporteur
Prof. M. Caracotsios, rapporteur Prof. D. Favrat, rapporteur
Integrating Rate Based Models into a Multi-Objective Process
Design & Optimisation Framework using Surrogate Models
THÈSE N
O6302 (2014)
ÉCOLE POLYTECHNIQUE FÉDÉRALE DE LAUSANNE
PRÉSENTÉE LE 18 SEPTEMBRE 2014
À LA FACULTÉ DES SCIENCES ET TECHNIQUES DE L'INGÉNIEUR LABORATOIRE D'ÉNERGÉTIQUE INDUSTRIELLE
PROGRAMME DOCTORAL EN ENERGIE
Suisse PAR
Essentially, all models are wrong, but some are useful. — George Edward Pelham Box
Acknowledgements
I am very thankful to both of my thesis directors Prof. François Maréchal and Prof. Alexander Wokaun for having accepted me as PhD student. Thank you Dr. Serge M. A. Biollaz for having hired me and for having offered me this life changing opportunity. Of course I have to thank Dr. Tilman J. Schildhauer for his very good supervision and the fruitful discussions we had. For writing the research proposal of my PhD project I have to thank Dr. Urs Rhyner and Dr. Tilman J. Schildhauer.
A very big thank you for supporting this work goes to Jan Kopyscinski, Martin Gassner, and Ivo Couckuyt for your great support. Ivo your support on the SUMO Toolbox was essential, a very big thank you. Also thank you Laurence Tock, Leandro S. Salgueiro Hartard, and Samira Fazlollahi for always being very helpful and for the fruitful discussions we had. Thank you Cécile Taverney and Brigitte Fayet for your great work. It was not always easy to handle the official work with the EPFL on this long distance but you made it much easier for me, thank you.
Thank you very much for supporting me and for always motivating me – actively or passively – to finish my thesis by just being my dear friends and memorable colleagues: Adile Duy-maz, Bü¸sra Co¸skuner, Christian König, Dhanya Maliakal, Dominique Hauenstein, Dominik Gschwend, Erich De Boni, Felix Grygier, Felix Neumann, Frank Pilger, Gisela Herlein, Hans Regler, Hannelore Krüger, Hossein Madi, Jan Kopyscinski, Jessica Settino, Mahsa Silatani, Marcel Hottiger, Marcelo D. Kaufman Rechulski, Marco Wellinger, Marian Dreher, Martin Künstle, Martin Rüdisüli, Matthias Trautmann, Maude Huerlimann, Max Sorgenfrei plus fam-ily, Peter Hottinger, Rajesh Pattupara, Ramy Hasan, Ronald Kehr, Samuel Gang, Sarah Gang, Simon Maurer, Soner Emec, Sven Philip Edinger, Thomas Marti, Tilman Schildhauer, Urs Rhyner, Vera Tschedanoff, and of course all the people I forgot to mention here. Thanks to my beloved family for always supporting me and giving me strength and to our friends Doug & Sylvia Windle. Thanks to my friends from the Salsa community, especially all my friends from Mambosa. To all of you, it was a great and memorable time with you and I am looking forward to a long time full of experiences with all of you.
Abstract
In the development of energy and chemical processes, the process engineers extensively apply computer aided methods to design & optimise these processes and corresponding process units. Such applications are multi-scale modelling and multi-objective optimisation methods. Multi-objective optimisation of super-structured process designs are expensive in CPU-time due to the high number of potential configurations and operation conditions to be calculated. Thus single process units are generally represented by simple models like equilibrium based (chemical or phase equilibrium) or specific short cut models. In the development of new processes, kinetic effects or mass transport limitations in certain process units may play an im-portant role, especially in multiphase chemical reactors. Therefore, it is desirable to represent such process units by experimentally derived rate based models (i.e. reaction rates and mass transport rates) in the process flowsheet simulators used for the extensive multi-objective optimisation. This increases the trust engineers have in the results and allows enriching the process simulations with newest experimental findings. As most rate based models are iteratively solved, a direct incorporation would cause higher CPU-time that penalises the use of multi-objective optimisation. A global surrogate model (SUMO) of a rate based model was successfully generated to allow its incorporation into a process design & optimisation tool which makes use of an evolutionary multi-objective optimisation. The methodology was applied to a fluidised bed methanation reactor in the process chain from wood to Synthetic Natural Gas (SNG). Two types of surrogate model, an ordinary Kriging interpolation and an artificial neural network, were generated and compared to its underlying rate based model and the chemical equilibrium model. The analysis showed that kinetic limitations have significant influence on the result already for standard bulk gas chemical components.
A case study applying the previous version of the process design model and the revised version (with rate based model introduced as a set of five surrogate models) will demonstrate that the prediction uncertainties of the process design & optimisation methodology are reduced due to the integration of the rate based model of the fluidised bed methanation reactor. It will be shown that the different process design models predict considerably different optimal operating conditions of the Wood-to-SNG process. This emphasises the importance of the integration of rate based models into the process design models.
The presented approach has been developed for the fluidised bed methanation reactor, how-ever, it is a generic approach which can be applied to other process unit technologies as well. Future investigations will target other technologies to further improve the process design & optimisation predictions and support project development.
Keywords: artificial neural networks, kriging, multi-objective optimisation, superstructure, process design, rate based model, reactive bubbling fluidised bed, reaction kinetics, surrogate modelling
Zusammenfassung
In der Entwicklung von energie- und verfahrenstechnischen Prozessen werden computer-gestützte Methoden ausgesprochen häufig für Design- und Optimierungsaufgaben einge-setzt. Im spezifischen sind dies multikriterielle und mehrskalige Optimierungsmethoden. Multikriterielle Optimierung von übergeordneten Prozessdesignstrukturen, in welchen die verschiedenen Technologieoptionen definiert werden, sind, aufgrund der Vielzahl an Kombi-nationsmöglichkeiten und Betriebsbedingungen, ausgesprochen rechenintensive Aufgaben. Daher wird es vorgezogen möglichst vereinfachte Modelle, wie beispielsweise die Berechnung von thermodynamischen Gleichgewichten, für die einzelnen Prozessschritte zu verwenden. Jedoch können bei der Entwicklung neuer Prozesse kinetische Effekte und Stofftransportlimi-tierungen eine übergeordnete Rolle spielen, was im besonderen bei Mehrphasenreaktoren der Fall sein kann. Aus diesen Gründen ist es wünschenswert entsprechende Prozessschritte mit experimentell gestützten Raten basierten Modellen (Reaktionsraten und Stofftransportraten) in den oben genannten computergestützten Methoden zur multikriteriellen Optimierung abbilden zu können. Ein solches Vorgehen würde das Vertrauen in die Aussagekraft der Mo-dellergebnisse steigern und die Modelle der computergestützten Methoden mit den neuesten Erkenntnissen aus den jeweiligen Forschungsgruppen bereichern. Ein direktes Einbinden der Raten basierten Modelle würde die Rechenzeit der multikriteriellen Optimierungsmethoden massiv steigern und deren Nutzung beeinträchtigen, da die meisten Raten basierten Modelle durch iterativen Verfahren berechnet werden. Um die Integration der Raten basierten Modelle in die Design- und Optimierungsmodelle zu ermöglichen, wurde ein globales Surrogatmodel (SUMO) entwickelt, welches erlaubt auf evolutionären Algorithmen basierte multikriterielle Optimierungsmethoden anzuwenden.
Diese Vorgehensweise wird in dieser Arbeit auf einen Wirbelschichtmethanisierungsreaktor, welcher in der Holz zu Methangas Prozesskette integriert ist. Es werden zwei verschiedene Surrogatmodeltypen untersucht, eineinfaches Kriging modelund einkünstliches neuronales Netzwerk, welche mit dem zugrundeliegenden Raten basierten Model und den Ergebnissen des thermodynamischen Gleichgewichts verglichen werden. Die Untersuchungen geben klar zu erkennen, dass kinetische Limitierungen einen signifikanten Einfluss auf die Ergebnisse der Hauptstoffströme des Reaktoraustritts haben. Ein Fallbeispiel zur Integration der Surrogatmo-delle, welches die Prozessdesignmodelle auf Basis von thermodynamischem Gleichgewicht und auf Basis der Raten basierten Modelle vergleicht, zeigt eindrücklich das die Unsicher-heiten der Vorhersagen durch Anwendung der Surrogatmodelle verringert werden kann. Es wird deutlich, dass die Modelle beträchtlich unterschiedliche Vorhersagen zum optimalen
Betriebspunkt des Holz-zu-Methangas Prozesses machen. Diese Ergebnisse unterstreichen die Wichtigkeit der Verbesserung der vorliegenden multikriteriellen Optimierungsmodellen durch Integration von Raten basierten Modellen einzelner Prozessschritte.
Der dargestellte Vorgehensweise in dieser Arbeit sind zwar in Bezug auf die Wirbelschichtme-thanisierung entwickelt worden, jedoch kann sie als allgemeine Herangehensweise betrachtet werden, welche auf andere Technologien angewendet werden kann. Zukünftige Forschungen werden andere Prozessschritte identifizieren und untersuchen um die Vorhersagequalität der Prozessdesign und -optimierungsmethoden zu verbessern die Projektentwicklung weiter voranzutreiben.
Keywords: künstliche neurale Netzwerke, Kriging, multikriterielle Optimierung,
übergeord-nete Strukturen, Prozessdesign, rate based model, reaktive blasenbildende Wirbelschicht, Reaktionskinetik, surrogate modelling
Contents
Acknowledgements v
Abstract (English/Français/Deutsch) vii
List of figures xvii
List of tables xix
Nomenclature xxi
Acronyms xxvii
1 Introduction 1
1.1 Motivation . . . 8
1.2 Goals and Scope of the Thesis . . . 9
1.3 Perspectives . . . 10
2 Process Design & Optimisation 11 2.1 Introduction . . . 11
2.1.1 The Wood-to-SNG Process . . . 11
2.1.2 The Process Design & Optimisation Methodology . . . 12
2.2 Background . . . 15
2.3 Process Design Model for the Case Study . . . 18
2.3.1 Adaptations to Support Future Process Optimisation . . . 24
2.4 Conclusions . . . 27
3 The Rate Based Model 29 3.1 Introduction . . . 30
3.2 Background & Model Revision . . . 31
3.2.1 Lab-scale Fluidised Bed Experiments . . . 31
3.2.2 Screening Experiment for Distributor-Near Hydrodynamics . . . 32
3.2.3 Original Model Definition . . . 32
3.2.4 Implementation of the Bubble Growth Correlation . . . 35
3.2.4.1 Kinetic Models . . . 38
3.2.6 Challenges in Axial Gas Profiles Predictions . . . 40
3.2.6.1 Near-Distributor Zone . . . 41
3.2.6.2 Middle & Eruption Zone . . . 43
3.2.6.3 Freeboard Zone . . . 43
3.2.6.4 Conclusion . . . 44
3.3 Prediction Performance Using Different Kinetic Expressions . . . 44
3.4 Essential Model Preparations & Adaptations . . . 49
3.4.1 Model Inputs . . . 49
3.4.2 Heat Integration Capabilities . . . 50
3.4.3 Improvements for Model Robustness . . . 53
3.4.4 Model Outputs . . . 57
3.5 Conclusions . . . 58
4 Surrogate Modelling 61 4.1 Introduction . . . 62
4.2 Method Overview . . . 63
4.2.1 Design Space & Design Space Sampling . . . 64
4.2.2 Surrogate Model Types . . . 66
4.2.2.1 Polynomial Regression or Response Surface Methods . . . 66
4.2.2.2 Radial Basis Functions . . . 66
4.2.2.3 Kriging . . . 68
4.2.2.4 Artificial Neural Networks . . . 76
4.2.3 Accuracy Measures and Model testing . . . 78
4.2.4 Strategies for handling high-dimensionality . . . 79
4.2.5 Surrogate Modelling in Process Engineering . . . 79
4.3 Surrogate Model Construction . . . 81
4.4 Model Definition . . . 85
4.5 Results . . . 87
4.5.1 Visual Examination . . . 95
4.6 Discussion & Conclusions . . . 101
5 Model Integration & Comparison 109 5.1 Introduction . . . 109
5.2 Integration of the Surrogate Model . . . 110
5.3 Comparison of Previous & Revised Process Design Model . . . 114
5.3.1 Decision Variables & Performance Indicators . . . 114
5.3.2 Case Study Results . . . 118
5.4 Conclusions . . . 125
6 Conclusions & Outlook 127 A Appendix 131 A.1 Other Parity Plots of the Surrogate Models . . . 131
Contents
Bibliography 144
List of Figures
1.1 Grubb curve of the development of a new technology . . . 6
2.1 Alternative process unit technologies for each step of the Wood-to-SNG process with illustration of the energy integration system. . . 12 2.2 Computational and information flow diagram of the process design &
optimisa-tion framework. . . 13 2.3 Wood-to-SNG Process Superstructure . . . 16 2.4 Comparison of the thermodynamic equilibrium model and the rate based
flu-idised bed model. . . 18 2.5 Process flowsheet of the Wood-to-SNG process design applied in the case study 20 2.6 Influences of gas composition and process unit operations in the Wood-to-SNG
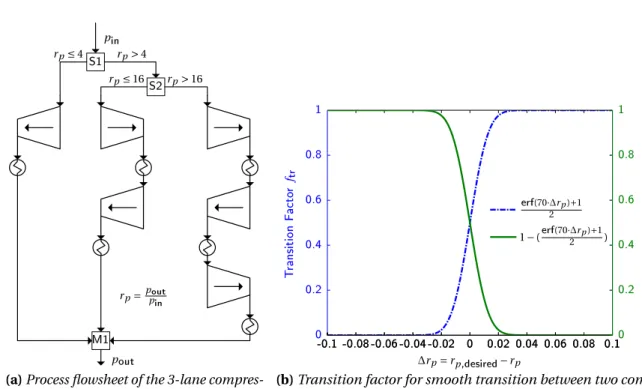
process on a measure of gas quality, the Wobbe index. . . 23 2.7 Application of a self-adjusting 3-lane compression system which applies a
1-stage, 2-1-stage, or 3-stage compression line. . . 26 2.8 Example of a flexible and generally applicable input stream pressure adjustment
for subsystems in a superstructure based process design model. . . 27
3.1 Scheme of the fluidised bed experiments and the two phase fluidised bed model. 31 3.2 Illustrations of an optical probe and its signal. . . 33 3.3 Scheme of the differential molar balance of the two phase fluidised bed model. 34 3.4 Assumed development of the superficial gas velocityufor analysing the
influ-ences of changing volume flow. . . 36 3.5 Comparison of two approaches for the implementation of a bubble growth
correlation. . . 37 3.6 Comparison between the implementation of the bubble growth correlation in
the original rate based model and the adapted rate based model. . . 38 3.7 Modelled and experimental local bubble hold-upεband axial gas concentration
and temperature profile of experiment no. 2. . . 41 3.8 Axial gas concentration profiles and temperature profile of experiment no. 7
compared to the rate based model results. . . 42 3.9 Parity plots of the H2 conversion and CH4, CO2, and H2O yields for the rate
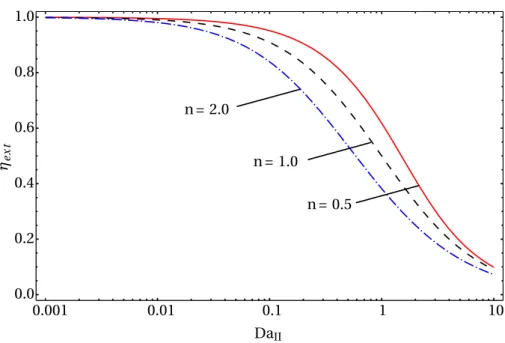
3.10 Residuals for the methane yield (left) and carbon dioxide yield (right) for the rate based model with different kinetic expressions. . . 47 3.11 External isothermal effectiveness factorηext,iover the Damköhler number for
different reaction ordersn. . . 55 3.12 Scheme of the fluidised bed reactor with illustration of the input and output
variables. . . 58
4.1 Correlation of the responses over the distance between the two points for varying parameterspandΘ. . . 71 4.2 Matern Correlation for varying parameterΘ. . . 75 4.3 A generalised representation of a multi-layer feed forward artificial neural network. 76 4.4 Flow chart of the surrogate modelling process. . . 82 4.5 Combination of three different experimental designs used as the initial sample
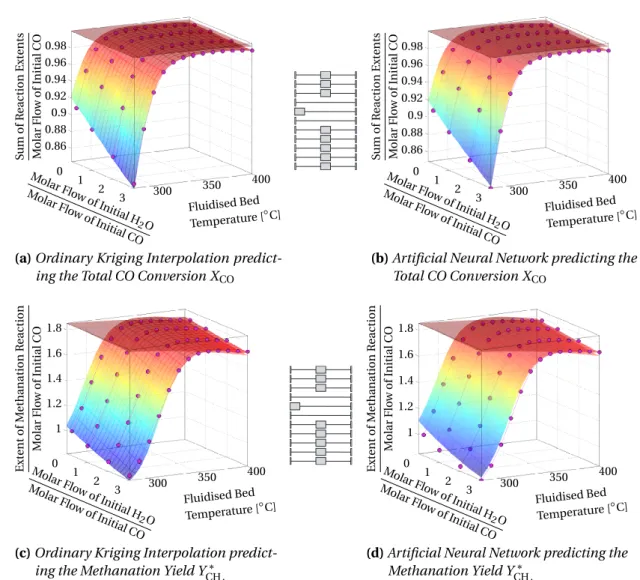
set for the surrogate modelling procedure. . . 83 4.6 Parity Plots of the 20-fold cross-validation data of the total CO conversionXCO. 91
4.7 Parity Plots of the 20-fold cross-validation data of the methanation yieldYCH4. . 92
4.8 Parity Plots of the 20-fold cross-validation data of the fluidised bed heightHFB. 93
4.9 Comparison of ANN and ordinary Kriging predicting the total CO conversion and the methanation yield for design space region 1 . . . 97 4.10 Surrogate ModelsHFB,am, andd
max
B for design space region 1 (centre case). . . 98
4.11 Performance comparison between ANN and ordinary Kriging for design space region 2 (border case). . . 99 4.12 Surrogate ModelsHFB,am, andd
max
B for design space region 2 (border case) . . 100
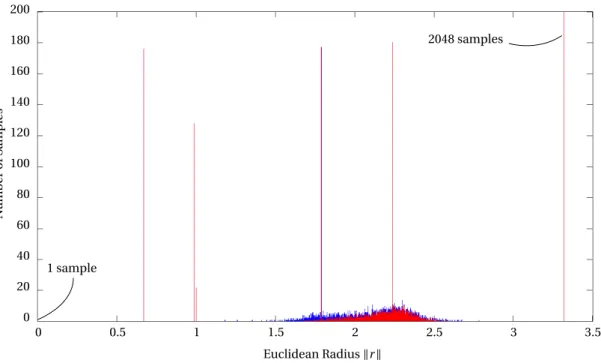
4.13 Histogram of the samples depending on the Euclidean distance to the design space origin based on normalised design variables in the range [-1,1]. . . 103 4.14 Distribution of all samples in the design space in dependence of the respective
combination of two design variables based on the sampling set of the ordinary Kriging interpolation with 7077 samples. . . 104 4.15 Distribution of all samples in the design space in dependence of the respective
combination of two design variables based on the sampling set of the artificial neural network with 9657 samples. . . 105 4.16 Two dimensional scheme of the development of the intersection volume of an
unity hypercube and a growing hypersphere inddimensions. . . 106
5.1 Scheme of the solution which integrates the surrogate model into the process design model. . . 111 5.2 Scheme of the communication between the DLL and the SUMO wrapper function.113 5.3 Process flowsheet diagram of the Wood-to-SNG process design with tags for
decision variables and performance indicators utilised in the case study. . . 115 5.4 Case study of the Wood-to-SNG process with methanation based on
thermody-namic equilibrium and H2:CO ratio of 6, H2O:CO ratio of 2, and 340◦C. . . 120 5.5 Case study of the Wood-to-SNG process with the rate based methanation model
List of Figures
5.6 Case study of the Wood-to-SNG process with methanation based on thermody-namic equilibrium and H2:CO ratio of 6, H2O:CO ratio of 2, and 300◦C. . . 122 5.7 Case study of the Wood-to-SNG process with the rate based methanation model
and H2:CO ratio of 6, H2O:CO ratio of 2, and 300◦C. . . 123
A.1 Parity Plots of the 20 fold cross-validation data of the maximum bubble diameter dB,max. . . 132
A.2 Parity Plots of the 20 fold cross-validation data of the specific cross sectional areaam. . . 133
List of Tables
1.1 Technology Readiness Levels . . . 4
2.1 Applied technologies for the different subsystems of the Wood-to-SNG process design. . . 19
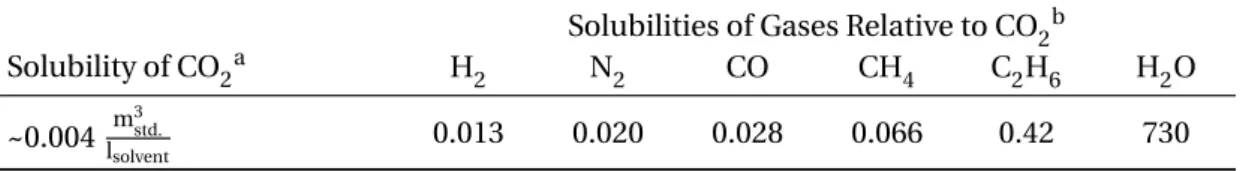
2.2 Solubility of selected compounds in SELEXOL. . . 21
2.3 Gas permeabilities of polysulfone and polyimide (Matrimid) membrane material used for industrial gas separation applications. . . 22
3.1 Settings of the laboratory fluidised bed experiments . . . 32
3.2 Parameters a to e of the kinetic expressions. . . 39
3.3 Estimated kinetic parameters for model 1, 2, 3 and 3m. . . 39
3.4 Model discrimination criteria for the models assuming isothermal behaviour. . 48
4.1 Design space definition for the surrogate modelling set-up . . . 86
4.2 Defined outputs of the surrogate model and their theoretical value ranges. . . . 87
4.3 Structure of the artificial neural networks for the five responses of the rate based model. . . 88
4.4 Kriging parameters for the five responses of the rate based model. . . 88
4.5 Error measurements of the 20-fold cross-validation data for the total CO conver-sionXCOand methanation yieldYCH4in comparison. . . 90
4.6 Error measurements of the 20-fold cross-validation data for the fluidised bed heightHFB, the maximum bubble diameterdB, and the specific cross sectional areaam. . . 94
4.7 Definitions of design space region 1 and 2 of the tested design space. . . 96
5.1 Relevant design variables of the process design used in the case study. . . 116
5.2 Relevant performance indicators used in the case study. . . 117
5.3 Results of the calculated process design for a temperature variation between 300◦C and 380◦C comparing the process design models based on thermody-namic equilibrium model (EQ) and rate based model (RB). . . 124
Nomenclature
Roman SymbolsA m2 Free Cross-Sectional Area of the Reactor
AB m2 Surface Area of an Individual Bubble
Ahx m
2 hx
m3 Specific Surface Area of the Vertical Heat Exchanger
Ar m2 Artificial Inter-Phase Mass Transfer Area
Ai – Absorption Factor for the Key Componenti
a m1 Specific Surface Area
ahx m1 Height Specific Surface Area of Vertical Heat Exchanger Tubes
am m
2s
kggas Specific Cross Sectional Area
cb,i molm3 Concentration of Compoundiin Bubble Phase
ce,i molm3 Concentration of Compoundiin Dense Phase
ci molm3 Concentration of Compoundi
Cov Cov
Cov – Covariance Matrix
DaII,i – Damköhler Number for Reactanti
dB,max m Maximum Bubble Diameter
dB m Mean Bubble Diameter
Di m
2
s Diffusion Coefficient of the Compoundi
dp m Particle Diameter
dv – Relative Gas Density
EA1 molJ Activation Energy used to calculatek1
erf(. . . ) – Error Function
ftr – Transition Factor
∆Hα molJ Adsorption Enthalpy
∆HC x molJ Adsorption Enthalpy of the Intermediate Carbon Species with
x=H or x=OH
∆H0R molkJ Reaction Enthalpy at Standard Conditions ˙
H MW Energy Flow
h m Height
HFB m Fluidised Bed Height
HHVv
kJ m3
std. Volumetric Higher Heating Value
LHVv
kJ m3
std. Volumetric Lower Heating Value
KCO2 – Vapour-Liquid Equilibrium Constant
Keq,j differs Equilibrium Constant of Reactionj
Kα bar−2.0 Adsorption Constant
KC x bar−1.5 Adsorption Constant of the Intermediate Carbon Species with
x=H or x=OH
KG,i ms Mass Transfer Coefficient of Compoundiin the Gas Phase
KOH bar−0.5 Adsorption Constant
L0 m
3 std.
h Molar Flow Rate of the Lean Solvent
m kg Mass
˙
m kgs Mass Flow
nB – Total Number of Bubbles
nR – Total Number of Reactions
Nth – Number of Theoretical Stages of SELEXOL Absorber Column
˙
n s mmol2 Molar Flux
˙
N mols Molar Flow
˙
Nvc mols Bulk Flow from the Bubble into the Dense Phase
Nomenclature
P0 Pa Pressure at Standard Conditions
pi bar The Partial Pressure of Compoundi
PR Pa Reaction Pressure
∆rp – Pressure Ratio Difference
r m Radius
rp – Pressure Ratio
Ri s kgmolcat Molar Reaction Rate of Compundi
rj s kgmolcat Specific Reaction Rate of Reactionj
Robs,,i m Observed Reaction Rate of the Compoundi
Re – Reynolds Number s – Split Fraction Scat m 3 std,CO+CO2kgcat h Catalyst Stress
Sci – Schmidt Number for Compoundi
Shp,i – Sherwood Number of a Particle for Compoundi
SSR – Sum of Squares of the Residuals
∆Tlog K Logarithmic Temperature Difference
T0 K Temperature at Standard Conditions
Tmeth ◦C Isothermal Reaction Temperature of the Fluidised Bed
Methana-tion Reactor
TR K Reaction Temperature
Tr e f K Reference Temperature of the Adsorption Constants
u m3
m2= m
s Superficial Gas Velocity
UmfR – Superficial Gas Velocity Ratio
umf m
3
m2= m
s Superficial Gas Velocity at Minimum Fluidisation Conditions
ub ms Bubble Velocity
VB m3 Volume of an Individual Bubble
VN+1 m
3 std.
h Molar Flow Rate of rich Absorber Column Feed Gas
˙
Wel sJ Electrical Work Load
Wv,HHV
kW h
m3std. Volumetric Wobbe Index Based on the Higher Heating Value.
xcat – Catalyst Fraction in the Fluidised Bed
Xi – Total Conversion of Speciesi
xi – Molar Fraction of Compoundi
xin
Toi l – Oil Inlet Temperature Factor
xout
Toi l – Oil Outlet Temperature Factor
y – Response b y – Predicted Response YCH4 – Methanation Yield Greek Symbols α mW2
hxK Heat Transfer Coefficient
βp,i ms Mass Transfer Coefficient of Compoundiat the Particle Surface
ε – Void Fraction or Error (in chapter 4)
ηg m
2
s Kinematic Viscosity of the Gas Mixture
ηext,i – Isothermal External Effectiveness Factor of Reactanti
Θ – Parameter of the Kriging approximation
θs – Molar Stage Cut
µLRE – Mean of the Limited Relative Error
νi j – Stoichiometric Coefficient of Compoundiin Reactionj
%g mkg3 Density of the Gas Mixture
%p mkg3 Catalyst Particle Density
χi – Molar Ratio of CompoundiCompared to CO
Nomenclature
Ψ Ψ
Ψ – Correlation Matrix
Subscripts
0 at standard conditions or at initial conditions
add addition adj adjusted b bubble phase B individual bubble cat catalyst cyc recycle e dense phase eq equilibrium
ex expanded fluidised bed
el electrical
en energetic
ext external
FB fluidised bed
hx heat exchanger
HHV based on higher heating value
i n input or inlet
LHV based on lower heating value
log logarithmic
m molar
meth methanation reaction
mf at minimum fluidisation conditions
out output or outlet
oil heat transfer oil
p particle or pressure
R reaction
rec recovery
ref reference
RWGS reverse water gas shift reaction
SNG of the synthetic natural gas
std. standard
th theoretical
tr transition
v volumetric
vc volume contraction
WGS water gas shift reaction
Superscripts
0 at standard conditions
in input or inlet
max maximal
out output or outlet
R ratio
Acronyms
ANOVA Analysis of Variances 66
CFD Computational Fluid Dynamics 80
DLL Dynamic Link Library. 111, 112
DOE Design of Experiments 65, 66, 82
DVGW German Gas and Water Industry Association 20
EEG Erneuerbare Energien Gesetz 1
EPFL École Polytechnique Fédérale de Lausanne 9, 11
FICFB Fast Internally Circulating Fluidised Bed 19
MATLAB MATLAB software of The MathWorks, Inc. 111–114
MOO Multi-Objective Optimisation 14
PDO Process Design & Optimisation 7, 18, 111
PSE Process Systems Engineering 1, 2
PSI Paul Scherrer Institut 9, 11
RAM Random Access Memory 81, 84, 113, 125
SELEXOL™ Trademark of a dimethyl ether of polyethylene glycol.
119
SNG Synthetic Natural Gas 114, 115, 120–123
SSR Sum of Squares of the Residuals 40
SVGW Swiss Gas and Water Industry Association 20
TRL Technology Readiness Level 17
1
Introduction
The world’s societies are facing big changes and challenges since climate change, increasing energy demand, natural resources depletion, and the debates on nuclear energy are evident and become more prominent as the world’s population grows. A world wide increasing trend of carbon dioxide emissions is a fact which societies and science have to face. Increasing speed in technological development, especially in the consumer electronics market, may arise the expectations among the public, that these problems get solved faster than ever before. Indeed, the rapid development in computer electronics and computer science does enhance the development of renewable energy technologies. However, the development cycles in process engineering remain being rather long in comparison.
The prevalence of the fossil fuel infrastructure and according consumer habits impede re-newable energy conversion technologies to become established on the energy market. A promising price tag is the most important property for a new technology to attract investors. The business case decides on rise and fall of a new technology and is the benchmark which investors use to compare emerging technologies. A consequence of this is the enforcement of new government legislation to countervail the economic limitations. As an example, the German EEG (Erneuerbare Energien Gesetz), the Renewable Energy Act, can be quoted. It was enacted to promote renewable energy technologies and to strengthen the relevant markets in the competition with the fossil-fuel energy sector.
The business case of a new process therefore has to be considered already in early stages of technology development avoiding misdirection of the development. The pure number of possible technologies and the mostly contradictory objectives yield in a complex problem which needs systematic procedures to solve it. In this context, computer aided methods are supporting the process engineers in the process of decision making in each of the develop-ment phases. The existence of journals and conferences, such as theComputers & Chemical EngineeringJournal and theEuropean Symposium on Computer Aided Process Engineering, and literature on this topic [51, 49, 81] are evidence that computer aided methods are well established in the process engineering community. They provide the process systems engi-neering (PSE) community with powerful and substantial tools to develop future technologies
and processes. Computer aided methods allow the simulation and optimisation of new pro-cess designs, calculate investment and operating costs, and they allow the computation of process integration concepts.
Trend-setting definitions of PSE are given by Grossmann and Westerberg [42] and Klatt and Marquardt [51].
“Process Systems Engineering is concerned with the improvement of decision-making processes for the creation and operation of the chemical supply chain. It deals with the discovery, design, manufacture, and distribution of chemical products in the context of many conflicting goals.”
Grossmann and Westerberg [42]
“PSE [. . . ] addresses the inherent complexity in process systems by means of systems engineering principles and tools in a holistic approach and establishes systems thinking in the chemical engineering profession. Mathematical methods and systems engineering tools constitute the major backbone of PSE.”
Klatt and Marquardt [51]
Although often related to chemical engineering, PSE targets process systems in general and therefore comprises energy conversion related processes as well.
In the citations above [42, 51], the authors point out that PSE represents a key element in the decision making regarding processes in the context of globalised markets and of globally acting companies. Thus, the number of constraints and conflicting goals is rather large and numerous factors besides process efficiency and process costs have to be considered. The answer of the PSE community on a growing demand in optimising such complex large scale systems with respect to all constraints is the application of multi-scale models and multi-objective optimisation methods. Multi-scale models combine models of different scale corresponding to, e.g. the level of products (molecular scale), process units (process unit scale), process systems (systems scale). This makes the methods of the PSE community well suited for enhancing technology development based on their capabilities to consolidate scientific knowledge on the different scales of the problem. The complexity of the covered problems makes such a consolidation of knowledge essential for decision makers and accordingly for the ability to guide the concurrent technology development.
Klatt and Marquardt [51] state that the PSE community acts as a cross- and trans-disciplinary link between the different research fields. However, this implies that the PSE community depends on experimentally based data, detailed models, and knowledge of other research groups once a certain point of the technology development has been achieved.
Energy published aTechnology Readiness Assessment Guidein the year 2011 [107]. The Tech-nology Readiness Assessment Guidegives the following definition of technology development:
“Technology development is the process of developing and demonstrating new or unproven technology, the application of existing technology to new or different uses, or the combination of existing and proven technology to achieve a specific goal. Technology development associated with a specific acquisition project must be identified early in the project life cycle and its maturity level should have evolved to a confidence level that allows the project to establish a credible technical scope, schedule and cost baseline.”
DoE [107]
TheTechnology Readiness Assessment Guide is a tailored version of a proven technology assessment model presented by the National Aeronautics and Space Administration (NASA) and the U.S. Department of Defense (DoD). The need for a technology assessment model like this is reasoned in the higher risk of projects to proceed with an ill-defined project baseline if they rely on concurrent technology development tasks [107].
The purpose of this guide is to assist the user:
“[. . . ] in identifying those elements and processes of technology development required to reach proven maturity levels to ensure project success. A successful project is a project that satisfies its intended purpose in a safe, timely, and cost-effective manner that would reduce life-cycle costs and produce results that are defensible to expert reviewers.”
DoE [107]
An important guide line in this assessment is the definition of the different maturity levels in nine so calledTechnology Readiness Levels (TRLs). The TRLs and their corresponding definitions are presented in table 1.1.
TABLE1.1:Definition of the Technology Readiness Levels adopted from the Technology Readiness Assessment Guidepresented by the U.S. Department of Energy in [107].
Relative Level of Technology Development
Technology Readiness Level Definition Description Basic Technology Research TRL 1 := Component and/or system validation in laboratory environment
This is the lowest level of technology readiness. Scientific research begins to be translated into applied R&D. Examples might include paper studies of a technology’s basic properties or experimental work that consists mainly of observations of the physical world.
Supporting Information includes published research or other references that identify the principles that underlie the technology.
Basic Technology Research or Research to Prove Feasibility TRL 2 := Technology concept and/or application formulated
Once basic principles are observed, practical applications can be invented. Applications are speculative, and there may be no proof or detailed analysis to support the assumptions. Examples are still limited to analytic studies. Supporting information includes publications or other references that outline the application being considered and that provide analysis to support the concept. The step up from TRL 1 to TRL 2 moves the ideas from pure to applied research. Most of the work is analytical or paper studies with the emphasis on understanding the science better. Experimental work is designed to corroborate the basic scientific observations made during TRL 1 work. Research to Prove Feasibility TRL 3 := Analytical and experimental critical function and/or characteristic proof of concept
Active research and development (R&D) is initiated. This includes analytical studies and laboratory-scale studies to physically validate the analytical predictions of separate elements of the technology. Examples include components that are not yet integrated or representative tested with simulants. Supporting information includes results of laboratory tests performed to measure parameters of interest and comparison to analytical predictions for critical subsystems. At TRL 3 the work has moved beyond the paper phase to experimental work that verifies that the concept works as expected on simulants. Components of the technology are validated, but there is no attempt to integrate the components into a complete system. Modeling and simulation may be used to complement physical experiments. Technology Development TRL 4 := Component and/or system validation in laboratory environment
The basic technological components are integrated to establish that the pieces will work together. This is relatively "low fidelity" compared with the eventual system. Examples include integration of ad hoc hardware in a laboratory and testing with a range of simulants and small scale tests on actual waste. Supporting information includes the results of the integrated experiments and estimates of how the experimental components and experimental test results differ from the expected system performance goals. TRL 4-6 represent the bridge from scientific research to engineering. TRL 4 is the first step in determining whether the individual components will work together as a system. The laboratory system will probably be a mix of on hand equipment and a few special purpose components that may require special handling, calibration, or alignment to get them to function.
Continuation ...
Relative Level of Technology Development
Technology Readiness Level Definition
Description
Technology Development
TRL 5
:= Laboratory scale, similar system validation in relevant environment
The basic technological components are integrated so that the system configuration is similar to (matches) the final application in almost all respects. Examples include testing a high-fidelity, laboratory scale system in a simulated environment with a range of simulants and actual waste. Supporting information includes results from the laboratory scale testing, analysis of the differences between the laboratory and eventual operating system/environment, and analysis of what the experimental results mean for the eventual operating system/environment. The major difference between TRL 4 and 5 is the increase in the fidelity of the system and environment to the actual application. The system tested is almost prototypical.
Technology Demonstration
TRL 6
:= Engineering/pilot-scale, similar (prototypical) system validation in relevant environment
Engineering-scale models or prototypes are tested in a relevant environment. This represents a major step up in a technology’s demonstrated readiness. Examples include testing an engineering scale prototypical system with a range of simulants. Supporting information includes results from the engineering scale testing and analysis of the differences between the engineering scale, prototypical system/environment, and analysis of what the experimental results mean for the eventual operating
system/environment. TRL 6 begins true engineering development of the technology as an operational system. The major difference between TRL 5 and 6 is the step up from laboratory scale to engineering scale and the determination of scaling factors that will enable design of the operating system. The prototype should be capable of performing all the functions that will be required of the operational system. The operating environment for the testing should closely represent the actual operating environment.
System Com-missioning TRL 7 := Full-scale, similar (prototypical) system demonstrated in relevant environment
This represents a major step up from TRL 6, requiring demonstration of an actual system prototype in a relevant environment. Examples include testing full-scale prototype in the field with a range of simulants in cold commissioning. Supporting information includes results from the full-scale testing and analysis of the differences between the test environment, and analysis of what the experimental results mean for the eventual operating system/environment. Final design is virtually complete.
TRL 8
:= Actual system completed and qualified through test and demonstration.
The technology has been proven to work in its final form and under expected conditions. In almost all cases, this TRL represents the end of true system development. Examples include developmental testing and evaluation of the system with actual waste in hot commissioning. Supporting information includes operational procedures that are virtually complete. An Operational Readiness Review (ORR) has been successfully completed prior to the start of hot testing.
System Operations
TRL 9
:= Actual system operated over the full range of expected mission conditions.
The technology is in its final form and operated under the full range of operating mission conditions. Examples include using the actual system with the full range of wastes in hot operations.
Research
DevelopmentDemonstration Deployment State of the Art
Technology Evolution over Time
Capital Requirement × Technology Risk 1st commercial service Full Size Demonstration Plant
1 2 3 4 5 6 7 8 9 Actual Estimate TRL Mature Technology 2nd plant in service 3rd plant in service
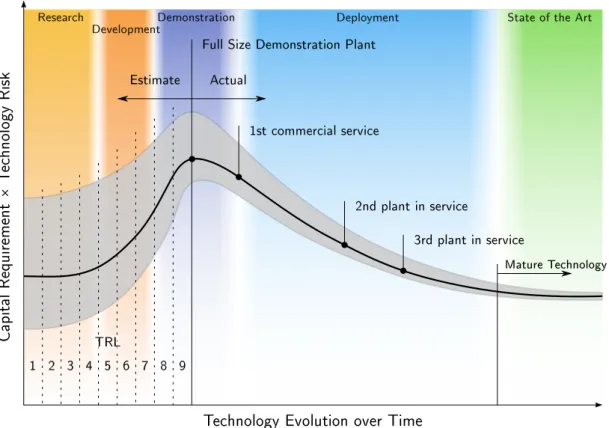
FIGURE1.1:Grubb curve of the development of a new technology adapted from [27, 82]
The importance of a technology development assessment can be illustrated by assigning the TRLs to the diagram in figure 1.1. It depicts that the TRLs are defined in the phases of research, development, and demonstration in which generally the highest risk of failure and high capital costs impede the technological development.
Figure 1.1 outlines the evolution of costs and risks of a technology development from its conceptual design to a state of a mature commercial installation. Such a diagram is often called a’Grubb’ curve. The grey area embedding theGrubb curverepresents the uncertainty of the costs and coherent risks evolving along the development of the technology. It illustrates that in early phases of the development, the underestimation of costs and risks is more prevalent than for phases of deployment and maturity of a technology. Furthermore, the range of uncertainty in the beginning of a technology development is much broader than for later phases. This is the result of learning effects, which also help to reduce the costs and risks in the deployment phase.
The given definition of technology development by the DoE [107] defines that combining new and already existing technologies to achieve specific goals is also regarded as technology development. This means that a new process design which may be a combination of new and old process unit technologies is considered to be a technology on its own. It is important to distinguish between anew process designas a technology on its own which generally consists of different process unit technologies andeach of the applied process units. They all underlie a
certain development from a concept to a mature application. To countervail any confusion, in the following, the termprocess technologywill be applied if a process design is addressed as technology and the termunit technologywill be used if a process unit is addressed as technology. The simple use oftechnologyaddresses a technology in general.
Considering the above, the progress of the process technology development is the result of combining the different TRL of all applied unit technologies, although their development can be at very different TRLs. This is an aspect which has to be considered when comparing results of different process designs in the course ofprocess design & optimisation(PDO) methods.
As mentioned in the beginning, the methods of the PSE community are well suited to enhance technology development because they consolidate the scientific knowledge in a single process design & optimisation approach. The consolidation of the attained scientific knowledge in the process design & optimisation tools is essential to narrow down the range of uncertainty about costs and risks of the investigated technology. In the following, the role of theprocess design & optimisation methodologyin the course of theprocess technology developmentwill be elucidated.
The descriptions of TRL 1 to 3 in table 1.1 are elucidating that the conducted work in these TRLs is basically research work on a conceptual basis. It comprises literature review, analytic studies, basic experiments, and basic modelling and simulation. Experiments conducted at TRL 2 are mostly screening experiments designed to corroborate the basic scientific observations made in TRL 1 [107]. The basic concepts and the idea of the process technology are mostly developed in computer aided methods of the PSE community such as theprocess design & optimisation tool(PDO tool) which will be discussed in chapter 2. The process design is modelled as detailed as possible applying sophisticated models of existing unit technologies. Most of these models apply rule of thumbs, thermodynamic calculations based on equilibrium data or are realised as phenomenological models or 0D models. In these early phases, the uncertainties are rather large since the knowledge about the process and its applied unit technologies is little. Simulations are predominantly simplified because of the lack of data. However, the process design & optimisation in these stages is not highly dependent on data from other groups despite of the data which can be extracted from existing literature. Selection of promising process designs can often already be applied in these stages. Further, the lack of knowledge of the different unit technologies can be identified which allows to suggest experimental work to be conducted to develop the most promising process designs.
Within the TRL 3 and 4, experimental work on crucial process steps of the new process designs begins. It entails first laboratory scale experiments which involve data acquisition methods and the generation of first 1D models which are later consolidated to multi-scale rate based models as presented in chapter 3. Experimental planning strategies and parameter estimation come into focus. The experimental effort and capital costs are increasing and the probability that the experimental work is conducted by different groups than the one developing the process designs is high. In fact, it is nearly always the case because scientific needs are
differing and the scientific expertise is seldom concentrated at only one place. This implies that the concerned research groups may also stay in competition with each other. Within TRL 3 and 4 the unit technology models applied in the process design model should be based on collaborative work to increase the confidence level of these models. The more detailed models are also needed for a improved estimation of process unit sizes and corresponding costs. Furthermore, the integration of the developed multi-scale rate based models in the process design model allows to identify characteristics of the process unit and the process design which otherwise may have been undiscovered.
In the course of the technology development of the TRLs 5 to 9 the experimental work is scaled up. This comprises prototypes and demonstrators which allow to validate the model assump-tions and to estimate model parameters for operation condiassump-tions which are representative for the actual planned operational environment of the technology. The capital costs become a bottle neck of the technology development. Experimental set-ups or demonstration projects have to be carefully planned to avoid disappointments. Attaining experimental data is in most cases highly expensive because the demonstrators on TRL 8 and 9 have already a large scale which elevates the operational costs of an experiment. The process technology development should ideally deliver the questions which have to be tackled during these experiments. The experiments should be focused on process unit characteristics which influence the process design the most. This allows early discovery of possible bottle necks or pitfalls, and a timely search for solutions on either side of the development. Here, the PSE community should seize the opportunity to guide and manage trans-disciplinary research. The models and simulation results attained at TRL 8 and 9 are later often utilised in the final commercial plants for opti-misation of operating conditions, and controlling & monitoring purposes. Thus, the process design model of TRL 8 and 9 of the process technology development has to deliver results with a high level of accuracy.
1.1 Motivation
In the previous section it has been discussed that the PSE community is acting as a trans-disciplinary link between different research fields. The PDO methods of the PSE community consolidate the knowledge of many different research fields in one methodology and therefore depend on experimental based data, detailed models, and on expert knowledge of other research groups. Being dependent on other research groups may be seen as the ’curse’ of the PSE community. However, this interdependency should be seen as an opportunity to guide the development of the alternative unit technologies to a TRL which is needed for a reasonable comparison of the technologies inside the process design.
The ultimate vision of the process design model, would be an instantaneously updated process design model where the newest findings and developed models are implemented to build an ideal foundation of the process design & optimisation approach. However, this asks for a well organised and vivid exchange of knowledge between the involved research groups.
1.2. Goals and Scope of the Thesis
Unfortunately, the reality is that the exchange of expert knowledge (e.g. computer models) does not take place on a short term basis. This has several reasons. The software which is used in the different research groups may differ strongly and compatibility of the methodology and modelling approaches has to be assured. Difficulties in overcoming compatibility issues may hinder an exchange of the developed computer models. Furthermore, the computational infrastructure and the associated calculation time of either of the modelling approaches often counteract a suitable combination of the different modelling strategies. In addition to technical and software specific hindrances, a fear of sharing confidential data may impede the exchange as well.
In the context of this thesis the focus will be set on theWood-to-SNGproject. The Wood-to-SNG process will be explained in section 2.1. Briefly, in this process, wood is gasified to a syngas which is cleaned from impurities and fed to a methanation reactor where it is converted into a methane rich product gas. The applied process design model was previously developed by EPFL (École Polytechnique Fédérale de Lausanne) . The developed process design & optimisation approach provides the engineers with the ability to simulate and optimise different solutions of asuperstructure based process design model by applying a multi-objective optimisation approachbased on anevolutionary algorithm. The calculations include the estimation of economic data (i.e. capital costs & operation costs) for which a sound approach of equipment and process unit sizing is needed. A very important process unit in this context is the applied fluidised bed methanation reactor which is in the development and demonstration phase (TRL 7-8). For a sound sizing and scale-up of the methanation reactor, a rate based model which considers the kinetics of the catalyst and hydrodynamic effects has to be used. Such a rate based model has been developed at PSI (Paul Scherrer Institut). It is desired to generate synergies of both technology developments to enhance the development towards a commercial realisation of the Wood-to-SNG project.
1.2 Goals and Scope of the Thesis
The goals of the thesis are the following:I the identification of the key elements which are needed to implement a rate based model, such as the fluidised bed methanation reactor model, into the process design & optimisa-tion methodology of EPFL;
II the identification and realisation of necessary adaptations on the rate based model accord-ing to the identified key elements in (I) to allow its integration into the process design & optimisation methodology;
III the realisation of a methodology which helps to limit the increase of computational effort caused by the integration of the rate based model;
IV to find programming solutions which allow the process design & optimisation method-ology to be applied as originally intended, without the need of applying fundamental
changes to it.
The scope of this thesis project is two fold. The first scope is the integration of the rate based model to enhance the confidence level of modelling results due to a higher level of consolidated knowledge. The second scope is to allow the investigation of the influences of process unit characteristics (methanation reactor) on the process design, and vice versa, more precisely. Especially with the focus on Wood-to-SNG process design options withPower-to-Gas applications (i.e. applying electrolysis to store energy of excess electricity in gas applications) where gas compositions will vary according to the operation conditions and amount of excess electricity. Varying gas composition will have effect on the methane efficiency of the reactor which should be investigated to provide solutions for suitable operation conditions.
The targeted approach in this thesis is to develop a surrogate model of the rate based model. Surrogate models are mathematical approximation models based on different mathematical approaches. The most applied and versatile surrogate model types are artificial neural net-works, radial basis functions, and Kriging interpolation models. The advantages of surrogate modelling are a shorter calculation time than the approximated computer models, their gener-alisation capabilities of model results, and the ability to smooth out rough resolution surfaces for faster optimisation results. The developed surrogate model will be implemented into the process design & optimisation methodology of EPFL under the premiss of applying as little modifications as possible to the process design & optimisation models. This should allow the methodology to compute the process designs without interferences of the surrogate model.
1.3 Perspectives
Ideally, the investigations in this thesis should allow to apply the here presented approach to any process unit of higher complexity. The advantage in comparison to similar approaches of process design modelling with surrogate models [75, 8, 9, 43, 44] is that not all unit technologies have to apply the surrogate modelling techniques. Where conventional models and short cut models are accurate enough to represent the reality, there is no need for surrogate modelling efforts. With this approach it is possible to selectively apply the surrogate modelling approach to process units which need a higher degree of model detail, but suffer long computation time or are facing software compatibility issues.
Furthermore, if the necessary key elements for the integration of the surrogate models are identified, the different research groups are able to prepare surrogate models of the process units and share them with the PSE community in a collaborative environment. Thus, the fear of distributing confidential knowledge should be obsolete and exchange of expert knowledge on timely basis can be targeted.
2
Process Design & Optimisation
2.1 Introduction
The approach presented in this thesis is based on the work of two former PhD theses. The first is aprocess design & optimisation methodologydeveloped at EPFL by Gassner [31, 32] which will be presented in section 2.1.2. The other is the work on arate based model of the fluidised bed methanation reactordeveloped at PSI [62, 64] which will be described in chapter 3. Both theses have been prepared in the context of the Wood-to-SNG process. For a guidance the following section will introduce the reader to the Wood-to-SNG process followed by an introduction into the afore mentioned process design & optimisation methodology.
2.1.1 The Wood-to-SNG Process
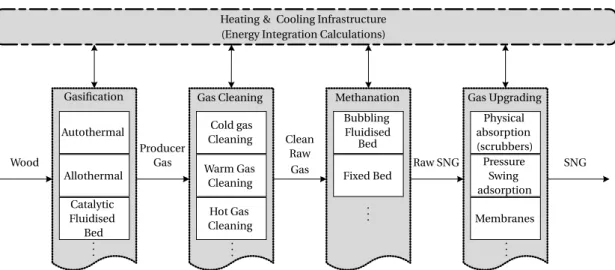
Figure 2.1 depicts the four general process steps of the Wood-to-SNG process. Depending on the applied gasification technology, wet or dried wood is fed to the gasification unit which converts the wood under addition of a gasification agent (air, oxygen and/or water steam) into the so called producer gas. This gas consists mainly of H2, CO, CO2, H2O, CH4, C2H4, and if the gasification agent is air N2as well. Additionally, impurities like small amounts of sulphur compounds, olefins and tars are gasification products. Most of these compounds harm the catalyst in the subsequent methane synthesis (methanation) step. They either cause deactivation of the catalyst by irreversible adsorption on the active sites (sulphur) or by carbon deposition. Therefore, a gas cleaning step is necessary. Well established cold gas cleaning (scrubbers) or more advanced catalytic hot gas cleaning are possible technology options. While the former can be categorised as a mature technology, the latter may be labelled with TRL 7, i.e. it is still in the phase of development & demonstration. In any case, both technologies are applied in combination with additional guard beds (Cu + ZnO) to protect the more expensive methanation catalyst. In the subsequent synthesis step, methane is formed from CO and H2 in the exothermic methanation reaction utilising a suited methanation catalyst (usually nickel based). The methanation step considered in this thesis is an isothermal bubbling fluidised bed methanation reactor. An alternative technology option would be a series of catalytic fixed bed
Heating & Cooling Infrastructure (Energy Integration Calculations)
Producer Gas Clean Raw Raw SNG SNG Autothermal Allothermal Catalytic Fluidised Bed
Gasification Gas Cleaning Cold gas Cleaning Warm Gas Cleaning Hot Gas Cleaning Methanation Bubbling Fluidised Fixed Bed Gas Upgrading Physical absorption (scrubbers) Pressure Swing adsorption Membranes Wood . . . . . . . . . . . . Gas Bed
FIGURE2.1:Alternative process unit technologies for each step of the Wood-to-SNG (Synthetic Natural Gas) process with illustration of the energy integration system.
methanation units with intermediate cooling and product gas recirculation to dampen the temperature rise in the fixed bed reactors. The last process step is a gas upgrading step which adjusts the gas mixture according to the required gas quality for an injection into the natural gas grid. The injection is regulated by national associations by providing the required range of the Wobbe Index. The Wobbe index is an indicator for the interchangeability of combustion fuel gases. The definition of the Wobbe index is given by eq. (2.1) in section 2.3. In this step mainly CO2and H2O are separated from the gas stream. Additionally, excess hydrogen is recovered and fed back to the feed of the methanation step or may be used to cover part of the energy demand of the process via combustion. For further detailed technology review please refer to Kopyscinski et al. [63]. The list of technology options presented in figure 2.1 is exemplary and by no means exhaustive.
2.1.2 The Process Design & Optimisation Methodology
The process design & optimisation methodology developed by Gassner and Maréchal [32] combines a process design model with a model for mass and energy integration calculations based on a predefined superstructure for the purpose of evaluating and optimising process designs using a multi-objective optimisation strategy. In the following, this approach will either be called theprocess design & optimisation (PDO) methodologyor thePDO procedure. The required software tools are going to be called thePDO frameworkor thePDO tools.
Figure 2.2 illustrates the flow of information in the computational procedure when applying the PDO methodology. It depicts that the PDO framework utilises an evolutionary optimi-sation algorithm which applies a set of models referred to as theprocess design model. The process design model consists ofthermodynamic modelswhich are calculating mass & energy balances and thethermo-economic modelswhich are calculating process unit sizes based on the thermodynamic models and deducing the investment costs of the process design from
2.1. Introduction
FIGURE2.2:Computational and information flow diagram of the process design & optimisation frame-work.
this knowledge. As Gassner and Maréchal [32] describe, the PDO methodology is based on the decomposition of the thermodynamic models into two parts. The decomposition into two parts corresponds to the models which are denoted as the non-linear and the linear problem in figure 2.2. The non-linear problem comprises the process flowsheet modelled in a commercially available software and the linear problem comprises a heat cascade model which is used in the pinch point analysis of the process design.
The application of the PDO procedure is applied as follows. The process engineers conduct a pre-selection of possible process designs and unit technology options to define the super-structure of the process design model (see figure 2.3 in section 2.2). The applied process superstructure consolidates the different technologies and their possible interconnections. The technologies and mandatory auxiliaries as well as feed, product, and recycle streams are defined in the process superstructure. The use of a process superstructure implies that integer decision variables have to be defined prior to the thermodynamic calculations. The integer decision variables are activating and deactivating given substructures (i.e. technologies or combinations of technologies) in the superstructure. The corresponding decision variables
are programmed into the non-linear and the linear problem statements. Together with the integer decision variables the process model forms a mixed integer non-linear programming (MINLP) problem which is addressed to the multi-objective optimisation (MOO) procedure. The superstructure builds the foundation of the applied MOO procedure. The MOO procedure will allow to identify the most promising concepts out of the proposed ones with respect to conflicting objectives. These objectives are also preceding information which has to be defined by the engineers. The decision variables are set in the course of the evolutionary multi-objective optimisation. They are defined previous to each iteration of the evolutionary algorithm. The decision variables differ from one generation of process designs to another. Each set of decision variables is an unique attribute of the resulting process design which allows to recalculate certain process designs if values of the applied decision variables are known.
Process streams are generally defined by a combination of extensive and intensive properties. Extensive properties are those which can be added up if two streams are mixed, e.g. mass flows and energy flows. Intensive properties are those which in the given case do not allow to be added up, e.g. temperature, pressure, and weight fractions. The applied process superstructure has a special feature regarding the process streams defined in the commercial flowsheeting software which are connecting the different technologies. In the case of the connecting process streams only the intensive state variables of the process streams are linked with each other; i.e. the temperature, pressure, and weight fractions of an output stream of one unit technology are passed to the input stream of the subsequent unit technology. The extensive variables are treated separately and are not linked with each other. Instead, the main input stream of each of the technologies in the superstructure is set to a mass flow of 1kgs. The mass flows of other input streams of a unit technology are set in relation to this main stream. Therefore, all streams defined in a unit technology, including flows of heat and power, are easily scalable by only one factor. The resulting mass and energy flows of the process flowsheet model (non-linear) are denoted as normalised extensive state variables in figure 2.2 since they are always related to a main input of 1kgs. They are passed to the mass & energy balances defined in the linear problem where they are applied to a heat cascade model. In the following, the linear problem will be calledenergy integration model, although it solves a combination of mass & energy integration. The energy integration model calculates scaling factors for each technology during the mass & energy integration calculations based on a pinch point analysis of the heat cascades. Consequently, it defines the final mass & energy flows of the process design. The targets of the energy integration calculations are a minimal use of heating & cooling utilities and maximum production of the desired product stream. A pinch point analysis is applied to support the energy integration calculations.
After the calculation of the thermodynamic states, the thermo-economic properties of the eval-uated process design are computed in a so called post-processing step. The post-processing step determines the sizes of the process units in dependence of the final results of the extensive and intensive variables calculated in the thermodynamic models. The performances of the process design and the objectives needed in the multi-objective optimisation algorithm are
2.2. Background
also calculated in this post-processing step. These are for example, thermodynamic efficien-cies, capital costs, costs of operation and maintenance, and life-cycle assessment ratings. The calculated objectives of a selection of evaluated process designs are finally plotted in a graph. The optimisation procedure will drive the results to a pareto frontier which is updated on every iteration of the optimisation process. Ideally, the progress of the pareto frontier will be examined and if only very little improvements are made between the different iterations, the optimisation process is stopped. In the current solution a certain number of iteration steps is specified after which the calculation will stop and the improvements are visually examined. Finally, the engineers have to check the quality of the solutions and disqualify solutions which do not make physical sense.
2.2 Background
The above described process design & optimisation methodology has been applied to study the Wood-to-SNG process in [31, 33]. Gassner and Maréchal [33] developed a superstructure based process design model to investigate the Wood-to-SNG process with the afore described multi-objective optimisation methodology. The corresponding superstructure is illustrated in figure 2.3 and considers seven subsystems which are:
• Drying (of the biomass)
• Thermal Pretreatment (of the biomass)
• Gasification
• Gas Cleaning
• Synthesis Preparation (also referred as gas conditioning)
• Methane Synthesis
• SNG Upgrading
• Utility and Heat Recovery System
Each of these subsystems includes a certain number of alternative unit technology models which are combined to an applicable process design by presetting decision variables of the superstructure.
A central subsystem is the methane synthesis step. The fluidised bed methanation reactor which is one of the considered technology options is developed at PSI. The properties of the gas feed of the methanation reactor together with the hydrodynamic properties of the fluidised bed are the major concern of the engineers developing the fluidised bed methanation technology. Impurities like sulphur compounds, tars, olefins and inorganic contaminants are causes of catalyst deactivation. A not less important aspect are the bulk compounds in the gas
F IG U R E 2 .3 : P roc ess su perst ruc tu re dev elope d b y G assn er an d M a réchal [3 3 ] in clu din g ma in pr oce ss str eams w ithout re cyc li ng loo p s. G roups of technol og y alt ern ativ es fo r the defined pr ocess subsy stems and additi onal opt ional p roce ss u ni ts ar e ill ust rated. R ep rin ted fr om G assn er and M a réchal [33 ], Copy right (20 09 ), with permi ssion fr om E lsevie r