The following full text is a publisher's version.
For additional information about this publication click this link.
http://hdl.handle.net/2066/191598
Please be advised that this information was generated on 2018-06-17 and may be subject to
change.
Kaman Chung
risk estimation of
Financial support for publication of this thesis was kindly provided by the Faculty of Science, Radboud University Nijmegen and ChipSoft.
ISBN
978-94-028-1057-8 Design/lay-out
Promotie In Zicht, Arnhem Print
Ipskamp Printing, Enschede © Kaman Chung, 2018
All rights are reserved. No part of this book may be reproduced, distributed, stored in a retrieval system, or transmitted in any form or by any means, without prior written permission of the author.
Proefschrift
ter verkrijging van de graad van doctor aan de Radboud Universiteit Nijmegen
op gezag van de rector magnificus prof. dr. J.H.J.M. van Krieken, volgens besluit van het college van decanen
in het openbaar te verdedigen op dinsdag 12 juni 2018 om 16:30 uur precies door Kaman Chung geboren op 5 oktober 1988 te Enschede
of subsolid nodules
Copromotor Dr. ir. C. Jacobs
Manuscriptcommissie Prof. dr. M.M. Rovers Prof. dr. J. Bussink
Prof. dr. C.M.L. van Herpen
Dr. L.J.M. Kroft (Leids Universitair Medisch Centrum)
Chapter 1 Transient or persistent
1.1 Introduction
1.2 Materials and Methods
1.3 Results 1.4 Discussion 21 23 24 28 33 Chapter 2 Lung-RADS 4X 2.1 Introduction
2.2 Materials and Methods
2.3 Results 2.4 Discussion 37 39 40 43 46
Chapter 3 Malignancy estimation
3.1 Introduction
3.2 Materials and Methods
3.3 Results 3.4 Discussion 53 55 56 58 61
Chapter 4 Growth model
4.1 Introduction
4.2 Materials and Methods
4.3 Results 4.4 Discussion 67 69 70 72 79
Chapter 5 Automatic classification of nodule types
5.1 Introduction
5.2 Materials and Methods
5.3 Results 5.4 Discussion 83 85 88 94 98
Chapter 6 Validation in a clinical setting
6.1 Introduction
6.2 Materials and Methods
6.3 Results 6.4 Discussion 105 107 108 111 113 General Discussion 119 Summary 131 Samenvatting 139 Publications 145 Bibliography 151 Acknowledgements 163 Curriculum Vitae 171
General Introduction
Lung cancer is the number one cause of cancer death in the world, with an estimated 1.8 million new diagnoses worldwide and 1.6 million deaths annually1. In 2016, 10,674
deaths out of 148,997 total deaths in a population of around 17 million in the Netherlands were caused by lung cancer2. Symptoms usually occur when the cancer
is in an advanced stage when treatment options are limited, hence it is no surprise that the 5-year survival rate for all stages combined in lung cancer is only 17%3.
Detecting suspicious lesions in an early stage would considerably improve overall lung cancer survival. Lung cancers often start as a nodule. Based on imaging appearance, several nodule types are described and include solid nodules, perifissural nodules, and subsolid nodules.
This thesis focuses on subsolid pulmonary nodules. Before the start of lung cancer screening trials, subsolid nodules were a relatively unknown and unrecognized entity among radiologists. Often described as focal infectious disease or simply missed on chest CT scans, subsolid nodules were not receiving much attention in the clinical setting. A few researchers speculated about the association between the adenocarcinoma spectrum and subsolid nodules in the early 1990s4,5. In 2002
Henschke et al.6 confirmed the importance and dilemmas associated with subsolid
nodules for the first time, based on results from one of the first lung cancer screening studies using CT. The authors discovered that although subsolid nodules were less frequently seen than solid nodules, the relative malignancy rate was considerably higher. These results marked a new era of research and the beginning of numerous publications about subsolid nodules, including this thesis.
What are subsolid nodules?
Pulmonary nodules are defined as “a rounded or irregular opacity, well or poorly
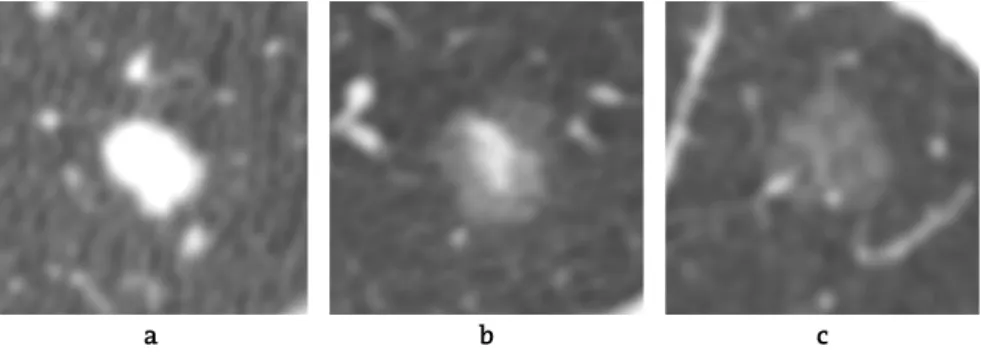
defined, measuring up to 3 cm in diameter”7. Pulmonary nodules can be solid or subsolid, and either benign or malignant. The group of subsolid nodules is divided into two subcategories: nonsolid (synonym: pure ground-glass nodules) and part-solid (consisting of both a ground glass and a solid component, Figure 1). On a chest CT scan, ground-glass is defined as a focal area of slightly increased CT
attenuation (‘hazy’) where the normal lung parenchyma, vessels and airways are
still visible8. Solid, on the other hand, describes an area of increased attenuation
that obscures underlying parenchymal architecture including vessels. Nodule attenuation correlates pathologically with the filling of the alveolar lumen and the thickness of the alveolar walls: complete filling with fluid and / or cells corresponds to the attenuation of solid, while incomplete filling and areas of
Lung cancer screening
In 2010 the National Lung Screening Trial (NLST) released its results10. The NLST
was a randomized controlled trial in the United States with 26,722 high-risk participants in the low-dose chest CT arm and 26,732 in the control group (chest X-Ray). The results showed, for the first time, that using low-dose CT as a screening tool lead to a relative lung cancer mortality reduction of 20% after 7 years of follow-up. Smaller randomized trials of low-dose chest CT screening have been
conducted or are being conducted at this moment11–15. So far no other completed
European trial has shown a significant decrease in mortality from lung cancer using CT as a screening tool.
Irrespective of their final outcome, these screening trials have greatly contributed to our knowledge about subsolid nodules, most importantly with regards to frequency, persistence and malignancy risk. The percentage of screen-detected pulmonary nodules which are subsolid varies from 2% to 20%
according to the literature6,16,17. The exact prevalence of incidental (clinical)
subsolid nodules is not exactly known. However, several studies reported a lower mean general nodule prevalence of 13% for all types of incidental nodules, but with a comparable lung cancer prevalence to screen-detected nodules (1.5% and
1.4% respectively)18. Thus, the vast majority of all nodule types is actually benign.
The biggest challenge in either a screening or a clinical setting is to find the least invasive, most effective and accurate way to discriminate between potentially malignant and eventually benign nodules. This holds true for both solid and subsolid nodules. Current nodule management uses CT follow-up as a non-invasive tool to discriminate between growing or stable and between persistent or vanishing lesions.
Figure 1
CT images of the three subtypes of pulmonary nodules:(a) solid (b) partsolid and (c) nonsolid.
This, however, involves costs and radiation dose, increases radiologists work - load and last but not least represents a various degree of psychological stress for the patient. Any increase in knowledge about the biological behavior of nodules and the correlation between nodule biology and imaging characteristics will therefore contribute to the optimization process of nodule management.
CT as imaging biomarker: what does that mean?
Around 40% of all diagnosed lung cancers represent adenocarcinomas19. The term
adenocarcinomas refers to a group of histological subtypes with different biological behavior. Subsolid nodules have been shown to be precursors of a
subgroup of adenocarcinomas (Figure 2)9,19. The latest IASCLC/ATS/ERS 2011
classification of adenocarcinomas differentiate pre-invasive precursors such as atypical adenomatous hyperplasia (AAH) and adenocarcinoma in situ (AIS), from
minimally invasive adenocarcinoma (MIA) and invasive adenocarcinoma (IA)8.
These new guidelines marked the end of the term “bronchioloalveolar carcinoma”
(BAC) that would correspond more or less to AIS and MIA according to the new classification.
Studies with radiological pathological correlation found a high association between CT morphology and histological subtype of invasiveness, proving that
CT can be used as an “imaging biomarker”20–22. It is generally accepted that pre -
invasive lesions correspond to pure ground glass lesions and a new or growing
solid component correlates with the degree of invasiveness20. A solid component
smaller than 6 mm in diameter has been adopted as a threshold to non-invasively differentiate between the likelihood of being a minimally invasive or an invasive
adenocarcinoma23–25.
Figure 2
CT images of a part-solid nodule over time, developing into an invasiveadenocarcinoma. Both the lesion and the solid core are showing growth.
Persistent versus temporary subsolid nodules: role of morphology
The same way that solid nodules can have a benign character (e.g., hamartoma, granuloma), subsolid nodules can be benign or have a malignant potential. The differential diagnosis of benign subsolid nodules is long and includes focal fibrosis, focal bleeding or a granulomatous nodule within sarcoidosis or granulomatous vasculitis. Still, by far the most frequent benign reason for
developing a subsolid nodule is a focal infection8,26. Infections are by definition
temporary, thus longitudinal information over time (“does the lesion disappear?”)
is the most effective and easiest way to securely exclude a potential malignancy. Focal peribronchial infections - presenting as subsolid nodules - are a frequent finding for example in patients with chronic obstructive pulmonary disease (COPD) and chronic airways disease, thus a subgroup of patients with also an increased risk for developing a lung malignancy. According to the literature 38%
- 70% of subsolid nodules turn out to be transient26–28. This wide range is related
to the selection criteria and thus the composition of the study groups, but it
illustrates the “size of the problem”.
Morphologic features that would allow for prospective discrimination between transient (lesions that disappear over time, and are thus benign) and persistent (lesions that persist over time, might become malignant) subsolid nodules would be therefore of added value in improving nodule management. Examples of morphologic features used to describe solid nodules are spiculated (spikes on the surface of the nodule), lobulated (undulated contour of the border), or the definition of border sharpness. However, unlike their solid counterpart, subsolid nodules do not have well established morphologic features predictive of malignancy or persistence. Given the fact that earlier reports could show that not all persistent subsolid nodules necessarily develop into a malignancy and
follow-up periods of several years are needed10, it would be especially beneficial
to find features to discriminate between benign and malignant subsolid nodules.
What do current guidelines recommend for management of
subsolid nodules?
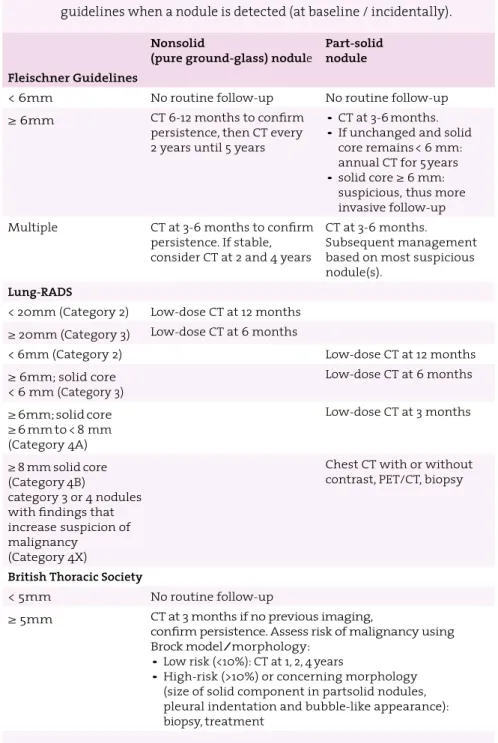
There are several guidelines that guide the nodule management for a clinical and / or screening setting. The most important are:
1. Guidelines by the Fleischner Society, an international, multidisciplinary medical society for thoracic radiology.
2. The Lung-RADS, developed by the American College of Radiology (ACR) 3. The British Thoracic Society (BTS) Guidelines
The Fleischner Society Guidelines are intended for incidental nodules and were
updated in 201725. Compared to the previous guidelines from 201329, the biggest
change for subsolid nodules is the longer period before initial follow-up and increased total period of follow-up. The Fleischner Guidelines have adapted its guidelines to take into account the new knowledge that subsolid nodules grow slowly and thus need to be followed up for a longer period of time.
At present the Fleischner Guidelines have the same size thresholds for the partsolid nodules as the Lung-RADS (2014). Lung-RADS is a categorical scoring
system for chest CT scans and is intended for screen-detected nodules30. Both
Lung-RADS and the Fleischner Guidelines advise for a more invasive workup if the nodule appears suspicious. For nonsolid nodules Lung-RADS defines a high threshold of 20 mm - larger than implemented in Fleischner - to trigger a yearly follow-up.
Both, Fleischner and Lung-RADS allow for “exceptions of the rule” and recommend
more intense work up, if the nodule is deemed to be suspicious by the radiologists. This procedure is more formalized in Lung-RADS: for nonsolid nodules > 20 mm
and part-solid nodules ≥ 6 mm there is a special “category 4X” that warrants a
more intense workup based on the radiologist’s subjective judgment: “category 3
or 4 nodules with additional features or imaging findings that increases the suspicion of malignancy” may be upgraded to this category 4X.
The British Thoracic Society released their new guidelines in 2015, intended for both clinical and screening use. Instead of size and nodule type based categories to recommend management, this is the only current guideline that includes a mathematical prediction model (further explained in next section) to assess risk of malignancy as a first instance. The guideline adapts management according to the individual nodule malignancy probability as determined by the
prediction model18. In this guideline a few predefined suspicious morphologic
features may lead to a more invasive management. A summary of the guidelines can be found in Table 1.
Since there are differences in growth and malignancy rate between part-solid and nonsolid nodules, all guidelines make a distinction between the two nodule types in terms of nodule management. Most guidelines also distinguish between solid, part-solid and nonsolid nodules, and depending on size and presence of suspicious features, a different workup work is recommended for each type. Thus, the underlying classification of the type of nodule - as determined by visual assessment of the radiologist - is crucial for the workup recommendation.
We know, however, from several studies that radiologists have a high inter- observer variability when it comes to nodule type classification. In this aspect, automatic classification of nodule types could be very advantageous. In the past few years, artificial intelligence systems based on deep learning algorithms have
Table 1
Summary of nodule management recommendations by three guidelines when a nodule is detected (at baseline / incidentally).Nonsolid
(pure ground-glass) nodule Part-solid nodule Fleischner Guidelines
< 6mm No routine follow-up No routine follow-up
≥ 6mm CT 6-12 months to confirm
persistence, then CT every 2 years until 5 years
• CT at 3-6 months. • If unchanged and solid
core remains < 6 mm: annual CT for 5 years • solid core ≥ 6 mm:
suspicious, thus more invasive follow-up
Multiple CT at 3-6 months to confirm
persistence. If stable, consider CT at 2 and 4 years
CT at 3-6 months. Subsequent management based on most suspicious nodule(s).
Lung-RADS
< 20mm (Category 2) Low-dose CT at 12 months ≥ 20mm (Category 3) Low-dose CT at 6 months
< 6mm (Category 2) Low-dose CT at 12 months
≥ 6mm; solid core < 6 mm (Category 3) Low-dose CT at 6 months ≥ 6mm; solid core ≥ 6 mm to < 8 mm (Category 4A) Low-dose CT at 3 months ≥ 8 mm solid core (Category 4B) category 3 or 4 nodules with findings that increase suspicion of malignancy (Category 4X)
Chest CT with or without contrast, PET/CT, biopsy
British Thoracic Society
< 5mm No routine follow-up
≥ 5mm CT at 3 months if no previous imaging,
confirm persistence. Assess risk of malignancy using Brock model/morphology:
• Low risk (<10%): CT at 1, 2, 4 years
• High-risk (>10%) or concerning morphology (size of solid component in partsolid nodules, pleural indentation and bubble-like appearance): biopsy, treatment
become a field of high interest in the medical world because of the significant performance improvement over classical machine learning systems. In our case, it might allow for an automatic detection and classification of nodules on CT, matching or eventually even surpassing the performance of experienced radiologists. This kind of system processes CT data containing a nodule, without the necessity of adding any additional information such as nodule features or nodule segmentation. Instead, the system learns by comparison with labeled examples (e.g. benign and malignant) through iterations of gradient descend
based algorithms, instead of defining features beforehand31. It is likely that
introducing such systems will standardize and improve the application of guidelines in clinical practice in the future.
Prediction models
Clinical prediction models can be used to assess the probability of malignancy in pulmonary nodules detected by CT. There are several known prediction models,
which were developed on a relatively small population32–34. The first mathematical
model (Brock model) that was developed using a large cohort of screening data
was published in 2013 by McWilliams et al.17. Variables in the model include age,
sex, family history of lung cancer, emphysema, nodule size, lobe location, nodule count and spiculation. The model was then validated on an external screening data set, and showed an excellent discrimination for the prediction of lung cancer in both development and validation data. Hence, various nodule management guidelines recommend this risk calculator as a tool to initially assess a nodule,
both in a screening setting and clinical routine setting18,30. However, it is yet to be
confirmed whether these model works equally well in a clinical routine population.
Thesis Outline
Nodule management largely depends on the associated malignancy risk: the more accurate the risk assessment, the more individualized and thus effective nodule management can be adapted. The goal of this thesis is therefore to gain more knowledge about the individual risk estimation of subsolid nodules.
In part I (chapter 1 and 2) the focus lies on the radiologists’ visual assessment
of morphological characteristics of screen-detected subsolid nodules. Are radiologists able to differentiate transient and persistent lesion character and correctly select
high-risk nodules? Thirdly (chapter 3) we test whether the thresholds of lesion
size as implemented in the current Lung-RADS, correctly reflect the malignancy risk for subsolid nodules in the lowest and the highest risk category.
In part II (chapter 4 and 5) the focus lies on how mathematical prediction models and automatic classification can improve the management of subsolid nodules, but also nodules in general. Can we improve current logistic prediction models for a better prediction of malignancy rate in subsolid nodules? Can artificial intelligence play a role in the management of nodules by classifying nodule types?
Last but not least in Part III (chapter 6), we focus whether the results found in
screening studies, can be directly transferred to a clinical population and evaluate the Brock model - mathematically developed and evaluated using screening data - on a large heterogeneous clinical data set.
Part I: Visual assessment of subsolid nodule characteristics
In chapter 1 we take a step back from benign versus malignant and instead we
investigate whether radiologists are able to conclude from CT morphology alone whether a subsolid nodule is persistent or transient and more specific, which morphologic features are used for this discrimination. Establishing morphologic features that reliably differentiate the transient from the persistent (and thus possibly malignant) nodules could be used to reduce the number of follow-up CT scan that have to be acquired.
In chapter 2 we investigate whether Lung-RADS category 4X is of added value
in the prediction of malignancy in subsolid nodules. As mentioned, category 4X is the so-called ’Fingerspitzengefühl’ category. But does it work? If radiologists upgrade many benign nodules into this category, many patients would undergo more unnecessary, more expensive or even invasive workup such as a PET scan or biopsy. Thus, we calculated the malignancy rate of upgraded 4X nodules, compared to the regular size-based categories.
In chapter 3 we compare the possible underestimation of malignancy risk in
the lowest size-based Lung-RADS category 2 versus the overestimation in the highest size-based category 4B. Nodules of category 2 are considered as having a “benign appearance or behavior” with a malignancy probability of < 1%. Though known for its indolent behavior of subsolid nodules, studies have shown that nonsolid nodules may actually represent invasive adenocarcinomas, especially
when the lesion is larger than 10 mm35,36. At the other end of the risk spectrum
category 4B represents the group with a malignancy probability of > 15%. Part-solid
nodules ≥ 8 mm are categorized 4B. Lung-RADS does not contain a short-term
follow-up to confirm persistence, thus making this category susceptible to overestimation because of the overlap with transient (infectious) nodules. In this chapter we investigate to which extent these two categories reflect the proper risk malignancy and appropriate management recommendations for subsolid nodules.
Part II: Mathematical prediction models and automatic
classification of subsolid nodules
In chapter 4 the Brock prediction model is specifically tested on subsolid nodules.
As we know, in the Brock model development and validation data the majority of the nodule were solid. Since subsolid nodules have different characteristics compared to solid nodules, especially with regards to growth, we investigated whether the Brock model also has high discriminative power in subsolid nodules specifically. The second question was whether the accuracy of the Brock model
could be improved byadding the longitudinal information of a second scan with
respect to presence and extent of (short-term) nodule growth.
In chapter 5 we investigate whether more advanced computerized systems
can improve the classification of nodule type, mainly part-solid and nonsolid, solid and perifissural nodules. From literature we know that there is a high
inter-reader variability when it comes to classifying nodule types37. However,
current guidelines all make a distinction between nodule type in the management of nodules. Hence, it is an essential part of the nodule workup recommendations. In this chapter a deep learning based computer system is presented that can automatically classify all nodule types relevant to the nodule workup.
Part III: Risk prediction models for pulmonary nodules: transition
from screening to clinical setting
Lastly, chapter 6 focusses on the clinical population. With the ever-growing
number of CTs and improving software, more and more incidental pulmonary
nodules are found on regular chest CT38. The Brock prediction model with external
validation is recommended to be used as an initial risk estimator in the British Thoracic Society guidelines. However, the model has been developed on screening data. In this chapter we therefore focus on the Brock model and its validation on a much more heterogeneous clinical chest CT scan population with a range of possible comorbidities, which a radiologist would come across in his/her daily routine work.
Transient or persistent
K. Chung, F. Ciompi, E.T. Scholten, J.M. Goo, M. Prokop, C. Jacobs, B. van Ginneken, C.M. Schaefer-Prokop
Original title: Visual Discrimination of Screen-detected Persistent from Transient Subsolid Nodules: an Observer Study
Published in: PLoS One.2018 Feb 13;13(2):e0191874
1
Abstract
Purpose: To evaluate whether, and to which extent, experienced radiologists are
able to visually correctly differentiate transient from persistent subsolid nodules from a single CT examination alone and to determine CT morphological features to make this differentiation.
Materials and methods: We selected 86 transient and 135 persistent subsolid
nodules from the National Lung Screening Trial (NLST) database. Four experienced radiologists visually assessed a predefined list of morphological features and gave a final judgment on a continuous scale (0-100). To assess observer performance, area under the receiver operating characteristic (ROC) curve was calculated. Statistical differences of morphological features between transient and persistent lesions were calculated using Chi-square. Inter-observer agreement of morphological features was evaluated by percentage agreement.
Results: Forty-nine lesions were excluded by at least 2 observers, leaving 172
lesions for analysis. On average observers were able to differentiate transient
from persistent subsolid nodules ≥ 10 mm with an area under the curve of 0.75
(95% CI 0.67- 0.82). Nodule type, lesion margin, presence of a well-defined border, and pleural retraction showed significant differences between transient and persistent lesions in two observers. Average pair-wise percentage agreement for these features was 81%, 64%, 47% and 89% respectively. Agreement for other morphological features varied from 53% to 95%.
Conclusion: The visual capacity of experienced radiologists to differentiate
persistent and transient subsolid nodules is moderate in subsolid nodules larger than 10 mm. Performance of the visual assessment of CT morphology alone is not sufficient to generally abandon a short-term follow-up for subsolid nodules.
1
1.1 Introduction
Results of lung cancer screening Computed Tomography (CT) studies revealed the importance of subsolid nodules as potential early adenocarcinomas. In the Early Lung Cancer Action Project (ELCAP) study the prevalence of subsolid nodules was found to be lower compared to solid nodules. However, subsolid nodules demonstrated a higher malignancy rate of 34% (15/44) compared to 7% (14/189) for
solid nodules6. Another study evaluating a group of clinically and screen-detected
lesions even reported 81% (43/53) of resected subsolid nodules to be (pre)
malignant39.
The most frequent benign disease causing subsolid nodules is a focal infection8,26.
Other more rare underlying benign diseases are a focal organizing pneumonia or
focal fibrosis40,41. Subsolid nodules caused by infection will eventually disappear.
Differentiation of transience versus persistence of subsolid nodules thus represents the first diagnostic task to discriminate between benign and potentially malignant lesions, and a short-term three months follow-up has been recommended by the
Fleischner Society and the British Thoracic Society18,29. The percentage of subsolid
nodules detected in screening studies varied from 2% to 20% of all baseline
screen-detected non-calcified nodules6,16,17. Prospective discrimination of transient
from persistent lesions would therefore contribute to the reduction of follow-up CTs. Previous studies on this subject evaluated the contribution of texture analysis
and clinical features but did not assess human observer performance27,28,42.
The only other morphological feature used for risk prediction of subsolid nodules besides persistence and lesion growth, is nodule size and the presence/
size of a solid component17,30. For solid nodules spiculation is an important
predictor of malignancy in a recently published (screening) risk model17. However,
for subsolid nodules no additional morphological features have been established. Defining morphological features for transient and persistent subsolid nodules would be a valuable first step.
The purpose of this study was therefore to evaluate whether and to which extent experienced radiologists would be able to differentiate transient from persistent subsolid nodules from a single CT examination alone by visual analysis. Secondly we aimed to identify which morphological features are used by the radiologists to make this differentiation.
1.2 Materials and Methods
Study population
We recruited subsolid nodules from the National Lung Screening Trial (NLST). The NLST was approved by the institutional board at each participating medical institution and participants provided written informed consent before
randomization43. In total, the NLST had 26,722 participants. Of those, 3194
participants had at least one subsolid nodule annotated by the NLST screening radiologist in any of the 3 screening rounds. Nine participants did not have any scans available, leaving 3185 participants for further analysis.
For this observer study, we used baseline (year 0) subsolid nodules only. The NLST annotations did not contain year-to-year linking between the same lesions, therefore we re-annotated all lesions by using information from the NLST database (slice number, nodule type, lobe location, size). Annotations were done by two medical students and one medical researcher using in-house software (CIRRUS Lung Screening, Diagnostic Image Analysis Group, Radboud University Medical Center, Nijmegen, the Netherlands). A subsolid nodule was defined as transient if the nodule had disappeared on follow-up CT. A subsolid nodule was defined as persistent if the nodule remained visible on follow-up CT.
Subsequently, we only selected CTs with a slice thickness of ≤ 2 mm, to ensure
the quality of the coronal and sagittal projections of the lesions. As morphology is more difficult to assess in smaller lesions and thicker slices, we only selected
lesions ≥ 10 mm (rounded average diameter) in this observer study. In total 232
subsolid lesions were eligible for our study. Eleven lesions (11/232, 4.7%) could not be located on the scans. Thus, our final database for the observer study contained 221 subsolid lesions.
Observer study
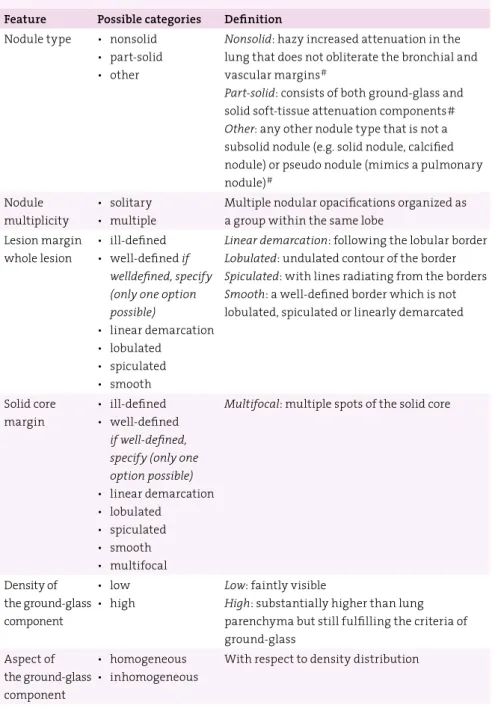
All study lesions were independently evaluated by four experienced radiologists (ETS, CSP, MP, and JMG). All of them had > 15 years of experience in reading chest CTs and had extensive experience with evaluating screen-detected nodules. Nodules were presented in a random order to each observer. Observers were asked to score the morphological nodule features using a predefined list. The list of morphological features as well as the definitions can be found in Table 1.1. In addition, they were asked to estimate the probability that the lesion was persistent on a scale between 0 and 100, with 0 representing certainly transient and 100 representing certainly persistent.
1
Table 1.1
List of morphological features scored by each observer.For all features one category had to be chosen obligatorily.
Feature Possible categories Definition
Nodule type • nonsolid • part-solid • other
Nonsolid: hazy increased attenuation in the
lung that does not obliterate the bronchial and vascular margins#
Part-solid: consists of both ground-glass and
solid soft-tissue attenuation components#
Other: any other nodule type that is not a
subsolid nodule (e.g. solid nodule, calcified nodule) or pseudo nodule (mimics a pulmonary nodule)#
Nodule multiplicity
• solitary • multiple
Multiple nodular opacifications organized as a group within the same lobe
Lesion margin whole lesion
• ill-defined • well-defined if
welldefined, specify (only one option possible)
• linear demarcation • lobulated
• spiculated • smooth
Linear demarcation: following the lobular border
Lobulated: undulated contour of the border
Spiculated: with lines radiating from the borders
Smooth: a well-defined border which is not
lobulated, spiculated or linearly demarcated
Solid core margin
• ill-defined • well-defined
if well-defined, specify (only one option possible) • linear demarcation • lobulated • spiculated • smooth • multifocal
Multifocal: multiple spots of the solid core
Density of the ground-glass component
• low • high
Low: faintly visible
High: substantially higher than lung parenchyma but still fulfilling the criteria of ground-glass Aspect of the ground-glass component • homogeneous • inhomogeneous
Reading methodology
A reading workstation designed to optimize workflow and to document the scoring data was used (CIRRUS Observer, Diagnostic Image Analysis Group, Radboud University Medical Center, Nijmegen, the Netherlands). After opening a case, a magnified axial view of the nodule under evaluation was centered in the middle of the display. Coronal/sagittal projections were available on the right side of the screen (Figure 1.1). The position of the magnified view was indicated by center lines on the smaller views. Using this set-up, observers did not have to search for the lesion. For all cases, the full 3D CT dataset was available for evaluation. All views could be (de)magnified. A standard lung window with a width of 1500 HU and a center of -650 HU was used as a default but could be adjusted if necessary. Nodule diameters were measured manually using electronic calipers.
The morphological features to be scored were listed on the left side of the monitor display. Scoring had to be completed before the next lesion could be displayed. Observers were allowed to place any comments if needed. No specifications with respect to comments were made prospectively. Lesions indicated in the comments for exclusion by 2 or more observers were omitted for further analysis. No information about follow-up appearance, persistence or any other outcome was provided.
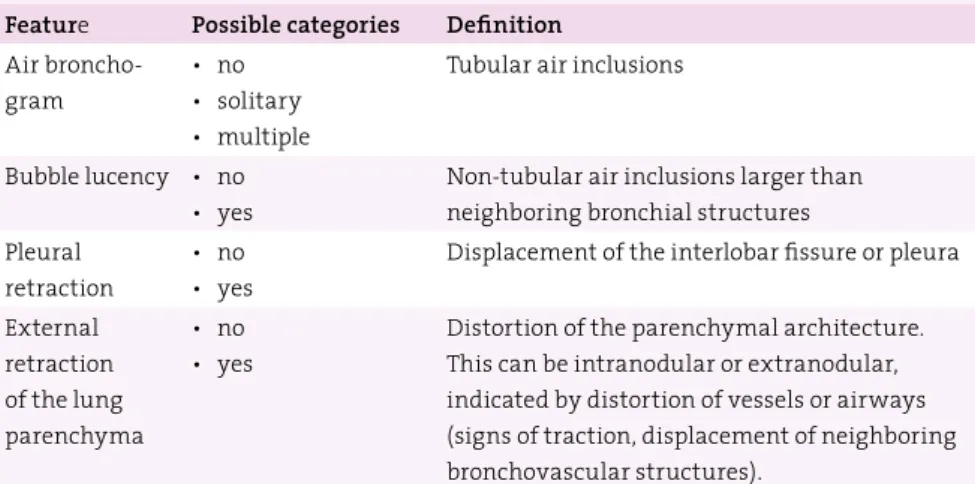
Table 1.1
List of morphological features scored by each observer.For all features one category had to be chosen obligatorily.
Feature Possible categories Definition
Air broncho-gram
• no • solitary • multiple
Tubular air inclusions Bubble lucency • no
• yes
Non-tubular air inclusions larger than neighboring bronchial structures Pleural
retraction
• no • yes
Displacement of the interlobar fissure or pleura External retraction of the lung parenchyma • no • yes
Distortion of the parenchymal architecture. This can be intranodular or extranodular, indicated by distortion of vessels or airways (signs of traction, displacement of neighboring bronchovascular structures)..
1
Statistical Analysis
Receiver Operating Characteristic (ROC) analysis was performed for each observer.
Areas under the curve (Az) were calculated to determine the ability to differentiate
between transient and persistent lesions. We did not take into account within participant correlation of participants with multiple nodules because multiple
nodules in a participant were considered as multiple independent nodules44,45.
Univariate analysis (Chi-square) per observer was used to assess whether a certain morphological feature was scored significantly different in transient or
persistent nodules. P-values < 0.05 were considered significant. Inter-observer
agreement for each CT morphological feature was investigated by calculating percentage agreement for each pair of observers. Statistical analyses were performed using SPSS, version 20.0 (SPSS, Chicago, Ill).
Figure 1.1
1 Reading workstation. The morphological features to be scored werelisted on the left side of the monitor display. At the bottom there were two text fields to enter the probability (0-100) and any comments. A magnified axial view of the nodule under evaluation was centered in the middle of the display. Coronal/ sagittal projections were available on the right side of the screen, display size of the three projections was interchangeable. Processing tools such as windowing and magnification as well the full 3D CT dataset were available at any time.
1.3 Results
Study group
Of all lesions 61% (135/221) were persistent. The median average diameter of persistent lesions was 12.0 mm (IQR 10.0 - 15.0 mm). Accordingly, 39% (86/221) were transient and had a median average diameter of 12.0 mm (IQR 11.0 - 16.5 mm). forty-nine lesions were excluded from further data analysis because at least 2 of the 4 observers had made the comment that the opacification under review, which had been marked as subsolid nodule in the NLST database, would in fact not represent a nodular (subsolid) opacification when taking all three planes into consideration. Comments leading to exclusion were not a nodule (N = 11), solid lesion (N = 8), wall of emphysema (N = 3), apical scarring, (N = 7), fibrosis (N = 5) and (plate-like) atelectasis (N = 15). Thus the final study group consisted of 172 subsolid lesions (101 persistent, 71 transient).
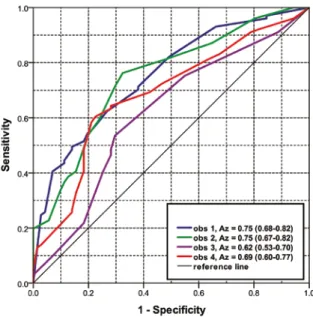
Figure 1.2
Receiver Operating Characteristic (ROC) curves for observer 1, 2, 3 and4 to predict the persistence of the subsolid lesions ≥10 mm. Az(Areas Under the
1
Discrimination of persistent from transient nodules
Observer 1 to 4 separately achieved an Az for discriminating persistent from
transient subsolid nodules of 0.75 (95% CI 0.68-0.82), 0.75 (95% CI 0.67-0.82), 0.62 (95% CI 0.53-0.70) and 0.69 (95% CI 0.60-0.77), respectively (Figure 1.2).
Considering the score of 50 as a threshold for discriminating between transience (scores 0-50) and persistence (scores 51-100), the four observers correctly identified 58/71 (82%), 63/71 (89%), 51/71 (72%) and 55/71 (77%) transient lesions. The observers correctly identified 52/101 (51%), 37/101 (37%), 47/101 (47%) and 61/101 (60%) persistent nodules, respectively.
Taking the same thresholds for transience (0-50) and persistence (51-100), all four observers agreed on the same classification in 105 of the 172 nodules (61%). 68 of these 105 nodules (65%) were correctly classified, and 37 of the 105 nodules (35%) were misclassified by all four observers. Thirty of the correctly classified nodules were persistent and 38 were transient. Figure 1.3 and 1.4 show examples
Figure 1.3
(a) Correctly identified transient lesion with a probability score of ≤ 40by all four observers (b) Correctly identified persistent lesion with a probability
score of ≥ 70 by all four observers (c) Incorrectly identified lesion by majority of
observers: transient lesion, but scored as persistent (probability score ≥ 60) (d)
Incorrectly identified lesion by majority of observers: persistent lesion, but scored
as transient (probability score ≤ 40).
a
c
b
of correctly and incorrectly identified lesions for which all or the majority of observers agreed on the classification.
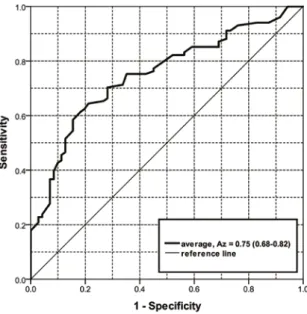
Averaging the scores of the four observers resulted in an Azof 0.75 (95% CI 0.68-
0.82) (Figure 1.5). Using the average scores a sensitivity of > 90% for persistent lesions was only achieved at the expense of a specificity of < 30% (e.g., sensitivity/ specificity is 91% / 28%).
Morphology assessment: univariate analysis
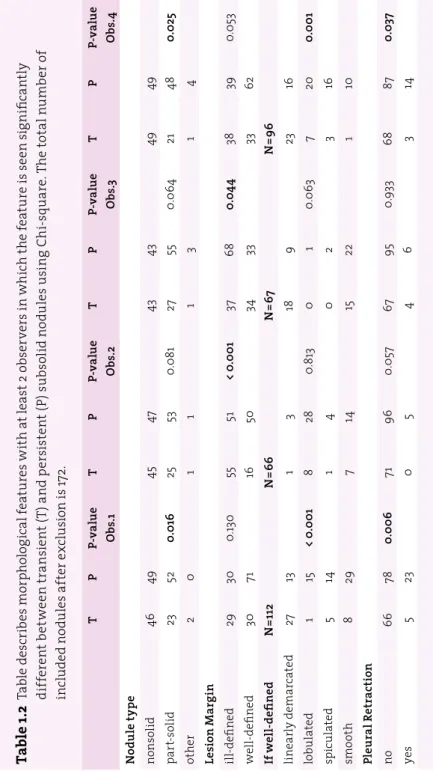
Morphological features that showed significant difference between transient and
persistent in at least 2 observers are listed in table 1.2. At a significance level of p
< 0.05, nodule type and lesion margin were scored significantly different by 2
observers (p = 0.016 and p = 0.025, p = 0.001 and p = 0.044 respectively). Part-solid
nodules were more often seen in persistent lesions compared to transient lesions in all observers, reaching statistical significance in two of them. The subcategory
of a well-defined border yielded significant difference in 2 observers (p < 0.001 and
p < 0.001). Linear demarcation following the lobular border was the only feature
in this category to be seen more often in transient lesions in three observers. Lobulated, spiculated and smooth borders were scored more often in persistent lesions. Pleural retraction was observed more frequently in persistent than
transient lesions reaching significance in two observers (p = 0.006, p = 0.037).
Table 1.2: Table describes morphological features with at least 2 observers in
which the feature is seen significantly different between transient (T) and persistent (P) subsolid nodules using Chi-square. The total number of included nodules after exclusion is 172.
Figure 1.4
(a) A transient lesion with disagreement (2 versus 2) among observers(b) A persistent lesion with disagreement (2 versus 2) among observers.
1
Ta
ble 1
.2
T ab le d es cr ib es m or ph ol og ic al f ea tu re s w ith a t l ea st 2 o bs er ve rs i n w hi ch t he f ea tu re i s s ee n sig ni fic an tly di ff er en t b et w ee n t ra nsi en t ( T) a nd p er si st en t ( P) s ub so lid n od ul es u si ng C hi -s qu ar e. T he t ot al n um be r o f in cl ud ed n od ul es a ft er e xc lu sio n i s 1 72 . T P P-v al ue Obs .1 T P P-v al ue Ob s.2 T P P-v al ue Ob s.3 T P P-v al ue Ob s. 4 N od ul e t yp e no ns ol id 46 49 45 47 43 43 49 49 pa rt-so lid 23 52 0. 016 25 53 0. 08 1 27 55 0. 06 4 21 48 0. 025 ot he r 2 0 1 1 1 3 1 4 Le si on M ar gi n ill-de fine d 29 30 0. 13 0 55 51 < 0 .0 01 37 68 0. 04 4 38 39 0. 05 3 we ll-de fin ed 30 71 16 50 34 33 33 62 If w el l-d efi ne d N =1 12 N =66 N =67 N =96 lin ea rly d em arc at ed 27 13 1 3 18 9 23 16 lo bu la te d 1 15 < 0 .0 01 8 28 0. 813 0 1 0. 063 7 20 0. 00 1 sp ic ul at ed 5 14 1 4 0 2 3 16 smo ot h 8 29 7 14 15 22 1 10 Pl eu ra l R etr ac tio n no 66 78 0. 00 6 71 96 0. 05 7 67 95 0.9 33 68 87 0. 03 7 ye s 5 23 0 5 4 6 3 14Inter-reader variability of morphology
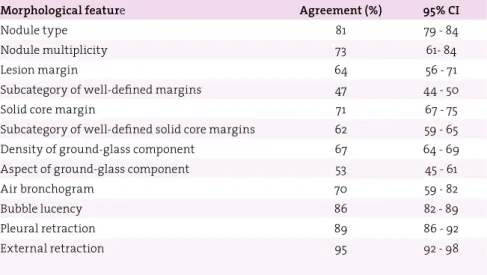
Average pair-wise percentage agreement was highest in external retraction, pleural retraction and bubble lucency (95%, 89%, and 86% respectively). Nodule type had an agreement of 81%, followed by nodule multiplicity (73%), solid core margin (71%) and presence of an air-bronchogram (70%). Lower agreement was found in density of ground-glass component (67%), lesion margin (64%) and the subcategory of a well-defined solid core margin (62%). Lowest agreement was found for aspect of ground-glass component (53%) and the subcategory of a well-defined lesion margin (47%). The average pair-wise agreement and the 95% confidence intervals can be found in Table 1.3.
Figure 1.5
Receiver Operating Characteristic (ROC) curves for the average of all four1
1.4 Discussion
The most frequent cause of transient subsolid nodules is a focal infection. A persistent subsolid nodule, however, is potentially malignant and requires follow-up or alternative diagnostic workup. A prospective estimation of whether the lesion would be persistent or transient would aid in reducing unnecessary follow-ups. This is the first study assessing the performance of human visual analysis for predicting the likelihood of persistence in subsolid nodules.
Results of our study indicate that experienced radiologists are at best only
moderately able (average Azof all readings 0.75) to visually differentiate transient
from persistent character in subsolid nodules ≥ 10 mm. In addition, the individual
performance among the observers varied substantially with Azvalues ranging
from 0.62 to 0.75. Given the variability among the observers, the moderate agreement and the imperfect performance of experienced radiologists, human visual analysis alone has to be considered insufficient to reproducibly predict if a subsolid nodule is persistent or transient. In that respect, our results confirm
published management strategies18,29 that recommend a 3-month follow-up CT
for clarification of persistence.
A study by Lee HJ et al.46 evaluated the performance of radiologists predicting
benign and malignant subsolid nodules, a differentiation that might be less complex, since persistent lesions can be both benign and malignant and the latter
Table 1.3
Average pair-wise percentage agreement of the morphologicalfeatures.
Morphological feature Agreement (%) 95% CI
Nodule type 81 79 - 84
Nodule multiplicity 73 61- 84
Lesion margin 64 56 - 71
Subcategory of well-defined margins 47 44 - 50
Solid core margin 71 67 - 75
Subcategory of well-defined solid core margins 62 59 - 65
Density of ground-glass component 67 64 - 69
Aspect of ground-glass component 53 45 - 61
Air bronchogram 70 59 - 82
Bubble lucency 86 82 - 89
Pleural retraction 89 86 - 92
may expose more suggestive features. However, even with the availability of several clinical parameters (age, sex, pack-years, history of lung cancer) and
knowledge of predefined predictive CT information, an average Azvalue of 0.77 for
nonsolid and of 0.76 for part-solid nodules were achieved, thus in fact comparable to our results.
Secondly, we found that none of the morphology features yielded significant discrimination in all four observers. Most promising features were nodule type, lesion margin, presence of a well-defined lesion margin and pleural traction. The average pair-wise percentage agreement was relatively high in nodule type and pleural retraction (81% and 89% respectively). A considerably lower agreement, however, was found for features that had to be rated qualitatively such as lesion margin in general or the subcategory of a well-defined lesion margin (63% and 47%, respectively), indicating that these features do not appear to be sufficiently definable by visual analysis to serve as a broadly applicable criterion within a screening process.
Interestingly, however, when looking at the subcategory of a well-defined border, three observers scored linearly demarcated border more frequently in transient lesions (27/40, 18/27, and 23/39) compared to persistent lesions. We did not prospectively define whether the linear demarcation following the lobular border had to be present in several projections, which most likely contributed to the fact that one observer scored the feature only 4 times. The finding of linear
demarcation shows similarity with a finding reported by Felix et al.27. Their study
described a polygonal shape (defined “as a lesion with linear or concave margins at every corner”) as indicative for a transient lesion. Furthermore, they found that transient subsolid nodules were more frequently lobulated than persistent nodules. The finding of lobulation being predictive for transience reported by
Felix et al.27 is in contradiction to the other study by Lee SM et al.28, who reported
lobulation as indicative for malignancy. Similarly, we found that 74% to 100% of the lobulated lesions were found to be persistent (15/16, 28/36, 1/1, 20/27 respectively).
In this study, we selected the subsolid nodules following the nodule type annotations of the NLST database. Previous studies have shown that the agreement among radiologists is only moderate with regards to the differentiation of
part-solid, nonsolid and solid nodules37,47. Therefore we decided to exclude all
lesions that were considered not a subsolid nodule by at least 2 of the 4 observers. We did so, to increase accuracy and reliability of the observer data.
Our study has limitations. First, our study did not include any elaborate texture or quantitative analysis. Visual CT features in combination with elaborate objectively quantifiable measures might not only improve performance but also
1
into account the fact that the majority of the NLST CTs has not been reconstructed with 1 mm slice thickness, thus not providing isotropic high-resolution image quality in all three projections. The level of performance and reader agreement we found, confirms the notion that visual assessment of morphological features in lesions < 10mm will be even more difficult and less reliable. Last, the CT examinations of the NLST trial have been obtained with different scanners and
variable slice thickness. Though only scans with a slice thickness of ≤ 2 mm were
included, the diverging image quality might have influenced the visual assessment of the nodules.
In conclusion, experienced radiologists are moderately able to visually determine
persistent and transient nodule character in lesions ≥ 10 mm. There are
morphological features indicative for the discrimination of persistent and transient nodules, but none of them yielded significant discrimination in all four observers. Our results show that performance of the visual assessment of CT morphology alone is not sufficient to generally abandon a short-term follow-up and inter-reader variability plays a substantial role even among highly experienced observers.
Lung-RADS 4X
K. Chung, C. Jacobs, E.T. Scholten, J.M. Goo, H. Prosch, N. Sverzellati, F. Ciompi, O.M. Mets, P.K. Gerke, M. Prokop, B. van Ginneken, C.M. Schaefer-Prokop
Original title: Lung-RADS Category 4X: Does It Improve Prediction of Malignancy in Subsolid Nodules?
Published in: Radiology 2017 284(1):264-271
2
Abstract
Purpose: To evaluate the added value of Lung CT Screening Reporting and Data
System (Lung-RADS) assessment category 4X over categories 3, 4A, and 4B for differentiating between benign and malignant subsolid nodules (SSNs).
Materials and methods: SSNs on all baseline computed tomographic (CT) scans
from the National Lung Cancer Trial that would have been classified as Lung- RADS category 3 or higher were identified, resulting in 374 SSNs for analysis. An experienced screening radiologist volumetrically segmented all solid cores and located all malignant SSNs visible on baseline scans. Six experienced chest radiologists independently determined which nodules to upgrade to category 4X, a recently introduced category for lesions that demonstrate additional features or imaging findings that increase the suspicion of malignancy. Malignancy rates of purely size-based categories and category 4X were compared. Furthermore, the false-positive rates of category 4X lesions were calculated and observer variability
was assessed by using Fleiss κstatistics.
Results: The observers upgraded 15% - 24% of the SSNs to category 4X. The
malignancy rate for 4X nodules varied from 46% to 57% per observer and was substantially higher than the malignancy rates of categories 3, 4A, and 4B SSNs without observer intervention (9%, 19%, and 23%, respectively). On average, the false-positive rate for category 4X nodules was 7% for category 3 SSNs, 7% for category 4A SSNs, and 19% for category 4B SSNs. Of the falsely upgraded benign lesions, on average 27% were transient. The agreement among the observers was
moderate, with an average κvalue of 0.535 (95% confidence interval: 0.509, 0.561).
Conclusion: The inclusion of a 4X assessment category for lesions suspicious for
malignancy in a nodule management tool is of added value and results in high malignancy rates in the hands of experienced radiologists. Proof of the transient character of category 4X lesions at short-term follow-up could avoid unnecessary invasive management.
2
2.1 Introduction
Current guidelines and recommendations for the management of screen-detected pulmonary nodules mainly depend on nodule type-specific diameter thresholds
and the presence of growth18,30,48. The nodule type helps differentiate between
solid nodules and subsolid nodules (SSNs). The latter are further subdivided into nonsolid or part solid, depending on the presence of a solid component. Two recent publications reported a high variability among radiologists in classifying nodules as subsolid, mainly because of disagreement on the presence or size of a solid
component37,47. This is of specific importance because SSNs potentially manifest as
early adenocarcinomas, with the size of the solid component having an important
correlation to the histologic characteristics of invasive adenocarcinomas9,20.
In 2014, the American College of Radiology published the Lung CT Screening Reporting and Data System (Lung-RADS), a categorical scoring system for screening- detected nodules with various management steps adapted to the malignancy risk of the nodule. In addition to nodule type and diameter, growth over time plays an important role in classification. The risk of malignancy grows as the nodule category increases from 1 to 4X. Lung-RADS introduced a category 4X for lesions that demonstrate “additional features or imaging findings that increase the suspicion of malignancy”.
According to Lung-RADS, upgrading a nodule to category 4X is possible only for category 3, 4A, or 4B nodules. This upgrade triggers a more intensive diagnostic workup ranging from short-term clinical follow-up computed tomography (CT) to more advanced diagnostic procedures (eg, positron emission tomography) or
invasive procedures, including biopsy and resection30. Although morphologic
criteria used to differentiate between benign and malignant findings are reasonably well established for solid nodules, these criteria are still evolving for SSNs22,35,46,49,50. A morphologically triggered category 4X would therefore involve issues that are still unresolved for SSNs.
To our knowledge, the degree to which the addition of category 4X improves the performance of Lung-RADS for predicting the probability of malignancy of an SSN has not been demonstrated. The purpose of our study was to evaluate the added value of Lung-RADS category 4X over categories 3, 4A, and 4B in the differentiation between benign and malignant SSNs.
2.2 Materials and methods
Study Group and Nodule Annotations
We analyzed all CT scans of the chest from the National Lung Screening Trial
(NLST)10 in which at least one SSN was annotated by the NLST screening
radiologist. The CT arm of the NLST consisted of 26722 subjects, 3194 of whom had at least one SSN in any screening round according to the NLST reading database. CT data were incomplete for nine subjects according to the NLST, leaving 3185 subjects for further analysis. A comprehensive description of study design and CT
technique has been published previously51. The NLST was approved by the
institutional board at each participating medical institution. All participants provided written informed consent before randomization.
The NLST database provided the following information for all screening-
positive nodules (ie, 4 ≥ mm diameter): section number and lobe in which the
nodule was found, long and perpendicular diameter of the nodule, and nodule type. Lung cancer diagnoses were reported in participants with positive nodules during a median follow-up of 6.5 years (maximum, 7.4 years), including the time
of diagnosis10. However, the NLST provided no data about which nodule developed
into lung cancer. Moreover, the size of solid cores in part-solid nodules was not available.
The first step in our study was to identify the SSNs on annotated scans from the NLST by matching lesions in the affected lobe with size, section number, and nodule type recorded during screening. This was done by trained medical students and a medical researcher using dedicated in-house software (CIRRUS Lung Screening; Diagnostic Image Analysis Group, Nijmegen, the Netherlands) that included computer-aided detection and semiautomatic volumetry. A nodule listed in the NLST database but not identifiable on the numbered section from the annotated lobe was marked as not found. All solid cores were reevaluated and segmented by a radiologist (E.T.S.) with more than 5 years of experience in reading screening CT scans of the chest.
The same radiologist identified the malignant nodules by using NLST database information with respect to the tumor-bearing lobe, year of diagnosis, and tumor size at pathologic examination. Probability scores were used to classify the degree of certainty in this identification process on a scale of 0 to 3, where 3 indicates very high certainty (lesion was located in the tumor-bearing lobe on a scan obtained within 1 year of tumor diagnosis), 2 indicates high certainty (the lesion was located in the tumor-bearing lobe and imaging signs were suggestive of malignancy; however, the diagnosis of malignancy was made more than 1 year from the last available screening image), 1 indicates low certainty (lesion was located in the tumor-bearing lobe and could potentially develop into a malignancy
2
over time but the diagnosis was made more than 1 year from the last available screening CT scan and available images did not reveal unequivocal signs of malignancy), and 0 indicates very low certainty (no lesion was visible) (Table 2.1). Imaging signs suggestive of malignancy included growth over time and spiculation. For this study, only malignant lesions with probability scores of 2 and 3 were considered as being visible at baseline.
Study Population
At baseline CT, 1807 nonsolid nodules and 510 part-solid nodules had been reported by NLST readers. Use of at least Lung-RADS category 3 as an inclusion criterion resulted in a study group of 47 nonsolid and 348 part-solid lesions. Retrospective identification of the nodule on the scan was possible in 43 of the 47 (91%) nonsolid nodules and 331 of the 348 (95%) part-solid nodules. Reasons for failure of identification were incomplete Digital Imaging and Communications in Medicine
data for the scan (n = 11) or the fact that no nodule could be found by using the
anatomic information provided by the NLST (n = 10). This left a total of 374 lesions
available for analysis.
Of the 374 lesions assigned a probability score of 2 or 3 by the expert radiologist, 56 SSNs were considered malignant. Of these 56 SSNs, 49 (88%) were diagnosed as cancers in year 0, 1, or 2 with an available scan of diagnosis and thus were given a score of 3. The remaining seven SSNs (13%) were diagnosed after the screening rounds (in year 3 to year 6) and were given a score of 2. Six of these seven lesions
Table 2.1
Probability scores used to determine level of certainty formalignant lesions.
Probability
score Definition
0 (very low) No lesion visible in the tumor-bearing lobe
1 (low) Lesion located in the tumor-bearing lobe that could potentially develop into a malignancy over time, but diagnosis was made more than 1 year from the last available screening CT scans and available images did not reveal unequivocal signs of malignancy 2 (high) Lesion located in the tumor-bearing lobe and imaging signs very
suggestive of malignancy; however, diagnosis of malignancy was made more than 1 year from the last available screening scan 3 (very high) Lesion was located in the tumor-bearing lobe on a
showed an increase in nodule mass over time on the screening CT scans; no followup scan was available for the remaining nodule to confirm growth, but the nodule demonstrated highly suspicious signs such as spiculation as assessed by consensus of two expert radiologists. No nodule was attributed a score of 1. Two participants were attributed a score of 0.
Observer Study
We selected SSNs that would have been classified as Lung-RADS category 3 or higher, meaning nonsolid nodules measuring at least 20 mm and part-solid nodules measuring at least 6 mm. Original NLST annotations for nodule types and nodule size were used. For the solid core, the diameter measurement from the experienced radiologist was used. We presented the set of selected nodules to six radiologists (E.T.S., J.M.G., H.P., N.S., M.P., and C.M.S.), all with at least 15 years of experience in reading chest CT scans and extensive experience in reading screening CT scans. A reading workstation to optimize workflow and to document scoring data was used (CIRRUS Observer, Diagnostic Image Analysis Group). When a case was opened, a magnified axial view of the nodule was displayed. Coronal and sagittal projections were available but were often of suboptimal quality because most scans were reconstructed with 2.5-mm-thick sections. The full three-dimensional CT scan with different window settings was available to the readers at any time. For each nodule, the observers were asked whether they would classify the nodule as category 4X. If the answer was yes, the reader was asked which imaging features increased the suspicion of malignancy to justify the use of category 4X.
The readers classified the imaging features as present or absent. The following imaging features were evaluated: features that referred to the effect on surrounding tissue (defined as retraction, displacement of fissure, overinflation), internal nodule structure (defined as high and/or inhomogeneous attenuation), border characteristics (defined as spiculation, sharp or unsharp definition, lobulation), presence of bullae (defined as dilated bronchi and/or air inclusions), and solid core characteristics (defined as spiculated, multifocal).
Statistical Analysis
Statistical analyses were performed by using software (SPSS, version 20.0; SPSS,
Chicago, Ill). Interobserver agreement was assessed by using Fleiss κ statistics.
Malignancy rates -defined as the percentage of malignant lesions in all lesions per categorywere calculated for the original categories (categories 3, 4A, 4B) and for category 4X. The false-positive rate was calculated for each observer to quantify how many benign nodules were incorrectly upgraded to a higher risk category. The Fisher exact test was used to assess whether there was a statistically
2
significant difference in scores assigned to morphologic features in benign and malignant lesions that were upgraded to category 4X.
2.3
Results
Malignancy Rates without and with Use of Category 4X
The malignancy rates of nodules classified purely according to size (ie, without taking category 4X into account) were 9% (17 of 196 nodules) for category 3 SSNs, 19% (11 of 58 nodules) for category 4A SSNs, and 23% (28 of 120 nodules) for category 4B SSNs. On average, the observers upgraded 18% (95% confidence interval [CI]: 15%, 22%) of the 374 nodules to category 4X. The agreement among the observers
was moderate, with an average κvalue of 0.535 (95% CI: 0.509, 0.561). Figures 2.1
and 2.2 show examples of nodules for which there was agreement and disagreement among the observers.
Malignancy rates -calculated separately for lesions upgraded and not upgraded to category 4X- are listed per observer in Table 2.2. Malignancy rates of category 4X nodules varied from 46% to 57% for the six observers, with an average of 53% (95% CI: 49%, 56%). The malignancy rates of category 4X nodules exceeded 50% for all but one observer. For all six observers, the malignancy rate for category 4X nodules was substantially higher than that for the purely size-based Lung-RADS categories alone (9%, 19%, and 23% for Lung-RADS categories 3, 4A, and 4B, respectively) (Table 2.2). After some nodules were upgraded to category 4X, the average malignancy rates in the remaining nonupgraded nodules decreased to 4% (95% CI: 3%, 5%) for category 2 nodules, 10% (95% CI: 6%, 15%) for category 4A nodules, and 10% (95% CI: 8%, 12%) for category 4B nodules.
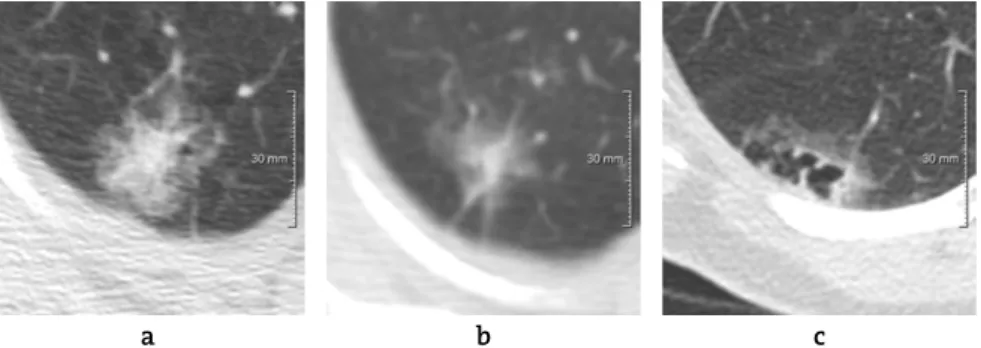
Figure 2.1
CT scans show malignant SSNs correctly upgraded by all six observers.In total, 96% of the malignancies diagnosed at baseline (27 of 28 nodules) were correctly upgraded by at least one of the six observers. During follow-up, the corresponding number was 82% (23 of 28 nodules). The average percentage of correctly upgraded lesions was highest in category 4A, with 65% (95% CI: 55%, 74%). An average of 46% (95% CI: 40%, 52%) of nodules in category 3 and 54% (95% CI: 50%, 58%) in category 4B were correctly upgraded (Table 2.3).
False-Positive Upgrade of Benign Nodules to Category 4X
The average false-positive rate was 7% (95% CI: 5%, 9%) for category 3 nodules, 7% (95% CI: 4%, 10%) for category 4A nodules, and 19% (95% CI: 13%, 24%) for category 4B nodules. Of the benign and thus falsely upgraded lesions, an average of 27% (95%CI: 18%, 36%) were transient. The average percentage of falsely upgraded
Figure 2.2
Example CT scans of SSNs for which upgrade to category 4X wasdetermined variably by the six observers. (a) Malignant lesion upgraded by
three observers. (b) Malignant lesion upgraded by four observers. (c) Benign
lesion upgraded by two observers. (d) Benign lesion upgraded by three observers.
(e) Benign lesion upgraded by four observers. (f) Benign lesion upgraded by
four observers. a d b e c f
2
transient nodules was 36% (95% CI: 19%, 54%) for category 3 nodules, 4% (95% CI: 0%, 15%) for category 4A nodules, and 25% (95% CI: 14%, 36%) for category 4B nodules.
Table 2.2
Malignancy rates for nonupgraded subsolid nodules andthose upgraded to category 4X.
Variable Lung-RADS 3 Lung-RADS 4A Lung-RADS 4B Lung-RADS 4X
Size-based Lung-RADS 17/196 (9) 11/58 (19) 28/120 (23) ... Observer 1 9/178 (5) 9/55 (16) 8/83 (10) 30/58 (52) Observer 2 3/168 (2) 3/46 (7) 8/86 (9) 42/74 (57) Observer 3 7/177 (4) 5/48 (10) 9/85 (11) 35/64 (55) Observer 4 8/177 (5) 7/50 (14) 12/92 (13) 29/55 (53) Observer 5 6/166 (4) 3/46 (7) 5/71 (7) 42/91 (46) Observer 6 9/177 (5) 4/49 (8) 8/82 (10) 35/66 (53) Average (%)* 4 (3, 5) 10 (6, 15). 10 (8, 12) 53 (49, 56)
Note: Malignancy rates were determined as follows: number of malignant nodules/total number of nodules in Lung-RADS category X 100. A total of 374 nodules were analyzed, of which 56 were malignant. Except where indicated, data are numbers of nodules, with percentages in parentheses. * Data in parentheses are 95% CIs. Average is average of observers.
Table 2.3
Malignancy rates for lesions upgraded to category 4X.Observer Total Upgraded to
Category 4X Upgraded from Lung-RADS 3 Upgraded from Lung-RADS 4A Upgraded from Lung-RADS 4B
1 30/58 (52) 8/18 (44) 2/3 (67) 20/37 (54) 2 42/74 (57) 14/28 (50) 8/12 (67) 20/34 (59) 3 35/64 (55) 10/19 (53) 6/10 (60) 19/35 (54) 4 29/55 (53) 9/19 (47) 4/8 (50) 16/28 (57) 5 42/91 (46) 11/30 (37) 8/12 (67) 23/49 (47) 6 35/66 (53) 8/19 (42) 7/9 (78) 20/38 (53) Average (%)* 53 (49, 56) 46 (40, 52). 65 (55, 74) 54 (50, 58)
Note: Malignancy rates were determined as follows: number of malignant nodules/total number of upgraded nodules X 100. Except where indicated, data are numbers of nodules, with percentages in parentheses. * Data in parentheses are 95% CIs.