LLNL-TR-534491
Ultrascale Visualization Climate Data
Analysis Tools (UV-CDAT): Semi-Annual
Progress Report
D. N. Williams
Disclaimer
This document was prepared as an account of work sponsored by an agency of the United States government. Neither the United States government nor Lawrence Livermore National Security, LLC, nor any of their employees makes any warranty, expressed or implied, or assumes any legal liability or responsibility for the accuracy, completeness, or usefulness of any information, apparatus, product, or process disclosed, or represents that its use would not infringe privately owned rights. Reference herein to any specific commercial product, process, or service by trade name, trademark, manufacturer, or otherwise does not necessarily constitute or imply its endorsement, recommendation, or favoring by the United States government or Lawrence Livermore National Security, LLC. The views and opinions of authors expressed herein do not necessarily state or reflect those of the United States government or Lawrence Livermore National Security, LLC, and shall not be used for advertising or product
endorsement purposes.
This work performed under the auspices of the U.S. Department of Energy by Lawrence Livermore National Laboratory under Contract DE-AC52-07NA27344.
Lawrence Livermore National Laboratory
LLNL-TR-######
Ultrascale Visualization Climate
Data Analysis Tools
(UV-CDAT)
Semi-Annual Progress Report
July 1, 2011 through December 31, 2011
UV-CDAT Semi-Annual Progress Report July 1, 2011 through December 31, 2011 LLNL-TR-######
2
BER’s
Ultra
scale Visualization Climate Data Analysis Tools
Semi-Annual Progress Report for the Period July 1, 2011 through December 31, 2011
Principal Investigators:
Dean N. Williams3, David Bader5, and Phil Jones2
The Ultrascale Visualization Climate Data Analysis Tools Team: Andy Bauer1, Berk Geveci1, Dave Partyka1
Jim Ahrens2, John Patchett2, Johnathan Woodring2 Timo Bremer3, Charles Doutriaux3, Robert Drach3
Thomas Maxwell4
Ross Miller5, Galen Shipman5, Raju Ranga Vatsavai5, Feiyi Wang5, Zhe Zhang5 Cameron Christensen6, David Koop6, Valerio Pascucci6, Emanuele Santos6,
Claudio Silva6, Huy Vo6
1 Kitware, Inc.
2 Los Alamos National Laboratory
3 Lawrence Livermore National Laboratory 4 National Aeronautics and Space Administration 5 Oak Ridge National Laboratory
UV-CDAT Semi-Annual Progress Report January 1, 2011 through June 30, 2011 LLNL-AR-######
iii
Table of Contents
BER’s Ultrascale Visualization Climate Data Analysis Tools ... 2
1 Executive Summary ... 4
2 Reporting Period Highlights from Kitware, LANL, LLNL, NASA, ORNL, and the University of Utah ... 5
2.1 Kitware and LANL Project Highlights: ... 5
2.2 NYU-Poly, LLNL, an d NASA Project Highlights ... 5
Figure 1. The image shows the alpha release of the UV-CDAT GUI. The UV-CDAT framework currently includes CDAT, VisTrails, ParaView, and NASA’s vtDV3D packages. VisIt and R packages will be released in the beta version of UV-CDAT, some time in the mid to late spring. ... 6
2.3 ORNL Project Highlights ... 7
3 Component Progress ... 8
3.1 Readers for Climate Data: POP and CAM ... 8
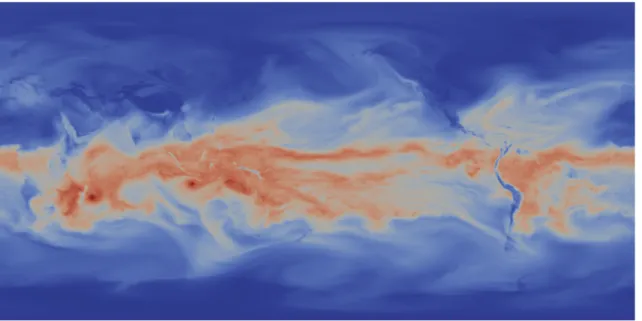
The NetCDF CAM reader was also improved based on interactions with climate scientists. The main improvements were to allow scientists to view and analyze surface information in their data sets. Time support was also added to the reader. Time is supported both in a single file as well as file series. In addition, a second request was to allow pseudo-coloring of field information for surface grids to have transparency which was dependent on field data. These changes have been provided as topic branches in ParaView and VTK and are currently going through code reviews and testing before they make it into the main repository branch. An example of the CAM surface output is shown in Figure 4. ... 9
Figure 2. Unstructured output from CAM model showing TMQ field. ... 9
4 UV-CDAT Group Meetings ... 9
5 Collaborations ... 10
6 Outreach, Papers, Presentations, and Posters ... 10
6.1 Papers ... 10
UV-CDAT Semi-Annual Progress Report January 1, 2011 through June 30, 2011 LLNL-AR-######
4
1 Executive Summary
This report summarizes work carried out by the Ultrascale Visualization Climate Data Analysis Tools (UV-CDAT) Team for the period of July 1, 2011 through December 31, 2011. It discusses highlights, overall progress, period goals, and collaborations and lists papers and presentations. To learn more about our project, please visit our UV-CDAT website (URL: http://uv-cdat.org). This report will be forwarded to the program manager for the Department of Energy (DOE) Office of Biological and Environmental Research (BER), national and international collaborators and stakeholders, and to researchers working on a wide range of other climate model, reanalysis, and observation evaluation activities.
The UV-CDAT executive committee consists of Dean N. Williams and Dave Bader of Lawrence Livermore National Laboratory (LLNL); Galen Shipman of Oak Ridge National Laboratory (ORNL); Phil Jones of Los Alamos National Laboratory (LANL), Claudio Silva of Polytechnic Institute of New York University (NYU-Poly); and Berk Geveci of Kitware, Inc. The UV-CDAT team consists of researchers and scientists with diverse domain knowledge whose home institutions also include the National Aeronautics and Space Administration (NASA) and the University of Utah. All work is accomplished under DOE open-source guidelines and in close collaboration with the project’s stakeholders, domain researchers, and scientists.
Working directly with BER climate science analysis projects, this consortium will develop and deploy data and computational resources useful to a wide variety of stakeholders, including scientists, policymakers, and the general public. Members of this consortium already collaborate with other institutions and universities in researching data discovery, management, visualization, workflow analysis, and provenance. The UV-CDAT team is positioned to address the following high-level visualization requirements:
• Alternative parallel streaming statistics and analysis pipelines
o Data parallelism
o Task parallelism
o Visualization parallelism
• Optimized parallel input/output (I/O) • Remote interactive execution
• Advanced intercomparison visualization • Data provenance processing and capture • Interfaces for scientists
o Workflow data analysis and visualization construction tools
5
2 Reporting Period Highlights from Kitware, LANL, LLNL, NASA, ORNL, and the University of Utah
This section describes the team’s accomplishments during the reporting period, in which the overall goal was to advance the project to accomplish its mission of providing useful tools and product services within the UV-CDAT framework. The UV-CDAT is intended to serve customers who span a broad spectrum of sophistication. Detailed use cases,
architecture design, and software challenges can be found on our UV-CDAT website:
http://uv-cdat.org. For the next reporting period, the team will be working towards an
official release of UV-CDAT. For more details on the release, see the URL:
http://uv-cdat.llnl.gov/wiki/RoadmapToRelease and the http://uv-cdat.llnl.gov/wiki/FeaturesList.
2.1 Kitware and LANL Project Highlights:
• Improved POP support
o Vector operations like streamlines and Okuba-Weiss supported
o Striding and subsetting support added
• Improved CAM Support
o Time support
• Participated in investigating parallel visualization and analysis • Participated in providing analysis for BER data sets
• Presented paper at IEEE Visualization written jointly with visualization and climate
scientist authorship
• Continued close relationship with LANL ocean scientists
o Submitted paper to Eurovis 2012
• Continued efforts to integrate spatio-temporal pipeline
• Provided support for CMake Build System on various platforms
2.2 NYU-Poly, LLNL, an d NASA Project Highlights
• Implemented an overhauled of unified interface that combines the visual
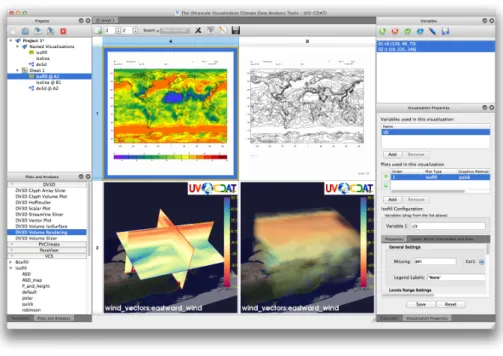
spreadsheet with variables, plots and visualization types in a single view. The visual spreadsheet has rows, columns, and cells like other spreadsheets, but each cell can contain an interactive visualization (from CDAT, vtDV3D, or ParaView). Navigation operations like zooming, panning, and rotating, can be applied to individual cells or an entire subset of cells to facilitate interactive comparisons. The interface still relies on the computational and provenance infrastructure provided by VisTrails, but the complexity of the pipeline editor is hidden unless users wish to dig deeper.
• Refined graphical user interface (GUI) to allow variables to be plotted by dragging
6
• Extended the visualization types to allow plots from CDAT, ParaView, and
vtDV3D. Each type can be dragged into the spreadsheet to generate visualization from a selected variable. Some types, like vtDV3D, are themselves backed by visualization pipelines developed in VisTrails, but others rely on other systems like CDAT and ParaView to accomplish the computations.
• Variables have been generalized to work across different types of systems. A base
variable defines information like dimensions and attributes that CDAT and ParaView variables can adhere to in order for stronger integration.
• The configurations of plots are now more easily accessible as a tab in the same
window as the rest of the GUI.
• The layout and state of UV-CDAT plots and visualizations are now persistent.
The configuration of the spreadsheet is saved as part of the UV-CDAT provenance data. This allows users to not only share data and computational pipelines but also the views that they have examined. User operations in the UV-CDAT spreadsheet can flow back to the projects.
• UV-CDAT pipelines and visualizations can now be organized into projects.
Visualizations can now be organized and managed as projects.
• Helped resolve some issues in building UV-CDAT on different platforms, and
work continues to make installation easier.
• Worked to support NASA’s vtDV3D, Kitware’s work on the ParaView
visualization modules, and LLNL’s work on the CDAT visualization modules.
• Gathered user feedback on pre-alpha release and used the input to improve the
GUI and the overall system.
Figure 1. The image shows the alpha release of the UV-CDAT GUI. The UV-CDAT framework currently includes CDAT, VisTrails, ParaView, and NASA’s vtDV3D packages. VisIt and R packages will be released in the beta version of UV-CDAT, some time in the mid to late spring.
7
2.3 ORNL Project Highlights
• Optimized large-scale data/temporal parallel workloads on Leadership Class
Systems
• Delivered optimized Parallel I/O infrastructure in ParaView/VTK for POP
o Integrated within VTK and available in ParaView
• Developed prototype implementation of Parallel data reader for NetCDF-CF • Completed development of metadata model for spatial/temporal datasets • Facilitated access to Jaguar system and other ORNL systems for collaborative
development through a Director's discretionary allocation
• Developed prototype workflow within UV-CDAT to allow offloading of
large-scale analysis workloads to the Jaguar system and subsequent gathering of results for display to the users desktop
• Worked with land model data from the BER funded CSSEF effort to demonstrate
the capabilities of UV-CDAT as illustrated in the figure below
o Collaboration efforts in FY12 will deliver new capabilities to ORNL’s climate scientists through UV-CDAT
8
3 Component Progress
During this reporting period, progress was made in the key areas that are necessary to meet UV-CDAT goals and objectives.
3.1 Readers for Climate Data: POP and CAM
The NetCDF POP reader in VTK is being improved to get the proper spatial representation for ParaView. The data set is output in tripolar/Murray grid coordinates. In order to do quantitative analysis, either the grid must be transformed to a Cartesian coordinate system for use in ParaView or we must create new filters or modify existing filters to be able to compute in other coordinate systems. Because of this, we have modified the POP reader to output the data set as an unstructured grid on a sphere; this can be seen in Figure 2. The
sphere has no artificial seams, that our previous, rectangular spatial representation had, which allows for computations like streamlines to operate properly without any adding exceptional cases to ParaView. The POP reader also partitions the data as well as provides ghost cell support for filters that request it. Since the data is in a structured format, the reader also allows striding through the data as well as subsetting to make interacting with the data faster when working on slower machines. In addition to this, the reader was modified to take in vector data from multiple files. We have also computed the vector transformations from the tripolar grid coordinate system to the Cartesian coordinate system. We are in the process of verifying this work with the climate scientists. An example image showing these vectors is shown in Figure 3.
Figure2 POP data transformed to an unstructured grid allows for native vector operations like streamlines and Okuba-Weiss.
9
The NetCDF CAM reader was also improved based on interactions with climate scientists. The main
improvements were to allow scientists to view and analyze surface information in their data sets. Time support was also added to the reader. Time is supported both in a single file as well as file series. In
addition, a second request was to allow pseudo-coloring of field information for surface grids to have transparency which was dependent on field data. These changes have been provided as topic branches in ParaView and VTK and are currently going through code reviews and testing before they make it into the main repository branch. An example of the CAM surface output is shown in Figure 4.
Figure 2. Unstructured output from CAM model showing TMQ field.
4 UV-CDAT Group Meetings
The UV-CDAT executive committee holds occasional conference calls each month. These meetings discuss priorities and issues that make up the agendas for project meetings held via teleconference every other Tuesday at 10:00 a.m. Pacific. At the project meetings, the entire team discusses project goals, design and development issues, technology, timelines, and milestones.
Given the need for more in-depth conversations and examination of work requirements, a face-to-face meeting was held during the reporting period, hosted by NYU-Poly in New York. Many team members attended the face-to-face meeting. From the meeting, necessary collaboration subgroups, user requirements, and project management plans were addressed.
10
The meeting also covered architecture design and set new project timelines and milestones for specified use cases.
In addition to our standing project meeting, other subgroups meet regularly. For example, the Parallel I/O team (ORNL, LANL, Kitware) has established weekly meetings to discuss parallel I/O performance enhancements and other general enhancements to the ParaView/ VTK systems. These meetings are held each Monday at 4 p.m. Eastern. The GUI team also meets weekly to discuss overall software integration and general improvements requested by pre-alpha users.
Besides the UV-CDAT website (http://www.uv-cdat.org), a mailing list has also been established ([email protected]), broadcasting announcements and meetings relevant to the entire project.
5 Collaborations
To effectively build an infrastructure that can accommodate ultrascale visualization and analysis, we established connections with other BER-funded projects and programs at various meetings and workshops, such as the CSSEF meeting held in Gaithersburg, MD.. UV-CDAT coordination and outreach consists of these activities:
• Managing the international execution of the UV-CDAT activity
• Building consensus among modeling groups and arbitrating among various
interested groups to maximize scientific value of analysis and visualization
• Providing support services for BER needs and its research and facilitating
communication with the modeling groups
• Communicating, interacting with, and responding to scientific groups, government
agencies, and a broad range of user groups seeking information about BER analysis and visualization
6 Outreach, Papers, Presentations, and Posters
This section describes the outreach activities for this reporting period in the form of papers published and talks and posters presented.
6.1 Papers
6.1.1 Visualization and Analysis of Eddies in a Global Ocean Simulation
S Williams, M Petersen, PT Bremer, M Hecht, V Pascucci, J Ahrens, M Hlawitschka, B Hamann “Adaptive Extraction and Quantification of Discrete Vortices.” IEEE Vis 2011
• We consider the problem of extracting discrete axis-aligned vortices from a
11
physics and geometry of an idealized vortex. The model allows us to derive a novel correlation between the size of the vortex and its strength, measured as the square of its strain minus the square of its vorticity. For vortex detection in real models, we use the strength parameter to locate potential vortex cores, and then measure the similarity of our ideal analytical vortex and the real vortex core for different
strength thresholds.
S. Williams, M. Petersen, M. Hecht, M. Maltrud, J. Patchett, J. Ahrens, and B. Hamann “Interface Exchange as an Indicator for Eddy Heat Transport” Submitted to Eurovis 2012
• The ocean contains many large-scale, long-lived vortices, called mesoscale eddies,
that are believed to have a role in the transport and redistribution of salt, heat, and nutrients throughout the ocean. Determining this role, however, has proven to be a challenge, since the mechanics of eddies are only partly understood; a standard definition for these ocean eddies does not exist and, therefore, scientifically meaningful, robust methods for eddy extraction, characterization, tracking and visualization remain a challenge. In order to shed light on the nature and potential roles of eddies, we have combined our previous research on eddy identification and tracking, and have used those approaches as the basis for analysis-driven
computational experiments on the nature of eddies. Based on the resulting
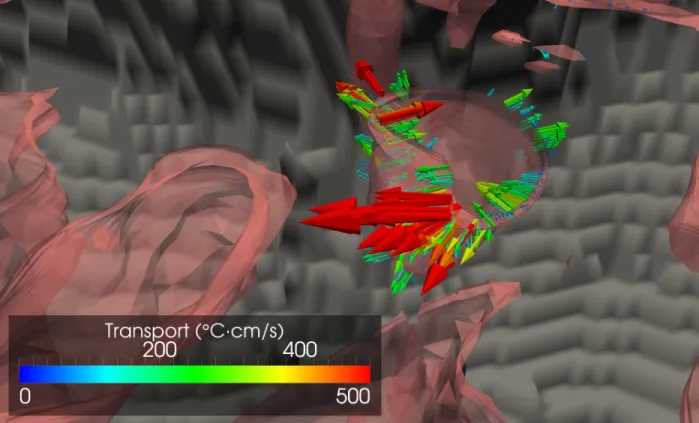
visualizations of eddy behavior, we have devised a new metric to characterize the transfer of water into and out of eddies across their boundary, and have developed visualization methods for this new metric to provide clues about the role eddies play in the global ocean and, potentially, climate change.
12
Figure 4. Close-up visualizations of interface exchange behavior. We developed and applied an interface exchange metric to a single daily snapshot of the Parallel Ocean Program data in order to focus on individual eddies. Pictured here is a short-lived eddy associated with the Gulf Stream in the North Atlantic. This eddy appears to be contributing to heat transport primarily where it undergoes deformation, when large exchanges of heat may occur.