5
APPLICATION OF A DATABASE INTERFACE (EDI)
FOR EROSION PREDICTION IN BRAZIL1
Gerd Sparovek2, Quirijn de J. van Lier3, Simone B. L. Ranieri4,
Isabella C. DeMaria5, Dennis C. Flanagan6
ABSTRACT: Soil erosion resulting from agricultural land use is associated with
environmental impacts and crop productivity loss. Erosion prediction is currently based on models, like USLE or WEPP. In Brazil, traditionally, the scale for soil conservation planning is the watershed (1000 to 5000 ha) and the Brazilian “small watershed programs” are international references for successful soil conservation. The quantification of erosion as a georeferenced variable is essential for its analysis together with other important data treated in Geographic Information Systems (GIS). This paper describes a computer program named Erosion Database Interface (EDI) that allows georeferenced applications of USLE and WEPP at the watershed scale. EDI operates as a pure interface, allowing the connection of EDI to any GIS that work with vector formats. The georeferenced vector-based design, the action as a pure interface and the flexibility to fit to different scales are aspects that distinguish EDI from other spatial erosion prediction tools. For use with USLE, each soil type has its own K-value and each land use has its own CP-value. The R factor is constant and LS-values are calculated from topographic data. For use with WEPP, EDI builds a soil, management and slope input file for each transect after separating the transect in the Overland Flow Elements, which are used by WEPP for erosion rate calculation. Based on input data from either USLE or WEPP, EDI will generate output files with longitude and latitude in meters and soil loss. To illustrate EDI’s performance in a scale compatible with land use planning for the Brazilian small watershed programs a practical example of a sugarcane area (2,000 ha), located at the south-eastern part of Brazil (Piracicaba county) was used. The resulting maps and some statistics are shown and it is concluded that EDI is an efficient program for georeferenced erosion prediction for both WEPP and USLE. The presentation of erosion rates as a georeferenced information gives a new dimension to the erosion process as compared to its presentation as mean rates.
Keywords GIS, WATERSHED, EROSION MODELS.
1
The authors thank FAPESP (The State of São Paulo Research Foundation) for financial support. EDI is a non commercial software protected by copyright in name of the authors and of the sponsoring agency (FAPESP). Those interested in using EDI or getting a copy (software installation files, manual and tutorial) should contact the corresponding author via electronic mail for further instructions.
2 Agronomist, University of São Paulo, CP 9, 13418-900 Piracicaba (SP) Brazil, [email protected], phone +55 19 3417-2140, fax
+55 19 434 5354.
3
Agonomist, University of São Paulo, CP 9, 13418-900 Piracicaba (SP) Brazil, [email protected], phone +55 19 3429 4283 ext. 211, fax +55 19 3429 4439. CNPq fellow (corresponding author)
4
Agronomist, University of São Paulo, CP 9, 13418-900 Piracicaba (SP) Brazil, [email protected], phone +55 19 3417-2140, fax +55 19 434 5354.
5
Scientific researcher, Agronomist, Agronomic Institute (IAC), CP 28, CEP 13001-970, Campinas (SP), Brazil, [email protected], phone/fax +55 19 3241 5188. CNPq fellow.
6
Agricultural Engineer, USDA-Agricultural Research Service, National Soil Erosion Research Laboratory, 1196 Building SOIL, IN 47907-1196, West Lafayette, USA, [email protected], phone +1 765 494 8673, fax +1 765 494 5948
APLICAÇÃO DE UMA INTERFACE VETORIAL (EDI)
PARA PREVISÃO DE EROSÃO NO BRASIL
RESUMO: A erosão do solo que resulta do uso agrícola da terra associa-se com
impactos ambientais e perda de produtividade. A predição de erosão baseia-se em modelos, como USLE ou WEPP. No Brasil, tradicionalmente, a escala para o planejamento da conservação do solo é a da microbacia hidrográfica (1000 a 5000 ha) e os programas de conservação do solo que existem nessa escala no sul do país são referências internacionais. A quantificação da erosão como variável georreferenciada é essencial para sua análise em conjunto com outros dados importantes processados por Sistemas de Informação Geográfica (SIG). Neste trabalho descreve-se um programa computacional chamado “Erosion Database Interface” (EDI) que permite aplicações georreferenciadas da USLE e do WEPP numa escala de bacia hidrográfica. O EDI funciona como uma interface pura, permitindo a conexão do EDI com qualquer SIG que trabalha com formato de vetor. O fato de se basear em vetores, a ação como interface pura e a flexibilidade de se adaptar a escalas diferentes são aspectos que distinguem EDI de outras ferramentas para se fazer predição espacial de erosão. Para uso com a USLE, cada tipo de solo tem seu valor de K e cada tipo de uso tem seu valor de CP. O fator R é uma constante e os valores de LS são calculados com base nos dados topográficos. Para uso com o WEPP, após dividir os transectos em Overland Flow Elements, EDI confecciona arquivos de entrada para o solo, o manejo e o declive usados pelo WEPP para calcular as taxas de erosão. Baseado nos valores de entrada de USLE ou WEPP, o EDI gera arquivos de saída com a longitude, latitude e perda de solo. Para ilustrar o desempenho do EDI numa escala compatível com o planejamento do uso em microbacias hidrográficas, um exemplo prático de uma área de cana-de-açúcar de 2.000 ha no sudeste do Brasil (Piracicaba, SP) foi utilizado. Os mapas que resultaram e algumas estatísticas são mostradas e se conclui que EDI é um programa eficiente para a predição georreferenciada da erosão utilizando USLE ou WEPP. A apresentação das taxas de erosão na forma de informação georreferenciada dá uma dimensão nova quando comparada com os valores médios.
Palavras-chave SIG, BACIA HIDROGRÁFICA, MODELOS DE ESTIMATIVA DE
EROSÃO
1 INTRODUCTION
Soil erosion resulting from agricultural land use is associated with environmental impacts (Clark II et al., 1985) and crop productivity loss (Lal, 1995; Pimentel et al., 1995) which makes the understanding of the erosion process important to guarantee food security (Daily et al., 1998) and environmental safety (Matson et al., 1997). Due to methodological restrictions, erosion rates can be precisely measured only in small scale experiments. For large scales, only estimates can be made.
Following a recent trend in experimental science (Cipra, 2000), erosion prediction is currently based on models, mostly developed during the last 20 years (Renard & Mausbah, 1990). The Universal Soil Loss
Equation-USLE (Wischmeier & Smith, 1978) requiring a small number of input parameters and for which an extensive and comprehensive experimental database is available (Lane et al., 1992) is one of the most widely used erosion prediction models. However, USLE is a highly empirical model, requiring experimental calibration for each new situation where it is to be applied (Laflen et al., 1991). More recently, mechanistic soil erosion prediction models have been developed. These models use several equations divided in modules, each one related to a specific part of the erosion process. Among these, the Water Erosion Prediction Project-WEPP (Flanagan & Nearing, 1995) is one of the most used. Mechanistic models can reduce the need for extensive field experiments and calibrations, and if
7
Revista Brasileira de Agrocomputação, v.1, n.1, p.5-12 , Jun.2001
successful, will require more easy to obtain input parameters to be applied to a new condition.
In Brazil, traditionally, the scale for soil conservation planning is the watershed (between 1,000 and 5,000 ha) and the “small watershed programs” from the southern part of Brazil are cited as international references for successful soil conservation (Busscher et al., 1996). The quantification of erosion as a georeferenced variable is essential for its analysis together with other data usually treated in Geographic Information Systems (GIS), e.g. land use types, farm location, environmentally protected areas. WEPP and USLE are originally not associated to geographic coordinates, i.e. calculated soil loss or deposition rates are not georeferenced using the primary USLE formula or the WEPP software. The lack of quantification and georeferencing of erosion rates during the planning stage are cited as important problems for priority definition and effectiveness of soil conservation planning (Graaf, 1996).
This paper describes a computer program named the Erosion Database Interface (EDI) that allows georeferenced applications of USLE and WEPP at the watershed scale which is usually applied for conservation planning in Brazil. The use of EDI as an interface with a Geographic Information System (GIS) is also described.
2 MATERIAL AND METHODS 2.1 EDI’s general assumptions
Soil erosion models are very sensitive to slope steepness and length (Nearing et al., 1990; Risse et al., 1993). In GIS, these variables have to be calculated using altitude data. Altitudes are primarily represented as contour maps, composed of equally spaced contour lines and extreme altitude points. These vector data may be converted to a raster format via Digital Elevation Models (DEM). The resolution and accuracy of slope steepness and length calculations made directly on a contour map can be considerably different to those based on a raster DEM (Srinivasan & Engel, 1991). The type of algorithm used to create the DEM and later for the conversion of the grid cells altitudes in gradients and the size of the selected output pixel are the main reasons for precision loss when calculating slope steepness and length based on a DEM (Jones, 1998). This is why EDI was designed to operate preferably with vector data, making it different from other more frequently used GIS-raster modeling approaches
(Hamlett et al., 1992; Mellerowicz et al., 1994; Sabavi et al., 1995).
EDI operates as a pure interface. EDI runs the models based on a standard text format input database produced via GIS and builds another text format georeferenced database with soil erosion rates. This procedure allows connecting EDI to any GIS that can operate in vector formats, as the communication is not based on a specific GIS file format. In this way, users can easily adapt to EDI. Another advantage of this approach is that no simplifications have to be made to fit the models into the available tools of a specific GIS package. The models, especially WEPP, are run as pure erosion prediction engines and new versions can easily be upgraded without changing the surrounding interface.
EDI was designed to operate with as little as possible user directions. With the system set up to fit the available input database and to get the desired output, no further user assistance is needed. Independent of the size of the database, EDI will process data automatically. This makes EDI adaptable to different scales without spending time for repeating routines that could be processed automatically.
In summary, the georeferenced vector-based design, the action as a pure interface and the flexibility to fit to different scales are aspects that distinguish EDI from most other spatial erosion prediction approaches. These features were considered to gain higher precision, to be more user friendly and to extrapolate the frontiers of academic research once the main goal of EDI is to fit the requirements of extensive land evaluation projects.
2.2 EDI input data
Independent of which erosion model is used, WEPP or USLE, EDI will process only hillslopes. The definition of a hillslope for EDI is a straight line segment beginning at the upper slope and ending down at runoff output (e.g. a river, channel or sediment fan). A hillslope should follow the natural runoff direction. This excludes the current version of EDI as a useful interface for features such as channels, impoundments or gullies available in WEPP’s watershed version. The hillslope approach creates some difficulties for running EDI in areas where linear runoff intercepting or deflecting features (e.g. terraces, small contour vegetated strips, roads) predominate in the landscape. However, these features will likely disturb most other GIS-based erosion estimation procedures when operating on large scales.
The hillslopes definition has to be made before using EDI in the GIS environment. The selection of automatic procedures or the definition of hillslopes by hand will not interfere on how EDI functions. To apply EDI, the hillslope line segments or transects have to be converted to a database format, which can be done storing the coordinates of each intersection of an altitude contour line with the transects in a database. In this text format database (.csv), each point has its x, y, z geographic coordinates (expressed in metric units) and its corresponding transect, land use and soil type number. These are the only GIS based data needed to operate EDI for WEPP or USLE. The described procedure should be considered as a suggestion to take advantages of EDI’s design that allows using vector contour data directly. Considering that the GIS procedures for building the input data run independent of EDI, other methods to produce the input database may be adopted.
No climatic differences can be determined within one EDI-run. If the study area shows distinct climates, then an individual database for each climatic zone has to be organized.
2.3 EDI procedures for use with USLE
USLE is represented by the following equation (Wischmeier & Smith, 1978):
(1) where: A = mean annual soil loss (Mg ha-1 y-1); R = rainfall and runoff factor (MJ ha-1 mm h-1); K = soil erodibility factor Mg ha h ha-1 y-1 MJ-1 mm-1; L S = topographic factor related to slope length (L) and steepness (S); C = cover and management factor; P = support practice factor.
For EDI, each soil type has its own K-value and each land use has its own C P-value. These values are stored in a soil type file and in a land use type file. The R factor is constant for each program run and user defined in EDI’s internal setup.
Based on the x, y and z coordinates EDI will calculate the L and S factors dividing the whole transect in n one-meter segments. The combined LS value for each of these segments is estimated according to the methods suggested by Foster & Wischmeier (1974) and Wischmeier & Smith (1978). First, the slope length factor (L) is calculated for segment i (Li,i ≤ n):
(2)
Then, the slope steepness factor (S) from the first segment up to segment i Sj(1≤ j ≤ i), based on the slope steepness from the segment (σj, m m-1), is calculated using the x, y, z coordinates form the neighboring points:
(3)
The LS factor at the end of segment i (LSi) is then calculated by:
(4) with Pj as the weighting factor:
(5) where m is equal to 0.5 for a slope steepness greater than or equal to 0.05 m m-1, or equal to 0.3 for a slope steepness less than or equal to 0.03 m m-1and, for a slope steepness between 0.03 and 0.05 m m-1, it is calculated by:
(6) Then, the soil loss rate A is calculated following the USLE general equation for the whole database using the K, LS, and CP factors corresponding to each point and the R factor defined for the specific run.
EDI will generate output files with longitude (x) and latitude (y) in meters and soil loss in kg m-2 y-1 or Mg ha-1 y-1. This output file may contain the same geographic points as the input file, user defined equidistant length intervals or 100 points per Overland Flow Element (OFE, represented by uniform land use and soil numbers). This file is ready to be transferred to the GIS as a georeferenced database or processed in statistical programs.
2.4 EDI procedures for use with WEPP
All WEPP management and soil input files (.man and .sol respectively) considering a single OFE, corresponding to the soil and land use numbers in EDI’s
RKLSCP
A
=
5 . 0 13 . 22 = i Li 065 . 0 1 56 . 4 1 41 . 65 2 2 2 + + + + = j j j j j Sσ
σ
σ
σ
∑
==
i j j j i iL
P
S
LS
1σ
⋅ =10 m 1 1 1 ) 1 ( + + + − − = m m m j i j j P9
input file, have to be available in a format appropriate for the desired WEPP version. EDI will build a soil data input file (.sol), a management input data file (.man) and a slope input data file (.slp) for each transect after separating the transect in the respective OFEs. A file containing the desired calculation procedures (.inp) is built for each transect and a batch file (.bat) to automatically run WEPP’s executable file (WEPP.EXE) for the entire data set. Following this procedure, WEPP calculations are done automatically by WEPP.EXE file and all transects are processed without further assistance. As its output, WEPP creates summary files (.sum) containing the erosion prediction data. These files are interpreted and georeferenced by EDI and the same output options for soil loss data as described for USLE are available for WEPP.
2.5 An example of the application of EDI
To illustrate EDI’s performance in a scale compatible with land use planning for the Brazilian small watershed programs a practical example representing a sugarcane production area was prepared. The Ceveiro watershed (2,000 ha) is located at the south-eastern part of Brazil (Piracicaba) with central coordinates of S 22º38’54” and W 47º45’40”. The climate, according to Koeppen’s classification, is Cwa i.e. humid subtropical with a dry winter and less than 30 mm rain in the driest month, the temperature in the hottest month is in excess of 22 °C and in the coldest below 18 °C. The landscape is usually composed of S-shaped profiles and the mean slope value is 13 % (maximum slope 59.03 % and 90 % of the values between 2.42 % and 25.98 %). Soil surveys identified 14 soil types that occur in the watershed. The predominant soil were classified as Typic Udorthent (45 %), Arenic Paleudult (19 %), Typic Paleudalf (12 %), Typic Paleudult (4 %), Typic Eutrochrept (4 %), Psammentic Paleudult (3 %) according to (Soil Survey Staff, 1990). Other soil types accounted with less than 3 % of area each. In recent years no significant land use changes have been observed, so the available data for land use for 1995 composed of sugarcane (68 %), pastures (13 %), forests (18 %), corn (0.1 %) and non-agricultural use (1.6 %) were used (Figure 01 a). Management files for WEPP were computed based on the methods described in Flanagan & Nearing (1995).
The input parameters were adjusted to represent local crops and pasture management and the forest parameters. The C and P values for USLE were defined based on bibliographic data, selecting the values that could better represent local management. Soil input files for WEPP were based on equations suggested by Flanagan & Nearing (1995) and calculated for each soil type based on soil analysis results of 223 sampling points. Soil erodibility or USLE’s K factors were calculated based on the same soil analysis data following the general procedure described by Wischmeier et al. (1971) adapted to Brazilian conditions by Denardin (1990). Local climatic data from daily 30 years of record were used to calculate climate inputs. The climate input file for WEPP was generated using CLIGEN ver. 4.3. (Nicks et al. 1995) running a 100 years simulation. The USLE R factor was estimated, based on the same climatic data, as 6,235 MJ ha-1 mm h-1 using the procedures described by Lombardi & Moldenhauer (1992). Altitude information was extracted from a topographic contour map at scale 1:10,000 with an original vertical resolution of 5 m, interpolated to 2 m vertical resolution using GIS triangulation tools. Soil erosion estimations were made for WEPP and USLE using the same transects (969 transects with a mean length of 212 m distributed uniformly over the entire area) defined manually following straight paths of surface runoff. Soil loss values were calculated for each intersection point of the transects with the contour line map (a total of 10,639 points or about 5 points per hectare) and interpolated to a raster format (pixel of 10 x 10 m) by kriging using a spherical variogram. The GIS procedures were carried out by means of TNTmips (Micro Images) version 6.2. All data were georeferenced based on the metric Universal Transverse Mercator coordinate system (zone 23 S, ellipsoid IUGG 1967, datum South American 1969 Brazil).
3 RESULTS AND DISCUSSION
EDI was effective as a GIS interface for erosion rates calculation on a georeferenced basis for both models, USLE and WEPP. The cartographic result of erosion estimations by EDI after GIS raster interpolation is shown for USLE in Figure 01 b and for WEPP in Figure 01 c.
Figure 01– a) Land use of the Ceveiro watershed. b) Soil erosion estimation by Universal Soil Loss Equation (USLE). c) Soil erosion estimation by Water Erosion Prediction Project (WEPP) model, negative values indicate sediment depositions and were all grouped and flagged in white.
The soil erosion maps produced with EDI’s output data clearly illustrate the models’ theoretical assumptions. USLE does not estimate sediment deposition. Thus, the usual sediment trapping landforms (i.e. toe slopes with lower steepness, floodplains and riparian forests) identified with WEPP simulation (Figure 1 c) are not present on the map of USLE (Figure 1 b). In these positions, USLE estimated a reduction in erosion rates due to a decrease of C, P and S factors but soil loss is indicated as the only process. The conceptual design of USLE in not estimating deposition may restrict its application in studies where off-site erosion effects are important. For both models erosion estimations were sensitive for topographic and land use changes. On the pasture USLE showed lower erosion rates as compared to the same topographic position with sugarcane. WEPP
also estimated low erosion or deposition rates for the pastures. For both models, erosion rates increased from the flatter upper slopes to the steeper mid or end slopes, showing high sensitivity to slope steepness and length. However, this increase was more significant for USLE, showing that this model is more sensitive to topographic related variables. Higher soil loss estimations for the Revised Universal Soil Loss Equation or RUSLE (Renard et al., 1997) as compared to WEPP were attributed to a lower sensitivity to crop related parameters and higher sensitivity to topographic factors in RUSLE (Nearing et al., 1990). The differences observed in soil loss estimations can be related to the theoretical background of each model and agree with other sensitivity studies conducted under controlled experimental conditions. This is an important indication towards the pure interface character of EDI. EDI by itself does not interfere in the soil erosion estimation procedure, preserving all sensitivity, trends and assumptions from the original models.
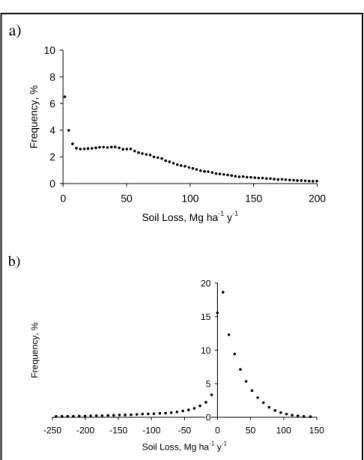
The great spatial variability of erosion rates, observed for both models, makes clear that it is important to consider erosion as a spatial variable. The mean values of soil erosion for WEPP and USLE are shown in Table 1 and the frequency histograms in Figure 2.
Table 01 – Mean soil erosion values and sediment delivery ratio (SDR) estimated for the Ceveiro watershed by Universal Soil Loss Equation (USLE) and Water Erosion Prediction Project (WEPP) model.
‡ Not estimated by USLE
The mean erosion rates estimated by USLE of 64 Mg ha-1 y-1 and by WEPP of 26 Mg ha-1 y-1 (excluding the depositional areas) indicate that the models estimated erosion differently (USLE about 2.5 times more than WEPP) and that the erosion rates are greater than usually accepted values of soil loss tolerance of 12 Mg ha-1 y-1 or less (Grossman & Berdanier, 1982). This information is important and may indicate that the models’ input parameters still need calibration in relation to determined erosion rates to make its performance more comparable or precise. WEPP also allowed the definition of
Parameter Unit WEPP USLE
Erosion area ha 1567 2000
Mean erosion Mg ha-1 y-1 26 64
Sedimentation area ha 433 ‡
Mean Sedimentation Mg ha-1 y-1 66 ‡
11
sedimentation process and the calculation of the sediment delivery ratio.
The frequency histograms represented in Figure 02 show that both models concentrated the values around zero (classes with highest frequencies). Although, the frequency decreased more slowly by USLE towards the higher soil erosion values as compared to WEPP. Probably, the high sensitivity to topographic related variables by USLE and the long slopes of the transects are the variables related to the high erosion values. a)
b)
Figure 02 – Frequency histograms for erosion
predictions in the Ceveiro watershed for a) Universal Soil Loss Equation (USLE) and b) Water Erosion Prediction Project (WEPP) model.
The cartographic representation of erosion rates gives another dimension and value to this kind of information. Technically, the advantages are related to the possibility of comparing these data to other spatially variable information or including erosion rates as georeferenced data in more complex models. The result will be a more comprehensive and integrated evaluation of the significance of the erosion process as compared to the same approach considering mean soil loss values. Another important aspect of the cartographic
representation, especially considering land use planning actions, is to represent erosion rates in an understandable format. A farmer not familiar with soil erosion research, may find it difficult to understand the meaning of a specific soil erosion rate that was estimated to occur in part of the farm, but probably will promptly react on seeing that part of the area is flagged with a red color on a soil erosion map.
The versatility of EDI to adapt to large databases has not yet been systematically evaluated. In theory, the program was designed to operate the same way, independent of the size of the input data. To give some indication on EDI’s performance, the time needed for preparing and processing the WEPP simulation (more time consuming than for USLE’s application) for the example presented in this paper was measured. On an office PC (Pentium® III, 866 Mhz processor) the 969 transects were successfully processed in 5 hours including: a) the creation of EDI’s input files via GIS, b) initial file processing in EDI, c) automatic WEPP calculations, d) georeferencing of WEPP output files via EDI, and e) importing soil erosion results back in GIS.
4 CONCLUSIONS
• The Erosion Database Interface (EDI) is an efficient program for georeferenced erosion prediction based on the Universal Soil Loss Equation (USLE) and Water Erosion Prediction Project (WEPP) model.
• The presentation of erosion rates as a georeferenced information gives a new dimension to the erosion process as compared to its presentation as mean rates, more useful for land use planning and more comprehensive for basic research.
• The practical example showed that EDI can operate
in conditions similar to the Brazilian small watershed programs and thus, be an useful tool to support quantitative decisions related to erosion.
5 REFERENCES
BUSSCHER, W.J., REEVES, D.W., KOCHMANN, R.A., BAUER, P.J., MULLINS, G.L., CLAPHAM, W.M., KEMPER, W.D., GALERANI, P.R. Conservation farming in southern Brazil: using cover crops to decrease erosion and increase infiltration. Journal
of Soil and Water Conservation, v.51, n.3, p.188-192, 1996.
CIPRA, B. Revealing uncertainties in computer models. Science, v.287, n.5455, p.960-961, 2000.
Revista Brasileira de Agrocomputação, v.1, n.1, p.5-12 , Jun.2001
0 2 4 6 8 10 0 50 100 150 200 Soil Loss, Mg ha-1 y-1 F re q u e n c y , % 0 5 10 15 20 -250 -200 -150 -100 -50 0 50 100 150 Soil Loss, Mg ha-1 y-1 F re q u e n c y , %
CLARK II, E.H., HAVERKAMP, J.A., CHAPMAN, W., 1985.
Eroding soils. The off-farm impacts. Washington. The
Conservation Foundation, 1985. 252p.
DAILY, G., DASGUPTA, P., BOLIN, B., CROSSON, P., GUERNY, J. DU, EHRLICH, P., FOLKE, C., JANSSON, A.M., KAUTSKY, N., KINZIG, A., LEVIN, S., MÄLER, K.G., PINSTRUP-ANDERSEN, P., SINISCALCO, D., WALKER, B. Food production, population growth, and the environment.
Science, v.281, n.5381, p.1291-1292, 1998.
DENARDIN, J.E. Erodibilidade do solo estimada por meio de
parâmetros físicos e químicos. 1990. 120f. Tese (Doutorado em
Solos e Nutrição de Plantas), Escola Superior de Agricultura “Luiz de Queiroz”, Universidade de São Paulo, Piracicaba
FLANAGAN, D.C., NEARING, M.A. USDA-Water Erosion
Prediction Project: Hillslope profile and watershed model documentation. Indiana. NSERL Report #10, USDA-ARS
National Soil Erosion Research Laboratory, West Lafayette, 1995. FOSTER, G.R., WISCHMEIER, W.H. Evaluating irregular slopes for soil loss prediction. Transactions of American Society of
Agricultural Engineering, v.17, n.1, p.305-309, 1974.
GRAAFF, J. de. The price of soil erosion, an economic evaluation
of soil conservation and watershed development. 1996. 300f.
Wageningen, Ph.D Thesis (Landbouwuniversiteit te Wageningen). GROSSMAN, R.B., BERDANIER, C.R. Erosion tolerance for cropland: application of the soil survey data base. In Determinants
of erosion tolerance. American Society of Agronomy. 1982.
p.113-130.
HAMLETT, J.M., MILLER, D.A., DAY, R.L., PETERSON, G.W., BAUMER, G.M., RUSSO, J. Statewide GIS-based ranking of watersheds for agricultural pollution prevention. Journal of Soil
and Water Conservation, v.47, n.5, p.399-404, 1992.
JONES, K. H. A comparison of algorithms used to compute hill slope as a property of the DEM. Computers & Geosciences, v.24, n.4, p.315-323, 1998.
LAFLEN, J.M., LANE, L.J., FOSTER, G.R. WEPP: a new generation of erosion prediction technology. Journal of Soil and water
Conservation, v.46, n.1, p.34-38, 1991.
LAL, R. Erosion-crop productivity relationships for soils of Africa.
Soil Science Society America Journal, v.59, n.3, p.661-667,
1995.
LANE, L.J., RENARD, K.G., FOSTER, G.R., LAFLEN, J.M. Development and application of modern soil erosion prediction technology. Australian Journal of Soil Research, v.30, n.6, p.893-912, 1992.
LOMBARDI NETO, F., MOLDENHAUER, W.C. Erosividade da chuva: sua distribuição e relação com perdas de solo em Campinas (SP). Bragantia, v.51, n.2, p.189-196, 1992.
MATSON, P.A., PARTON, W.J., POWER, A.G., SWIFT, M.J. Agricultural intensification and ecosystem properties. Science, v.277, n.5325, p.504-509, 1997.
MELLEROWICZ, K.T., REES, H.W., CHOW, T.L., GHANEM, I. Soil conservation planning at watershed level using the Universal Soil Loss Equation with GIS and microcomputer technologies: A case study. Journal of Soil and Water Conservation, v.49, n.2, p.194-199, 1994.
NEARING, M.A., DEER-ASCOUGH, L., LAFLEN, J.M. Sensivity analysis of the WEPP Hillslope Profile Erosion Model.
Transactions of the American Society of Agricultural Engineering, v.33, n.3, p.839-849, 1990.
NICKS, A.D., LANE, L.J., GANDER, G.A., 1995. Weather Generator. In: FLANAGAN, D.C.; NEARING, M.A. (ED.)
USDA-Water Erosion Prediction Project: Hillslope profile and watershed model documentation. West Lafayette:
USDA-ARS-MWA-SWCS, 1995. p.2.1-2.22.
PIMENTEL, D., HARVEY, C., RESOSUDARMO, P., SINCLAIR, K., KURZ, D., MCNAIR, M., CRIST, S., SHPRITZ, L., FITTON, L., SAFFOURI, R., BLAIR, R. Environmental and economic costs of soil erosion and conservation benefits. Science, v.267, n.5217, p.1117-1123, 1995.
RENARD, K.G., FOSTER, G.R, WEESIES, D.K., TODER, D.C.
Predicting Soil Erosion by Water: A Guide to Conservation Planning with the Revised Universal Soil Loss Equation (RUSLE). U.S. Department of Agriculture, Agricultural handbook
703, 1997. 404p.
RENARD, K.G., MAUSBAH, M.J. Tools for conservation. In:
Proceedings of Soil Erosion and Productivity Workshop,
Minnesota, University of Minnesota, 1990. p.55-64.
RISSE, L.M., NEARING, M.A., NICKS, A.D., LAFLEN, J.M. Error assessment in the Universal Soil Loss Equation. Soil Society of
America Journal, v.57, n.4, p.825-833, 1993.
SABAVI, M.R., FLANAGAN, D.C.; HEBEL, B., ENGEL, B.A. Application of WEPP and GIS-GRASS to a small watershed in Indiana. Journal of Soil and Water Conservation, v.50, n.5, p.477-483, 1995.
SOIL SURVEY STAFF. Keys to Soil Taxonomy, 4 ed. , Blacksburg, Virginia, 1990. 258p. (SMSS technical monograph No. 6). SRINIVASAN, R., ENGEL, B.A. Effect of slope prediction methods
on slope and erosion estimates. Applied Engineering in
Agriculture, v.7, n.6, p.779-783, 1991.
WISCHMEIER, W.H., SMITH, D.D. Predicting rainfall erosion
losses: a guide to conservation planning. Washington, USDA:
Agricultural Handbook - 537. D.C., 1978. 58p.
WISCHMEIER, W.H.; JOHNSON, C.B., CROSS, B.W. A soil erodibility nomograph for farmland and construction sites.
Journal of Soil and Water Conservation, v.26, n.5, p.189-193,