Agricultural Economics Report No. 344
SB
205
.S7
N64
no.
WORLD WHEAT POLICY
SIMULATION MODEL:
PRELIMINARY BASELINE
Martin Benirschka
Won W. Koo
Department of Agricultural Economics * Agricultural Experiment Station
North Dakota State University * Fargo, ND 58105-5636
Acknowledgments
The authors extend appreciation to Dr. Marvin Duncan and Dr. Demcey Johnson for
their constructive comments and suggestions. Special thanks go to Dr. William Meyers,
Professor of Agricultural Economics, Iowa State University, for his financial support and
encouragement. The authors thank Ms. Charlene Lucken, who provided editorial comments,
and Ms. Carol Jensen, who helped to prepare the manuscript.
This research was conducted under the Northern Plains International Trade Research
Program funded by USDA-CSREES special research grant (Grant No. 92-34192-7195),
financial support from the North Dakota Wheat Commission (ND Project No. 1392), and
special subcontract with Iowa State University (ISU Contract No. 92-38812-7261 and ND
Table of Contents
Page
List of Tables ...
ii
List of Figures ...
...
...
ii
Highlights ...
...
.
iii
Introduction ...
...
1
World Wheat Trade ...
2
Exporting Countries ...
2
U nited States ...
...
...
2
C anada . . . .. . . .. . .. . . .
8
European U nion ...
10
A ustralia . . . 11
A rgentina . . . .. . . . .. . . . .. . . . .. .. . . . 11
Importing Countries ...
...
11
China ...
.. ...
...
11
Former Soviet Union
...
...
. 14
K orea ...
...
...
.14
Japan . . . 14
List of Tables
United States, Changes 1993/94 to 2004/05 . . . .
... . . .. . . .
Canada, Changes 1993/94 to 2004/05 ...
European Union, Changes 1993/94 to 2004/05 ...
Australia and Argentina, Changes 1993/94 to 2004/05 ...
World Trade, Changes 1993/94 to 2004/05 ...
List of Figures
Figure
1
World Wheat Trade, 1993/94 to 2004/05 ...
2
Wheat Export Prices, 1993/94 to 2004/05 ...
3
U.S. Wheat Production, 1993/94 to 2004/05 ...
4
U.S. Domestic Wheat Consumption, 1993/94 to 2004/05
5
U.S. Wheat Exports, 1993/94 to 2004/05 ...
6
U.S. Wheat Ending Stocks, 1993/94 to 2004/05 ...
7
China Wheat Imports, 1993/94 to 2004/05 ...
8
Former Soviet Union Wheat Imports, 1993/94 to 2004/05
9
Korea Wheat Imports, 1993/94 to 2004/05 ...
10
Japan Wheat Imports, 1993/94 to 2004/05...
.
. . .
.
. . . . .
.
. . . 3
. .
. . . .
.
. . .
6
. . . .
. 7
...
9
. . . 15
. . . 16
. . . 17
ii
Table
1
2
3
4
5
10
10
11
12
Highlights
*
From 1993/94 to 2004/05, wheat export prices increase by 10.2 percent. During this
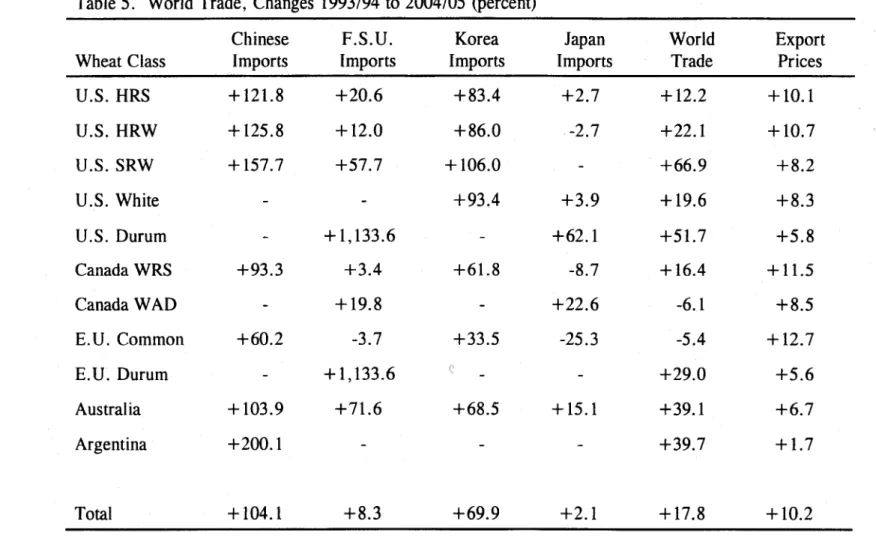
period, world wheat trade expands by 17.8 percent. In 2004/05, total world wheat
trade equals 115,355 thousand metric tons.
*
Strongest export growth occurs for U.S. soft red winter wheat (66.9%) and U.S. durum
wheat (51.7%). E. U. common wheat exports and Canadian western amber durum
wheat exports decrease by 5.4% and 6.1 %, respectively.
*
In 2004/05, the most important exporters are the United States (39,338 thousand metric
tons), Canada (27,507 thousand metric tons), the European Union (24,197 thousand
metric tons), Australia (16,193 thousand metric tons), and Argentina (8,120 thousand
metric tons).
*
In 2004/05, the most important importers of wheat are China (20,733 thousand metric
tons), the former Soviet Union (16,195 thousand metric tons), Korea (7,035 thousand
metric tons), and Japan (6,019 thousand metric tons).
*
From 1993/94 to 2004/05, total U.S. wheat production increases by 18. 7percent. The
largest increases occur for durum wheat (65.1 %) and soft red winter wheat (32.6%).
During this period, consumption grows by 15.9%, while exports increase by 25.9%.
*
From 1993/94 to 2004/05, total Chinese wheat imports grow by 104.1%. Import
growth is strongest for Argentine wheat and U.S. soft red winter wheat. In 2004/05,
the most important wheat classes in China are Canadian western red spring wheat and
U.S. hard red winter wheat.
World Wheat Policy Simulation Model:
Preliminary Baseline
Martin Benirschka and Won W. Koo*
INTRODUCTION
This report summarizes the baseline for the World Wheat Policy Simulation Model.
Assuming that current farm policies are unchanged, the baseline projects demand and supply
conditions for the next ten years. Thus, the baseline summarizes a likely scenario of supply
and demand conditions for wheat that serves as point of reference for policy analysis.
Wheat is a differentiated product. Substitution among wheat classes is imperfect, and
consumer preferences differ among countries, suggesting that wheat characteristics are an
important determinant of trade flows. The World Wheat Policy Simulation Model is a partial
equilibrium model that distinguishes among 11 classes of wheat. The wheat classes included
are Argentine wheat, Australian wheat, Canadian western red spring wheat, Canadian western
amber durum wheat, E.U. common wheat, E.U. durum wheat, U.S. hard red spring wheat,
U.S. hard red winter wheat, U.S. soft red winter wheat, U.S. white wheat, and U.S. durum
wheat. Essentially, this model is a multi-commodity model where all commodities are classes
of wheat. It is used for evaluating the effects on the world wheat economy of farm and trade
policies.
The model distinguishes 5 exporting countries (Argentina, Australia, Canada, the
United States, and the European Union) and 13 importing countries and regions (Algeria,
Brazil, China, Egypt, the Former Soviet Union, Japan, Mexico, Morocco, South Korea,
Taiwan, Tunisia, Venezuela, and a Rest of the World region). The model simulates
production, consumption, stocks, exports, and trade flows for wheat classes over a 10- to
15-year period. It is a dynamic partial equilibrium model. In every year, the model is solved
for a set of equilibrium prices such that for each wheat class demand equals supply.
The model is calibrated to the 1990 to 1992 period. Thus, the model replicates average
supply and demand conditions that prevailed during this period. The model is used to project
supply and demand conditions for the 1993/94 to 2004/05. Thus, the 1993/94 is the first year
of the simulation. The baseline simulation reported here is a likely scenario to prevail if
current policies continue. It serves as a point of reference for policy analysis and evaluation.
As with every model, the baseline results reported here should be used with caution.
Modeling is an art, and the World Wheat Policy Simulation Model is complex. The baseline
simulation is based on many assumptions.
*Research associate and professor, respectively, in the Department of Agricultural
Economics, North Dakota State University, Fargo.
WORLD WHEAT TRADE
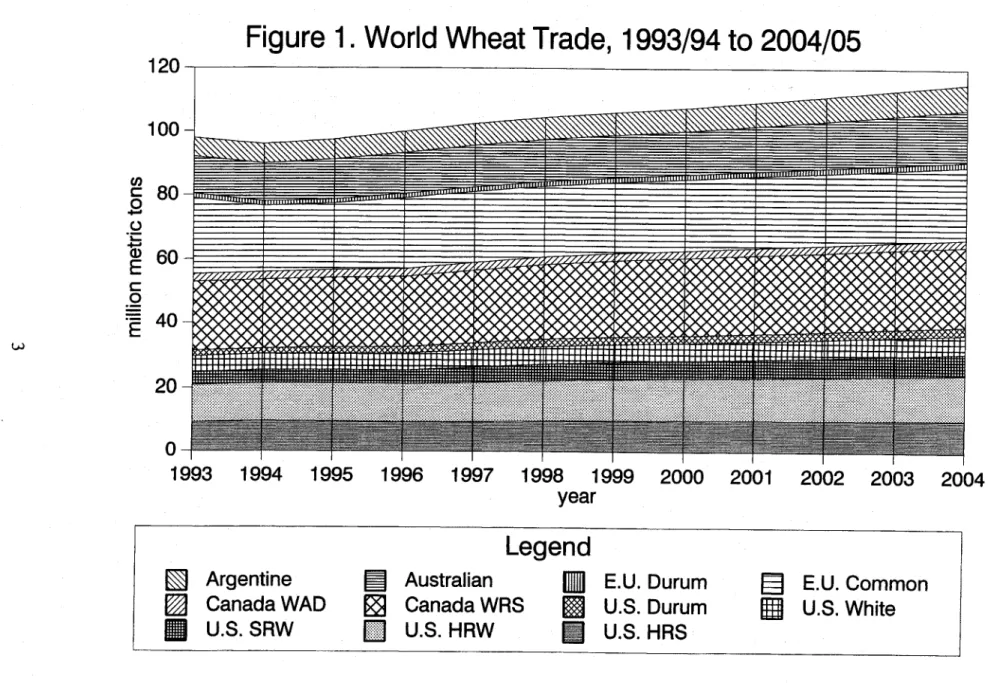
From 1993/94 to 2004/05, total world wheat trade is projected to increase by 17.8%
from 97,920 thousand metric tons to 115,355 thousand metric tons (Figure 1). Except for
Canadian western amber durum wheat and E.U. common wheat, trade of all wheat classes
increases. Canadian western amber durum exports decrease by 6.1 %, and E.U. common
wheat exports decrease by 5.4%. Exports of U.S. soft red winter wheat increase the most
(66.9%), followed by U.S. durum wheat exports (51.7%). Australian, Argentine, and E.U.
durum wheat exports increase by 39.1%, 39.7%, and 29.0%, respectively. Exports of U.S.
hard red winter wheat (22.1 %), U.S. hard red spring wheat (12.2%), U.S. white wheat
(19.6%), and Canadian western red spring wheat (16.4%) increase only modestly. In
2004/05, the most important markets for wheat are China, the former Soviet Union, Korea,
and Japan.
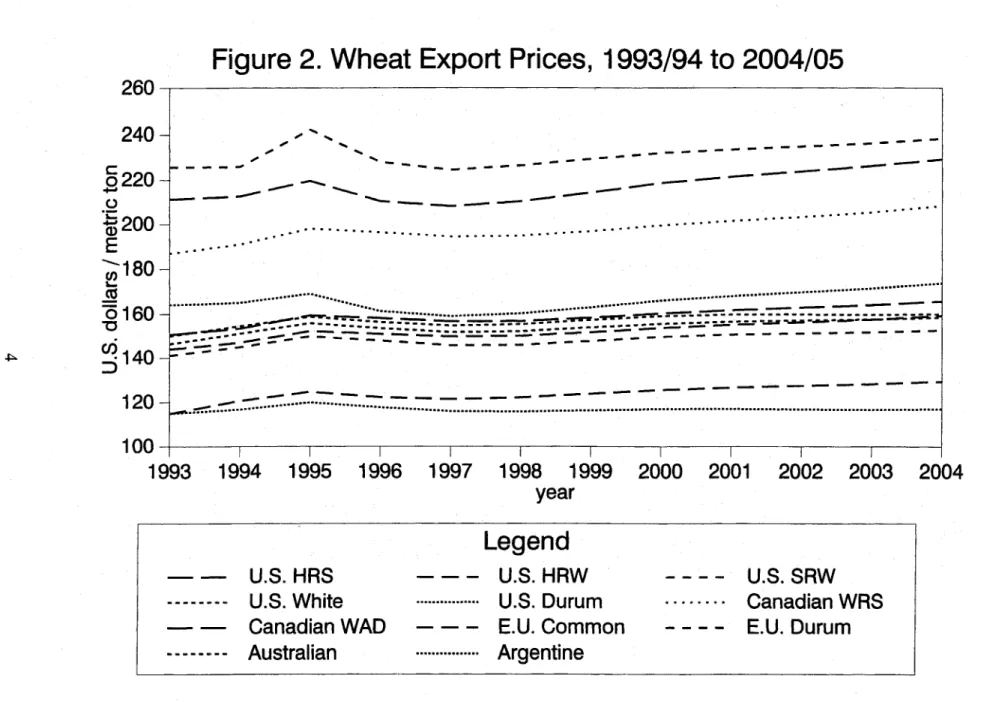
From 1993/94 to 2004/05, the average wheat export price increases by 10.2% from
$149.2 per metric ton to $164.4 per metric ton (Figure 2). However, prices do not increase
continuously over this period. Prices peak in 1995/96, bottom in 1997/98, and grow
thereafter until 2004/05. Prices increase the most for E.U. common wheat (12.7%), Canadian
western red spring wheat (11.5%), U.S. hard red spring wheat (10.1%), and U.S. hard red
winter wheat (10.7%). Thus, wheat classes with small export growth experience relatively
large increases in price. Argentine wheat export prices increase by only 1.7%.
EXPORTING COUNTRIES
United States
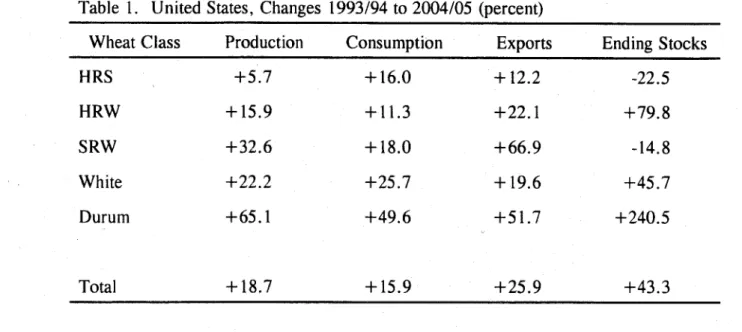
Total U.S. wheat production grows by 18.7% from 1993/94 to 2004/05 (Table 1,
Figure 3). The largest increases in production occur for U.S. durum wheat (65.1 %) and U.S.
soft red winter wheat (32.6%). U.S. hard red spring wheat production increases by only
5.7%.
Total wheat area harvested increases from 62.5 million acres to 65.7 million acres,
while average yields increase from 38.2 bushels/acre to 43.1 bushels/acre. Hard red spring
wheat acreage decreases by 0.8 million acres, while the acreage of the other U.S. wheat
classes increases.
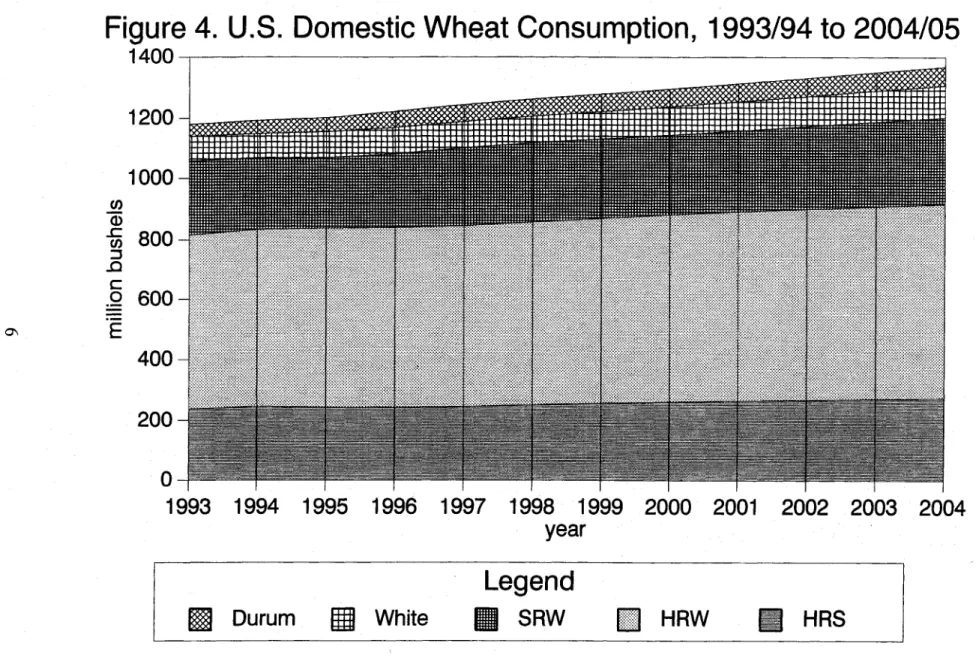
U.S. wheat consumption is projected to grow by 15.9%, while wheat exports increase
by 25.9% (Figure 4). The largest increases in U.S. wheat consumption occur for durum
wheat (49.6%) and white wheat (25.7%). Exports increase the most for soft red winter wheat
(66.9%) and durum wheat (51.7%) (Figure 5).
Figure 1.
World Wheat Trade, 1993/94 to 2004/05
120
100
C
80
0
(
60
E
0
S40
20
0
1993
1994
1995
1996
1997
1998
1999
2000
2001
2002
2003
20(
year
Legend
•
Argentine
Australian
E.U. Durum
E.U. Common
^
Canada WAD
Canada WRS
U.S. Durum
U.S.
White
M
U.S. SRW
U.
S. HRW
U.S. HRS
Figure 2. Wheat Export Prices, 1993/94 to 2004/05
.. ,gas...--+.=...
_..._06 " O-ew
...
-...
..
_....-.. .
.
.
..
, , . .. -= ·~~~~~..
. . .. . .. . . .I··.··.·..· . · · · ·. ·~·
. . . .. ***... *. ... · r,,... . .~r··
.. _____ 2 _ nr ==~f t~=J ;4 .Ef~553 --- ---SZ ---···)~··~··~· ·~~···
..I
I
I
I
I
i
I
I
I
I
1994
1995
1996
1997
1998
1999
2000
2001
2002
2003
year
2004
260-
240-
So220-_200-E
S
180-
75160-
0140-
120-1
nn
1993
Legend
--
U.S.HRS
---
U.S.HRW
----
U.S.SRW
SU.S.
White
...
U.S. Durum
... Canadian
WRS
- -
Canadian WAD
-
-
E.U.
Common
----
E.U. Durum
-
iI
Figure 3. U.S. Wheat Production, 1993/94 to 2004/05
oJnnnt•tl 1993 1994 1995 1996 1997 1998 1999 2 0I3
in
onnA
year
3uVV
2500
n
2000
ci
(0
O
0
E
1000
500
0
Figure 4. U.S. Domestic Wheat Consumption, 1993/94 to 2004/05
1400-1200
1000
c)
-
800
c-.0
600
E
400-
20
0-1993 1994 1995
1996 1997
1998 1999 2000 2001
2002 2003 2004
Figure 5. U.S. Wheat Exports,
1993/94 to 2004/05
1600
1400
1200
cn
-1000
t-S800
0
O
S600
400
200
0
1993 1994 1995 1996 1997 1998 1999 2000 2001
2002 ;
year
2003
2004
Table 1. United States, Changes 1993/94 to 2004/05 (percent)
Wheat Class
Production
Consumption
Exports
Ending Stocks
HRS
+5.7
+16.0
+12.2
-22.5
HRW
+15.9
+11.3
+22.1
+79.8
SRW
+32.6
+18.0
+66.9
-14.8
White
+22.2
+25.7
+19.6
+45.7
Durum
+65.1
+49.6
+51.7
+240.5
Total
+18.7
+15.9
+25.9
+43.3
Total U.S. ending stocks increase by 43.3% from 1993/94 to 2004/05. Ending stocks
of hard red spring wheat and soft red winter wheat decrease by 22.5% and 14.8%
respectively. Ending stocks of hard red winter wheat, white wheat and durum wheat increase
(Figure 6).
Canada
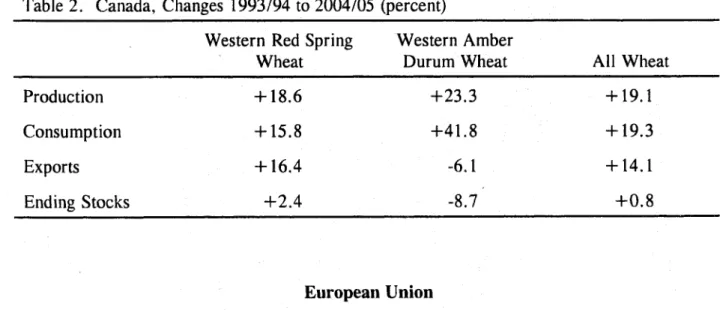
From 1993/94 to 2004/05, Canadian western red spring wheat and western amber
durum wheat production increase by 18.6% and 23.3%, respectively (Table 2). Western red
spring wheat area increases from 11.7 million hectares to 12.4 million hectares, while western
amber durum wheat area increases from 1.2 million hectares to 1.3 million hectares. Western
red spring wheat domestic consumption increases by 15.8% , exports increase by 16.4%, and
ending stocks increase by 2.4%. Western amber durum wheat domestic consumption increases
by 41.8%, exports decrease by 6.1%, and ending stocks decrease by 8.7%.
Figure 6.
1UUU
800
600
400
U.S. Wheat Ending Stocks, 1993/94 to 2004/05
200
I III I II. I1
1994
1995
1996
1997 1998 1999 2000 2001
2002 2003 2004
year
sI)
a)
(Ci)
0
E
F=
0
1993
Table 2. Canada, Changes 1993/94 to 2004/05 (percent)
Western Red Spring
Western Amber
Wheat
Durum Wheat
All Wheat
Production
+18.6
+23.3
+19.1
Consumption
+15.8
+41.8
+19.3
Exports
+16.4
-6.1
+14.1
Ending Stocks
+2.4
-8.7
+0.8
European Union
Common wheat production in the European Union increases by 16.2% from 1993/94 to
2004/05 (Table 3). Domestic consumption is projected to increase by 18.9%, while exports
decrease by 5.4%. Ending stocks of common wheat grow by 6.1%. Thus, the stocks-to-use
ratio for common wheat declines in the European Union. While exports of E.U. common
wheat decline by 6.1 %, imports of bread wheat do increase by 48.4%.
Durum wheat production increases by 15.7%, and imports of durum wheat increase by
161.7%. E.U. durum wheat consumption increases by 16.3%, and exports grow by 29%.
Durum wheat ending stocks increase by 18%.
Table 3. European Union, Changes 1993/94 to 2004/05 (percent)
Common Wheat
Durum Wheat
All Wheat
Production
+16.2
+15.7
+16.1
Imports
+48.4
+161.7
+59.9
Consumption
+18.9
+16.3
+18.6
Exports
-5.4
+29.0
-3.6
Australia
Australia's wheat production grows by 22.5% over the simulation period (Table 4).
Wheat acreage increases from 9.9 million hectares in 1993/94 to 10.9 million hectares
2004/05. While domestic consumption decreases by 20.2%, exports increase by 39.1%.
Ending stocks increase by 44%.
Argentina
Argentine production increases by 11.6% (Table 4). This increase is due to increases in
yields. Area harvested does not change much. It declines by 4,000 hectares, a relatively
small decrease given a wheat area of about 4.6 million hectares. Domestic consumption
decreases by 22.8%, while exports increase by 39.7%. Ending stocks increase by 80.9%.
Table 4. Australia and Argentina, Changes 1993/94 to 2004/05 (percent)
Australia
Argentina
Production
+22.5
+11.6
Consumption
-20.2
-22.8
Exports
+39.1
+39.7
Ending Stocks
+44.0
+80.9
IMPORTING COUNTRIES
China
Chinese wheat imports increase by 104.1%, from 10,156.7 thousand metric tons in
1993/94 to 20,733.5 thousand metric tons in 2004/05 (Table 5, Figure 7). The largest import
growth occurs for Argentine wheat (300. 1%) and U.S. soft red winter wheat (257.7%).
Canadian western red spring wheat imports increase by only 193.3%. However, in 2004/05
Canadian western red spring wheat is still the most important Chinese import (8,694.9
thousand metric tons). For comparison, the next important wheat class, U.S. hard red winter
wheat imports equal 3,831.1 thousand metric tons in 2004/05. In terms of market size, China
is the single most important importing country.
Table 5. World Trade, Changes 1993/94 to 2004/05 (percent)
Wheat Class
U.S. HRS
U.S. HRW
U.S. SRW
U.S. White
U.S. Durum
Canada WRS
Canada WAD
E.U. Common
E.U. Durum
Australia
Argentina
Chinese
Imports
+121.8
+125.8
+157.7
+9
+6
+10
F.S.U.
Imports
+20.6
+12.0
+57.7
-
+1,133.6
3.3
+3.4
-
+19.8
0.2
-3.7
-
+1,133.6
13.9
+71.6
+200.1
Korea
Imports
+83.4
+86.0
+106.0
+93.4
+61.8
+33.5
+68.5
+68.5
Japan
Imports
+2.7
-2.7
+3.9
+62.1
-8.7
+22.6
-25.3
+15.1
World
Trade
+12.2
+22.1
+66.9
+19.6
+51.7
+16.4
-6.1
-5.4
+29.0
+39.1
+39.7
Export
Prices
+10.1
+10.7
+8.2
+8.3
+5.8
+11.5
+8.5
+12.7
+5.6
+6.7
+1.7
Total +104.11
+8.3
+69.9
2 +17.8
+
10.2
Figure
7. China Wheat Imports, 1993/94
to 2004/05
1993
1994
1995
1996
1997
1998
1999
2000
2001
2002
2003
2004
year
Legend
^
Argentine
Australian
E
E.U.Durum
E.U. Common
^
Canada WAD
Canada WRS
U.S. Durum
g
U.S.
White
SU.S.SRW
U.S. HRW
U.S.
HRS
20
O
15
E
c
o10
E
5
0
5C
Former Soviet Union
Total wheat imports of the former Soviet Union grow by 8.3% from 1993/94 to
2004/05 (Table 5, Figure 8). In 2004/05, the most important wheat classes imported are E.U.
common wheat (6,196 thousand metric tons) and Canadian western red spring wheat (3,987
thousand metric tons). However, the growth of imports for these classes is insignificant.
While E.U. common wheat imports actually decrease by 3.7%, Canadian western red spring
wheat imports increase only by 3.4 percent. The U.S. wheat classes experiencing strongest
growth are durum wheat and soft red winter wheat.
Korea
Korea is emerging as a major importer of wheat. Total wheat imports increase by
169.9% from 1993/94 to 2004/05 (Table 5, Figure 9). Thus, at the end of this period, Korean
wheat imports exceed Japanese wheat imports. Since Korea uses large amounts of wheat for
feed, the increase in imports is likely to be feed wheat. Import growth is strongest for U.S.
soft red winter wheat (106%) and U.S. white wheat (93.4%). However, imports of U.S. hard
red winter wheat (86.0%) and U.S. hard red spring wheat grow also strongly. Imports of all
U.S. wheat classes grow faster than imports of Australian wheat (68.5 %), Canadian western
red spring wheat (61.8%), and E.U. common wheat (33.5%). However, with imports of
2,282 thousand metric tons, Canadian western red spring wheat is still the most important
wheat class in 2004/05.
Japan
Japan, while a major market for wheat, shows only minor growth of wheat imports.
From 1993/94 to 2004/05, total wheat imports increase only by 2.1 % (Table 5, Figure 10).
While durum wheat imports are growing fast, durum wheat has only a minor share of total
Japanese wheat imports. The most significant growth occurs for Australian wheat (15.1%),
while imports of E.U. common wheat and Canadian western red spring wheat are decreasing
by 25.3% and 8.7%, respectively. Overall, Japanese wheat imports remain evenly distributed
among sources. In 2004/05, Australia is the major supplier of wheat (1,459 thousand metric
tons), but only by a slim margin. With 1,304 thousand metric tons, Canadian western red
spring wheat is the second most important wheat class. With the exception of hard red winter
wheat, imports of all U.S. wheat classes increase. Imports of hard red winter wheat falls
slightly by 2.7%.
Figure 8.
r'f%
Former Soviet Union Wheat Imports, 1993/94
to 2004/05
5
0
1993
1994
1995
1996
1997
1998
1999
2000
2001
2002
2003
2004
year
15
cn
O
C:
0
E
E
0
Legend
D Argentine
Australian
m
E.U. Durum
E.U.
Common
g
Canada WAD
Canada WRS
U.S. Durum
U.S.
White
M
U.S.SRW
U.S. HRW
U.S.
HRS
Figure 9. Korea Wheat Imports, 1993/94 to 2004/05
1994
1995
1996
1997
1998
1999
year
2000
2001
2002
2003
2004
n0
7
6
34
E
23
2
1
0
1993
Legend
•
Argentine
F
Australian
m[
E.U. Durum
E
E.U.
Common
Figure 10. Japan Wheat Imports, 1993/94
to 2004/05
7
6-
(u5-C:
-W
=0
4
-ci)
E
c3-oE
E21
-
0-1993
1994
1995
1996
1997
1998
1999
2000
2001
2002
2003
2004
year
Legend
^
Argentine
f
Australian
!
E.U. Durum
E.U.
Common
•
Canada WAD
Canada WRS
U.S. Durum
U.S.
White
U.S. SRW
S
U.S. HRW
U.S.HRS
APPENDIX
12/15/1995 23:28:39
NDSU World Wheat Policy Simulation Model Test Scenario (Base Period 1990-1992)
United States - Wheat Area Planted (million acres)
1993 1994 1995 1996 1997 1998 1999 2000 2001 2002 2003 2004 HRS 16.4 16.1 15.1 15.2 15.3 15.5 15.6 15.5 15.5 15.5 15.5 15.5 HRW 36.3 35.6 35.7 35.9 36.4 36.7 36.8 36.9 37.0 37.3 37.5 37.8 SRW 11.0 10.0 10.0 10.4 11.0 11.3 11.2 11.2 11.4 11.7 11.9 12.2 White 5.4 5.4 5.4 5.5 5.5 5.5 5.5 5.5 5.5 5.6 5.6 5.6 Durum 2.6 2.7 3.7 4.0 4.1 3.9 3.8 3.8 3.9 3.9 3.9 4.0 All Wheat 71.6 69.8 69.9 71.0 72.4 73.0 72.9 73.0 73.3 73.9 74.5 75.0 United States - Wheat Area Harvested (million acres)
1993 1994 1995 1996 1997 1998 1999 2000 2001 2002 2003 2004 HRS 15.7 15.4 14.6 14.7 14.8 15.0 15.0 15.0 15.0 14.9 14.9 14.9 HRW 29.5 28.9 29.0 29.2 29.7 30.0 30.0 30.1 30.3 30.5 30.7 31.0 SRW 9.3 8.4 8.4 8.7 9.3 9.6 9.5 9.5 9.7 9.9 10.2 10.4 White 5.4 5.4 5.4 5.5 5.5 5.5 5.5 5.5 5.5 5.6 5.6 5.6 Durum 2.6 2.7 3.6 3.9 4.0 3.8 3.7 3.7 3.8 3.8 3.8 3.9 All Wheat 62.5 60.8 61.0 62.0 63.4 63.9 63.8 63.8 64.2 64.7 65.3 65.7 United States - Wheat Yield (bushels/acre)
1993 1994 1995 1996 1997 1998 1999 2000 2001 2002 2003 2004 HRS 39.1 39.1 39.5 39.9 40.4 40.8 41.2 41.7 42.1 42.6 43.0 43.4 HRW 34.7 35.4 35.7 36.0 36.3 36.6 36.9 37.2 37.5 37.8 38.1 38.4 SRW 41.9 44.3 44.5 45.1 45.7 46.3 46.9 47.5 48.0 48.6 49.2 49.8 White 48.4 48.3 49.1 50.0 50.9 51.9 52.8 53.7 54.7 55.6 56.5 57.5 Durum 37.7 37.7 38.0 38.4 38.8 39.2 39.6 40.0 40.4 40.8 41.2 41.6 Average 38.2 38.8 39.2 39.6 40.1 40.5 40.9 41.4 41.8 42.3 42.7 43.1 United States - Wheat Production (million bushels)
1993 1994 1995 1996 1997 1998 1999 2000 2001 2002 2003 2004 HRS 614.3 603.9 577.5 585.7 597.5 611.5 618.8 623.9 629.8 636.1 642.7 649.2 HRW 1025.6 1023.3 1035.9 1053.1 1079.6 1097.1 1108.6 1120.0 1134.7 1152.3 1170.6 1188.8 SRW 390.2 372.1 373.8 393.5 426.3 442.5 446.7 452.0 464.6 482.7 500.9 517.2 White 262.2 259.4 265.8 273.6 281.9 287.0 291.3 296.3 302.4 308.7 314.8 320.6 Durum 97.1 102.0 136.3 149.9 154.1 149.8 147.9 149.4 152.0 155.0 157.7 160.3 2389.4 2360.6 2389.3 2455.9 2539.4 2587.8 2613.3 2641.7 2683.5 2734.8 2786.8 2836.0
All Wheat
United States - Wheat Cash Receipts (million US$) 1993 1994 1995 1996 1997 1998 1999 2000 2001 2002 2003 2004 HRS 1879.9 1942.0 1894.8 2004.8 2027.3 2053.4 2079.1 2120.3 2170.1 2213.3 2254.1 2294.6 HRW 3076.8 3238.6 3351.8 3538.4 3594.9 3620.4 3667.7 3750.9 3853.7 3953.4 4049.6 4146.6 SRW 1170.5 1184.5 1226.2 1340.9 1431.2 1461.1 1476.9 1515.5 1581.1 1656.0 1725.6 1788.0 White 881.1 912.8 966.1 1027.3 1042.0 1048.3 1066.8 1098.6 1134.1 1165.3 1192.4 1217.9 Durum 274.7 379.3 509.4 575.1 562.0 537.7 535.7 551.0 572.0 590.9 607.8 624.6 All Wheat 7283.1 7657.2 7948.4 8486.5 8657.3 8721.0 8826.2 9036.3 9310.9 9579.0 9829.4 10071.7 United States - Wheat Imports from Canada (million bushels)
1993 1994 1995 1996 1997 1998 1999 2000 2001 2002 2003 2004 CWRS 22.6 22.9 22.9 23.0 23.3 23.6 23.9 24.1 24.2 24.2 23.9 23.5 CWAD 5.5 6.2 5.1 6.6 6.8 6.5 6.3 6.1 6.1 6.1 6.2 6.3 All Wheat 28.1 29.0 28.0 29.6 30.1 30.1 30.2 30.2 30.3 30.3 30.1 29.7 United States - Wheat Consumption (million bushels)
1993 1994 1995 1996 1997 1998 1999 2000 2001 2002 2003 2004 HRS 237.9 247.5 243.9 243.3 246.3 252.6 258.1 262.5 265.9 269.0 272.3 275.9 HRW 578.4 587.1 595.5 597.8 600.8 606.2 614.3 622.3 628.5 633.6 638.5 643.5 5 SRW 240.7 233.3 229.0 239.3 253.6 259.0 258.7 259.3 263.5 270.4 277.8 284.1 White 82.8 81.1 86.7 88.7 88.3 88.6 90.7 93.7 96.4 98.8 101.2 104.0 Durum 40.6 43.7 46.9 53.4 55.7 56.2 56.8 57.5 58.4 59.2 59.9 60.7 All Wheat 1180.4 1192.6 1202.0 1222.5 1244.7 1262.7 1278.7 1295.4 1312.6 1331.0 1349.8 1368.3 United States - Wheat Ending Stocks (million bushels)
1993 1994 1995 1996 1997 1998 1999 2000 2001 2002 2003 2004 HRS 209.2 209.0 194.0 194.3 197.5 196.7 191.2 184.1 178.1 173.2 168.4 162.2 HRW 221.1 222.9 221.6 235.2 263.6 290.6 310.0 324.6 339.7 357.6 377.6 397.6 SRW 52.5 48.0 44.5 46.8 48.8 48.7 47.3 46.0 45.4 45.4 45.3 44.7 White 65.6 65.4 65.6 67.8 71.4 75.0 78.2 81.2 84.5 88.1 91.8 95.6 Durum 43.4 42.3 61.8 84.2 103.0 113.8 120.4 125.8 131.2 136.8 142.4 147.8
United States
-
Wheat Exports (million bushel)
1993 1994 1995 1996 1997 1998 1999 2000 2001 2002 2003 2004 HRS 338.2 356.6 348.6 342.2 347.9 359.7 366.2 368.5 369.9 372.0 375.1 379.5 HRW 430.0 434.4 441.7 441.6 450.4 463.8 474.8 483.2 491.1 500.7 512.1 525.3 SRW 140.0 143.3 148.4 151.9 170.7 183.6 189.4 194.1 201.7 212.3 223.2 233.7 White 177.9 178.5 178.8 182.7 190.0 194.8 197.4 199.6 202.7 206.4 209.8 212.8 Durum 62.1 59.5 69.9 74.1 79.7 82.7 84.5 86.4 88.2 90.2 92.2 94.1 All Wheat 1148.2 1172.3 1187.3 1192.5 1238.7 1284.5 1312.4 1331.7 1353.6 1381.7 1412.5 1445.4 United States - HRS Wheat Supply and Utilization (million bushels)1993 1994 1995 1996 1997 1998 1999 2000 2001 2002 2003 2004 Beginning Stocks 171.0 209.2 209.0 194.0 194.3 197.5 196.7 191.2 184.1 178.1 173.2 168.4 Production 614.3 603.9 577.5 585.7 597.5 611.5 618.8 623.9 629.8 636.1 642.7 649.2 Imports 22.6 22.9 22.9 23.0 23.3 23.6 23.9 24.1 24.2 24.2 23.9 23.5 Consumption 237.9 247.5 243.9 243.3 246.3 252.6 258.1 262.5 265.9 269.0 272.3 275.9 Exports 338.2 356.6 348.6 342.2 347.9 359.7 366.2 368.5 369.9 372.0 375.1 379.5 Ending Stocks 209.2 209.0 194.0 194.3 197.5 196.7 191.2 184.1 178.1 173.2 168.4 162.2 United States - HRW Wheat Supply and Utilization (million bushels)
1993 1994 1995 1996 1997 1998 1999 2000 2001 2002 2003 2004 o Beginning Stocks 204.0 221.1 222.9 221.6 235.2 263.6 290.6 310.0 324.6 339.7 357.6 377.6 Production 1025.6 1023.3 1035.9 1053.1 1079.6 1097.1 1108.6 1120.0 1134.7 1152.3 1170.6 1188.8 Consumption 578.4 587.1 595.5 597.8 600.8 606.2 614.3 622.3 628.5 633.6 638.5 643.5 Exports 430.0 434.4 441.7 441.6 450.4 463.8 474.8 483.2 491.1 500.7 512.1 525.3 Ending Stocks 221.1 222.9 221.6 235.2 263.6 290.6 310.0 324.6 339.7 357.6 377.6 397.6 United States - SRW Wheat Supply and Utilization (million bushels)
1993 1994 1995 1996 1997 1998 1999 2000 2001 2002 2003 2004 Beginning Stocks 43.0 52.5 48.0 44.5 46.8 48.8 48.7 47.3 46.0 45.4 45.4 45.3 Production 390.2 372.1 373.8 393.5 426.3 442.5 446.7 452.0 464.6 482.7 500.9 517.2 Consumption 240.7 233.3 229.0 239.3 253.6 259.0 258.7 259.3 263.5 270.4 277.8 284.1 Exports 140.0 143.3 148.4 151.9 170.7 183.6 189.4 194.1 201.7 212.3 223.2 233.7 Ending Stocks 52.5 48.0 44.5 46.8 48.8 48.7 47.3 46.0 45.4 45.4 45.3 44.7 United States - White Wheat Supply and Utilization (million bushels)
1993 1994 1995 1996 1997 1998 1999 2000 2001 2002 2003 2004 Beginning Stocks 64.0 65.6 65.4 65.6 67.8 71.4 75.0 78.2 81.2 84.5 88.1 91.8 Production 262.2 259.4 265.8 273.6 281.9 287.0 291.3 296.3 302.4 308.7 314.8 320.6 Consumption 82.8 81.1 86.7 88.7 88.3 88.6 90.7 93.7 96.4 98.8 101.2 104.0 Exports 177.9 178.5 178.8 182.7 190.0 194.8 197.4 199.6 202.7 206.4 209.8 212.8 Ending Stocks 65.6 65.4 65.6 67.8 71.4 75.0 78.2 81.2 84.5 88.1 91.8 95.6
United States - Durum Wheat Supply and Utilization (million bushels) 1993 1994 1995 1996 1997 1998 1999 2000 2001 2002 2003 2004 Beginning Stocks 49.0 43.4 42.3 61.8 84.2 103.0 113.8 120.4 125.8 131.2 136.8 142.4 Production 97.1 102.0 136.3 149.9 154.1 149.8 147.9 149.4 152.0 155.0 157.7 160.3 Imports 5.5 6.2 5.1 6.6 6.8 6.5 6.3 6.1 6.1 6.1 6.2 6.3 Consumption 40.6 43.7 46.9 53.4 55.7 56.2 56.8 57.5 58.4 59.2 59.9 60.7 Exports 62.1 59.5 69.9 74.1 79.7 82.7 84.5 86.4 88.2 90.2 92.2 94.1 Ending Stocks 43.4 42.3 61.8 84.2 103.0 113.8 120.4 125.8 131.2 136.8 142.4 147.8 United States - All Wheat Supply and Utilization (million bushels)
1993 1994 1995 1996 1997 1998 1999 2000 2001 2002 2003 2004 Beginning Stocks 531.0 591.8 587.6 587.5 628.4 684.3 724.9 747.2 761.7 779.0 801.1 825.5 Production 2389.4 2360.6 2389.3 2455.9 2539.4 2587.8 2613.3 2641.7 2683.5 2734.8 2786.8 2836.0 Imports 28.1 29.0 28.0 29.6 30.1 30.1 30.2 30.2 30.3 30.3 30.1 29.7 Consumption 1180.4 1192.6 1202.0 1222.5 1244.7 1262.7 1278.7 1295.4 1312.6 1331.0 1349.8 1368.3 Exports 1148.2 1172.3 1187.3 1192.5 1238.7 1284.5 1312.4 1331.7 1353.6 1381.7 1412.5 1445.4 Ending Stocks 591.8 587.6 587.5 628.4 684.3 724.9 747.2 761.7 779.0 801.1 825.5 847.9 United States - Wheat Farm Prices (US$/bushel)
1993 1994 1995 1996 1997 1998 1999 2000 2001 2002 2003 2004 HRS 3.1 3.2 3.3 3.4 3.4 3.4 3.4 3.4 3.4 3.5 3.5 3.5 S HRW 3.0 3.2 3.2 3.4 3.3 3.3 3.3 3.3 3.4 3.4 3.5 3.5 SRW 3.0 3.2 3.3 3.4 3.4 3.3 3.3 3.4 3.4 3.4 3.4 3.5 White 3.4 3.5 3.6 3.8 3.7 3.7 3.7 3.7 3.8 3.8 3.8 3.8 Durum 2.8 3.7 3.7 3..8 3.6 3.6 3.6 3.7 3.8 3.8 3.9 3.9 Weighted Average 3.0 3.2 3.3 3.5 3.4 3.4 3.4 3.4 3.5 3.5 3.5 3.6 United States - Wheat Market Prices (US$/bushel)
1993 1994 1995 1996 1997 1998 1999 2000 2001 2002 2003 2004 HRS 3.7 3.8 3.9 3.9 3.8 3.8 3.9 3.9 4.0 4.0 4.0 4.1 HRW 3.6 3.7 3.9 3.8 3.8 3.8 3.8 3.9 3.9 4.0 4.0 4.0 SRW 3.4 3.5 3.7 3.6 3.6 3.6 3.6 3.7 3.7 3.7 3.7 3.8 White 4.0 4.1 4.2 4.1 4.1 4.1 4.1 4.2 4.2 4.2 4.2 4.3 Durum 4.6 4.6 4.8 4.5 4.5 4.5 4.6 4.7 4.7 4.8 4.8 4.9
United States - Wheat Export Prices (US$/ton) 1993 1994 1995 1996 1997 1998 1999 2000 2001 2002 2003 2004 HRS 150.6 153.4 159.5 158.2 156.7 156.8 158.4 160.4 161.9 163.1 164.2 165.9 HRW 144.0 147.0 152.2 150.9 149.7 150.0 151.7 153.7 155.2 156.4 157.6 159.4 SRW 141.1 144.9 149.8 147.8 145.7 145.9 147.7 149.6 150.7 151.2 151.7 152.7 White 146.4 151.1 155.9 153.5 151.8 152.2 153.9 155.7 156.7 157.2 157.6 158.6 Durum 164.3 165.2 169.1 161.4 159.0 160.4 163.1 166.2 168.2 169.9 171.6 173.9 Weighted Average 147.1 150.2 155.6 153.7 152.0 152.3 154.1 156.1 157.4 158.4 159.4 160.8 tU,
U-1
Canada - Wheat Area Harvested (1000 hectares)
1993 1994 1995 1996 1997 1998 1999 2000 2001 2002 2003 2004 Western Red Spring 11697.0 11440.7 11509.7 11777.4 12023.8 12228.0 12378.4 12475.0 12503.2 12497.1 12473.9 12445.4 Western Amber Durum 1249.5 1298.4 1392.7 1445.2 1432.6 1395.6 1365.3 1349.4 1344.2 1341.6 1337.1 1329.6
All Wheat 12946.4 12739.0 12902.4 13222.6 13456.5 13623.6 13743.7 13824.4 13847.4 13838.7 13811.0 13775.0 Canada - Wheat Yields (metric tons/hectare)
1993 1994 1995 1996 1997 1998 1999 2000 2001 2002 2003 2004 Western Red Spring 2.3 2.3 2.3 2.4 2.4 2.4 2.4 2.5 2.5 2.5 2.5 2.5 Western Amber Durum 2.3 2.3 2.4 2.4 2.4 2.4 2.5 2.5 2.5 2.6 2.6 2.6
2.4 2.4 2.4 2.5 2.5 2.5 2.5
Canada - Western Red Spring Wheat Supply and Utilization (1000 metric tons)
1993 1994 1995 1996 1997 1998 1999 2000 2001 Beginning Stocks 10134.0 9613.6 9025.8 8671.6 8805.2 8974.2 9149.5 9318.9 9513.7 Production 26661.5 26556.0 27013.0 27905.3 28750.3 29502.1 30131.4 30635.1 30973.4 Food Use 1949.3 1975.0 1980.7 1997.8 2008.0 2029.4 2064.5 2107.7 2144.7 Feed Use 2433.4 2306.2 2257.4 2402.3 2445.2 2486.0 2535.2 2611.5 2667.3 Seed Use 1112.7 1125.3 1154.1 1181.2 1204.9 1224.1 1238.9 1248.1 1254.5 ON Exports 21686.5 21737.3 21975.0 22190.4 22923.3 23587.2 24123.4 24473.0 24776.0 Ending Stocks 9613.6 9025.8 8671.6 8805.2 8974.2 9149.5 9318.9 9513.7 9644.6 2002 2003 2004 9644.6 9739.9 9809.9 31227.1 31437.5 31633.6 2183.5 2224.1 2265.9 2726.0 2783.2 2829.5 1259.5 1264.1 1269.8 24962.7 25096.2 25234.3 9739.9 9809.9 9843.9 Canada - Western Amber Durum Wheat Supply and Utilization (1000 metric tons)
1993 1994 1995 1996 1997 1998 1999 2000 2001 Beginning Stocks 2051.0 1607.1 1410.8 1372.5 1441.4 1473.7 1465.8 1445.9 1437.4 Production 2826.3 3008.5 3279.3 3448.9 3461.9 3413.6 3379.4 3379.6 3405.9 Food Use 189.9 199.3 205.7 215.7 223.6 233.5 246.3 260.9 274.4 Feed Use 515.5 509.7 515.9 552.2 572.6 592.8 614.2 639.9 662.3 Seed Use 144.2 154.1 160.2 160.0 157.6 155.9 155.4 156.0 156.9 Exports 2420.5 2341.6 2435.8 2452.1 2475.8 2439.2 2383.4 2331.2 2311.0 Ending Stocks 1607.1 1410.8 1372.5 1441.4 1473.7 1465.8 1445.9 1437.4 1438.6 2002 1438.6 3438.6 288.5 685.3 157.5 2298.4 1447.6 2003 1447.6 3466.1 303.0 707.9 157.9 2286.3 1458.7 2004 1458.7 3485.5 317.9 728.9 158.0 2272.8 1466.6 Canada - All Wheat Supply and Utilization (1000 metric tons)
1993 1994 1995 1996 1997 1998 Beginning Stocks 12185.0 11220.7 10436.6 10044.2 10246.6 10447.8 Production 29487.8 29564.5 30292.3 31354.2 32212.2 32915.6 Food Use 2139.3 2174.4 2186.4 2213.5 2231.6 2263.0 Feed Use 2949.0 2815.9 2773.3 2954.5 3017.8 3078.8 Seed Use 1256.9 1279.4 1314.3 1341.3 1362.5 1380.0 1999 2000 2001 2002 2003 10615.3 10764.8 10951.0 11083.2 11187.6 33510.9 34014.6 34379.3 34665.8 34903.6 2310.9 2368.6 2419.2 2472.0 2527.0 3149.4 3251.4 3329.6 3411.3 3491.2 1394.4 1404.2 1411.4 1417.0 1422.0
Average
2.3 2.3 2.3 2.4 2.5 2004 11268.6 35119.1 2583.8 3558.5 1427.7Canada
-
Western Red Spring Wheat Prices (Canadian $/metric ton)
1993 1994 1995 1996 1997 1998 1999 2000 2001 2002 2003 2004 Initial Payment 100.7 101.5 106.1 111.1 112.8 114.1 115.2 115.9 115.9 116.0 116.0 116.0 Domestic Price 172.4 179.8 189.0 190.7 192.4 193.9 195.0 194.4 194.3 194.2 194.3 195.1 Export Price 225.8 244.3 254.8 249.3 251.0 252.2 252.7 250.7 250.9 251.0 251.2 252.6 Canada - Western Amber Durum Wheat Prices (Canadian $/metric ton)
1993 1994 1995 1996 1997 1998 1999 2000 2001 2002 2003 2004 Initial Payment 105.3 105.7 107.3 109.2 109.1 109.1 109.4 109.9 110.1 110.3 110.5 110.6 Domestic Price 217.3 237.0 248.6 237.3 237.1 240.1 242.7 242.8 243.7 244.2 244.7 245.8 Export Price 255.5 272.1 282.4 267.2 268.8 272.5 275.0 274.7 275.7 276.2 276.7 277.9 Canada - All Wheat Prices (Canadian $/metric ton)
1993 1994 1995 1996 1997 1998 1999 2000 2001 2002 2003 2004 Off-board Wheat Price 99.1 107.9 113.1 109.1 109.9 110.8 111.3 110.6 110.8 110.9 111.0 111.7 Initial Payment 101.1 101.9 106.2 110.9 112.4 113.6 114.6 115.3 115.3 115.4 115.4 115.5 Domestic Price 176.4 185.0 194.6 195.2 196.9 198.7 200.1 199.8 199.9 200.1 200.4 201.3 Export Price 228.8 247.0 257.5 251.1 252.7 254.1 254.7 252.8 253.1 253.1 253.3 254.7
European Union - Wheat Area Harvested (1000 hectares)
1993 1994 1995 1996 1997 1998 1999 2000 2001 2002 2003 2004 Common 13539.7 13383.7 13385.8 13380.2 13362.7 13361.3 13364.2 13365.1 13364.3 13363.4 13363.4 13363.1 Durum 3313.7 3150.5 3179.3 3182.6 3174.1 3173.3 3172.8 3171.8 3170.4 3169.0 3167.7 3166.4
All Wheat
16853.5 16534.2 16565.1 16562.7 16536.8 16534.6 16537.0 16536.9 16534.7 16532.4 16531.1 16529.5 European Union - Wheat Yields (metric tons/hectare)1993 1994 1995 1996 1997 1998 1999 2000 2001 2002 2003 2004
Common 5.8 5.9 6.0 6.1 6.2 6.3 6.4 6.4 6.5 6.6 6.7 6.8 Durum 3.0 3.1 3.1 3.2 3.2 3.3 3.3 3.4 3.5 3.5 3.6 3.6 5.2 5.4 5.4 5.5 5.6 5.7 5.8 5.9 5.9 6.0 6.1 6.2
European Union
-
Wheat Production (1000 metric tons)
1993 1994 1995 1996 1997 1998 1999 2000 2001 2002 2003 2004 Common 77951.5 78933.0 80374.8 81589.4 82657.9 83795.3 84947.8 86084.1 87207.3 88328.6 89455.9 90581.1 Durum 9910.6 9623.6 9892.4 10082.5 10235.0 10411.8 10589.6 10765.4 10939.9 11114.2 11288.6 11462.8
All Wheat
87862.2 88556.6 90267.2 91671.9 92892.9 94207.0 95537.4 96849.6 98147.2 99442.8 100744.5 102043.9 European Union - Wheat Consumption (1000 metric tons)1993 1994 1995 1996 1997 1998 1999 U.S. Hard Red Spring Whea
U.S. Hard Red Winter Whea U.S. Soft Red Winter Whea U.S. White Wheat
U.S. Durum Wheat
Canada Western Red Spring Canada Western Amber Duru E.U. Common Wheat
E.U. Durum Wheat Australian Wheat Argentine Wheat 350.3 3.3 17.3 1.2 44.9 552.1 55.6 32131.9 8457.5 2.5 2.9 378.4 3.6 19.7 1.3 45.6 582.1 59.9 32114.2 8717.6 2.7 3.2 523.0 5.0 38.0 2.5 118.9 785.9 237.2 32152.8 8330.2 5.0 4.6 525.0 5.1 38.0 2.5 110.8 756.2 207.1 32604.7 8599.1 4.9 4.9 535.2 5.2 39.2 2.6 109.0 748.1 189.5 33002.5 8783.6 5.0 5.3 543.5 5.3 39.6 2.6 109.4 751.2 185.3 33432.6 8914.8 5.0 5.4 548.6 5.3 39.7 2.6 109.2 754.7 181.8 33818.2 9036.7 5.0 5.5 2000 2001 2002 2003 2004 553.3 558.8 565.3 572.2 580.5 5.4 5.4 5.5 5.6 5.6 39.8 40.2 40.8 41.4 42.1 2.6 2.6 2.7 2.7 2.8 108.5 107.8 107.3 106.8 106.3 755.7 754.2 752.1 748.4 740.9 176.3 170.7 166.0 161.4 156.6 34199.5 34602.9 34990.6 35384.7 35791.2 9165.2 9299.6 9429.9 9559.0 9690.0 5.0 5.0 5.1 5.3 5.4 5.6 5.8 6.0 6.2 6.4
Average
00European Union - Common Wheat Supply and Utilization (1000 metric tons) 1993 1994 1995 1996 1997 1998 1999 2000 2001 2002 2003 2004 Beginning Stocks 20920.0 17584.0 17997.8 19029.0 18762.7 18548.0 18542.2 18614.1 18660.2 18640.1 18657.8 18675.5 Production 77951.5 78933.0 80374.8 81589.4 82657.9 83795.3 84947.8 86084.1 87207.3 88328.6 89455.9 90581.1 Imports 929.6 991.0 1364.0 1336.7 1340.5 1352.6 1361.4 1367.3 1372.1 1377.5 1381.8 1383.6 Food Use 33061.5 33105.2 33516.8 33941.4 34343.1 34785.2 35179.6 35566.9 35975.0 36368.1 36766.5 37174.9 Feed Use 25351.5 25695.7 26384.0 27128.9 27754.8 28385.4 29035.1 29692.0 30346.6 30995.0 31647.0 32298.9 Exports 23804.2 20709.3 20806.8 22122.1 22115.3 21983.0 22022.5 22146.4 22278.0 22325.2 22406.4 22510.4 Ending Stocks 17584.0 17997.8 19029.0 18762.7 18548.0 18542.2 18614.1 18660.2 18640.1 18657.8 18675.5 18656.1 European Union - Durum Wheat Supply and Utilization (1000 metric tons)
1993 1994 1995 1996 1997 1998 1999 2000 2001 2002 2003 2004 Beginning Stocks 3685.0 3830.1 3356.3 3777.4 3909.1 3941.2 4001.8 4087.7 4177.4 4261.5 4346.8 4434.1 Production 9910.6 9623.6 9892.4 10082.5 10235.0 10411.8 10589.6 10765.4 10939.9 11114.2 11288.6 11462.8 Imports 100.5 105.5 356.1 317.9 298.5 294.7 291.0 284.8 278.5 273.3 268.2 262.9 Food Use 8558.0 8823.1 8686.3 8917.0 9082.1 9209.6 9327.7 9450.0 9578.0 9703.2 9827.2 9953.0 Exports 1308.1 1379.8 1141.1 1351.7 1419.3 1436.3 1467.1 1510.6 1556.2 1599.0 1642.4 1686.9 Ending Stocks 3830.1 3356.3 3777.4 3909.1 3941.2 4001.8 4087.7 4177.4 4261.5 4346.8 4434.1 4520.0 European Union - All Wheat Supply and Utilization (1000 metric tons)
1993 1994 •o Beginning Stocks 24605.0 21414.1 Production 87862.2 88556.6 Imports 1030.1 1096.5 Food Use 41619.4 41928.3 Feed Use 25351.5 25695.7 Exports 25112.2 22089.1 Ending Stocks 21414.1 21354.1 1995 1996 1997 1998 1999 2000 2001 2002 2003 2004 21354.1 22806.4 22671.9 22489.2 22544.1 22701.8 22837.6 22901.6 23004.6 23109.6 90267.2 91671.9 92892.9 94207.0 95537.4 96849.6 98147.2 99442.8 100744.5 102043.9 1720.1 1654.6 1639.0 1647.3 1652.4 1652.1 1650.6 1650.8 1650.0 1646.6 42203.1 42858'.3 43425.2 43994.8 44507.3 45016.9 45553.0 46071.3 46593.7 47127.8 26384.0 27128.9 27754.8 28385.4 29035.1 29692.0 30346.6 30995.0 31647.0 32298.9 21947.9 23473.8 23534.7 23419.3 23489.6 23657.0 23834.2 23924.1 24048.8 24197.3 22806.4 22671.9 22489.2 22544.1 22701.8 22837.6 22901.6 23004.6 23109.6 23176.1 European Union - Wheat Farm Prices (ECU/metric ton)
1993 1994 1995 1996 1997 1998 1999 2000 2001 2002 2003 2004 Common 158.7 160.7 160.5 159.9 160.0 160.1 160.1 160.1 160.1 160.1 160.1 160.1 Durum 229.8 228.8 232.1 229.2 228.2 228.0 227.6 227.0 226.4 225.8 225.2 224.6 Weighted Average 166.7 168.1 168.3 167.5 167.5 167.6 167.6 167.5 167.5 167.4 167..4 167.3
European Union - Wheat Export Prices (ECU/metric ton)
1993 1994 1995 1996 1997 1998 1999 2000 2001 2002 2003 2004 Common Wheat 88.5 91.8 87.0 91.8 96.4 98.1 99.0 99.9 101.5 102.9 104.2 105.9 Durum Wheat 173.9 171.8 168.9 171.1 178.2 181.7 183.1 184.6 187.1 189.5 191.9 194.9
93.0
96.8
91.2
96.3
101.3
103.2
104.2
105.3
107.0
108.6
110.2
112.1
Average
European Union - Wheat Variable Levies (ECU/metric ton) 1993 1994 1995 1996 1997 1998 1999 2000 2001 2002 2003 2004 Common Wheat 150.6 149.9 135.8 128.4 122.6 121.0 120.2 119.1 117.0 115.1 113.1 110.7 Durum Wheat 161.6 162.4 148.9 145.9 141.0 138.6 137.1 135.2 132.8 130.5 128.2 125.5 Average 151.2 150.6 136.5 129.4 123.8 122.1 121.3 120.1 118.0 116.1 114.2 111.8 O
Australia
-
Wheat Area Harvested (1000 hectares)
1993 1994 1995 1996 1997 1998 1999 2000 2001 2002 2003 2004 Area Harvested 9894.9 9555.6 9946.7 9921.9 9843.1 9645.4 9580.4 9714.5 9985.9 10307.1 10612.1 10879.0 Australia - Wheat Yield (metric tons/hectare)
1993 1994 1995 1996 1997 1998 1999 2000 2001 2002 2003 2004
Yield 1.6 1.7 1.7 1.7 1.7 1.7 1.7 1.7 1.8 1.8 1.8 1.8
Australia - Wheat Supply and Utilization (1000 metric tons)
1993 1994 1995 1996 1997 1998 1999 2000 2001 2002 2003 2004 Beginning Stocks 4000.0 4517.3 4888.9 5364.9 5734.0 5851.4 5664.4 5431.3 5360.9 5505.6 5805.1 6164.5 Production 16010.8 16026.7 16697.1 16820.4 16811.2 16605.3 16621.8 16985.4 17594.4 18299.0 18983.3 19607.2 Food Use 2120.8 2018.7 1983.3 1960.1 1933.2 1890.0 1843.6 1789.9 1723.9 1652.1 1575.1 1492.6 Feed Use 1732.5 1725.9 1717.6 1709.5 1699.9 1687.6 1672.9 1656.5 1638.8 1620.3 1601.2 1581.3 Exports 11640.1 11910.4 12520.3 12781.7 13060.8 13214.6 13338.4 13609.4 14087.0 14727.0 15447.6 16193.4 Ending Stocks 4517.3 4888.9 5364.9 5734.0 5851.4 5664.4 5431.3 5360.9 5505.6 5805.1 6164.5 6504.5 Australia - Wheat Prices (Australian $/metric ton)
1993 1994 1995 1996 1997 1998 1999 2000 2001 2002 2003 2004 Initial Payment 123.8 154.4 148.9 150.3 146.5 148.3 154.0 160.7 167.0 172.6 177.8 183.0 Domestic Price 151.2 146.3 142.8 139.0 136.4 135.7 136.8 139.3 142.6 146.6 151.0 156.0 Export Price 204.3 195.7 197.8 191.7 194.7 203.7 214.2 224.2 233.0 241.3 249.5 258.8
Argentina - Wheat Area Planted and Harvested (1000 ha)
1993 1994 1995 1996 1997 1998 1999 2000 2001 2002 2003 2004 Area Planted 4919.5 4868.7 4892.5 4992.3 4980.0 4926.0 4892.8 4893.3 4910.0 4919.3 4919.6 4915.6 Area Harvested 4603.2 4554.6 4577.4 4673.0 4661.2 4609.5 4577.7 4578.1 4594.2 4603.1 4603.4 4599.6 Argentina - Wheat Yield (metric tons/ha)
1993 1994 1995 1996 1997 1998 1999 2000 2001 2002 2003 2004 Yield 2.2 2.2 2.2 2.2 2.3 2.3 2.3 2.3 2.4 2.4 2.4 2.4 Argentina - Wheat Supply and Utilization (1000 metric tons)
1993 1994 1995 1996 1997 1998 1999 2000 2001 2002 2003 2004 Beginning Stocks 45.0 288.9 334.7 349.4 397.3 426.2 434.4 438.7 449.9 469.1 489.3 507.6 Production 10050.4 9971.1 10121.9 10449.4 10541.0 10541.3 10585.0 10702.3 10856.6 10994.8 11112.4 11220.2 Consumption 3994.7 3934.7 3873.6 3803.5 3735.1 3662.3 3574.8 3488.5 3396.7 3299.1 3195.5 3085.7 Exports 5811.8 5990.6 6233.5 6598.0 6777.1 6870.8 7006.0 7202.6 7440.8 7675.5 7898.7 8119.5 Ending Stocks 288.9 334.7 349.4 397.3 426.2 434.4 438.7 449.9 469.1 489.3 507.6 522.7 Argentina - Wheat Domestic and Export Prices (Pesos/ metric ton)
1993 1994 1995 1996 1997 1998 1999 2000 2001 2002 2003 2004
---
-- ---
-- ---
--- ---.--
---
__
----
_
_
_
---
_
_
«
_
--
_
-_--
-- _
_
_
_
_
_
-_
_
_
«
Domestic Price 6.3 6.6 7.1 6.3 6.6 7.7 8.4 9.3 9.9 10.4 10.8 11.3 Export Price 113.9 115.8 118.8 116.6 119.7 128.3 137.1 147.0 157.1 167.5 178.7 191.3
Algeria - Wheat Imports (1000 metric tons)
1993 1994 1995 1996 1997 1998 1999 2000 2001 2002 2003 2004 U.S. Hard Red Spring Whea 204.8 239.0 240.1 217.9 241.6 278.6 308.9 334.9 356.6 378.7 401.0 423.2 U.S. Hard Red Winter Whea 397.3 438.8 458.2 411.8 448.9 502.0 550.6 597.7 635.7 673.0 709.0 743.3 U.S. Soft Red Winter Whea 116.8 133.1 129.4 102.3 143.4 177.2 195.9 214.1 236.2 266.1 296.7 326.0 U.S. White Wheat 38.9 41.8 43.5 38.6 47.4 55.6 62.3 70.1 78.3 87.7 97.4 107.2 U.S. Durum Wheat 612.5 500.1 556.5 624.4 727.7 773.6 798.5 830.9 858.0 886.9 914.7 940.9 Canada Western Red Spring 0.4 0.5 0.5 0.5 0.5 0.6 0.6 0.6 0.7 0.7 0.7 0.7 Canada Western Amber Duru 410.1 264.0 114.8 29.9 42.4 23.9 0.0 0.0 0.0 0.0 0.0 0.0 E.U. Common Wheat 1428.0 1421.9 1553.6 1653.4 1725.8 1819.1 1932.3 2065.0 2193.5 2319.1 2451.9 2588.1
E.U. Durum Wheat 0.0 0.0 0.0 0.0 0.0 0.0 0.0 0.0 0.0 0.0 0.0 0.0 Australian Wheat 0.0 0.0 0.0 0.0 0.0 0.0 0.0 0.0 0.0 0.0 0.0 0.0 Argentine Wheat 0.0 0.0 0.0 0.0 0.0 0.0 0.0 0.0 0.0 0.0 0.0 0.0 All Wheat 3208.8 3039.4 3096.7 3078.8 3377.8 3630.6 3849.0 4113.4 4358.9 4612.3 4871.4 5129.3 Brazil - Wheat Imports (1000 metric tons)
1993 1994 1995 1996 1997 1998 1999 2000 2001 2002 2003 2004 U.S. Hard Red Spring Whea 119.9 115.6 99.9 86.8 77.8 71.1 59.8 44.4 26.8 8.5 0.0 0.0 U.S. Hard Red Winter Whea 164.0 153.0 136.8 118.8 103.7 89.8 71.0 47.3 20.6 0.0 0.0 0.0 U.S. Soft Red Winter Whea 1.6 1.7 1.6 1.4 1.5 1.5 1.3 1.1 0.9 0.8 0.7 0.5 U.S. White Wheat 0.0 0.0 0.0 0.0 0.0 0.0 0.0 0.0 0.0 0.0 0.0 0.0 U.S. Durum Wheat 0.0 0.0 0.0 0.0 0.0 0.0 0.0 0.0 0.0 0.0 0.0 0.0 Canada Western Red Spring 1264.5 1193.8 1072.4 960.2 887.5 808.7 695.7 544.1 369.0 170.8 0.0 0.0
o
Canada Western Amber Duru 0.8 0.9 0.9 1.0 1.1 1.1 1.1 1.0 1.0 1.0 1.0 1.0o
E.U. Common Wheat 27.0 22.5 21.5 21.6 20.1 18.2 16.2 14.0 11.7 9.3 6.6 3.8E.U. Durum Wheat 0.0 0.0 0.0 0.0 0.0 0.0 0.0 0.0 0.0 0.0 0.0 0.0
Australian Wheat 0.0 0.0 0.0 0.0 0.0 0.0 0.0 0.0 0.0 0.0 0.0 0.0 Argentine Wheat 3193.2 3176.0 3197.5 3269.1 3241.5 3171.6 3100.9 3035.1 2974.1 2900.8 2808.9 2701.0
All Wheat 4771.0 4663.4 4530.5 4458.9 4333.2 4162.0 3945.9 3687.1 3404.1 3091.1 2817.2 2706.3
China - Wheat Imports (1000 metric tons)
1993 1994 1995 1996 1997 1998 1999 2000 2001 2002 2003 2004 U.S. Hard Red Spring Whea 273.4 257.7 286.2 314.6 346.8 383.8 416.5 449.2 483.4 520.9 561.7 606.5 U.S. Hard Red Winter Whea 1696.6 1494.8 1795.2 1998.5 2191.0 2398.1 2598.6 2809.7 3033.1 3277.6 3541.7 3831.1 U.S. Soft Red Winter Whea 1141.8 985.6 1203.8 1387.3 1633.7 1825.7 1971.9 2123.8 2302.5 2507.1 2721.1 2942.7
U.S. White Wheat 0.0 0.0 0.0 0.0 0.0 0.0 0.0 0.0 0.0 0.0 0.0 0.0 U.S. Durum Wheat 0.0 0.0 0.0 0.0 0.0 0.0 0.0 0.0 0.0 0.0 0.0 0.0 Canada Western Red Spring 4497.6 4252.0 4702.0 5107.0 5568.6 6006.7 6425.7 6845.8 7286.7 7739.4 8211.2 8694.8 Canada Western Amber Duru 0.0 0.0 0.0 0.0 0.0 0.0 0.0 0.0 0.0 0.0 0.0 0.0 E.U. Common Wheat 1545.0 1187.9 1346.3 1568.3 1642.0 1712.8 1808.7 1925.7 2050.2 2178.2 2319.3 2474.7 E.U. Durum Wheat 0.0 0.0 0.0 0.0 0.0 0.0 0.0 0.0 0.0 0.0 0.0 0.0 Australian Wheat 856.6 834.3 968.6 1047.7 1109.3 1163.5 1223.2 1302.3 1398.3 1507.2 1624.0 1746.2 Argentine Wheat 145.8 142.5 184.0 220.0 244.7 266.4 290.7 318.2 347.3 376.7 406.5 437.5
10156.7 9154.7 10486.2 11643.3 12736.1 13756.9 14735.3 15774.6 16901.3 18107.2 19385.6 20733.5
M 0 00 CA O C 0 M rCM '• -r--t -Io o ooo o N .N.C . ) .. .vN.... No Dn D-Ioo o% or- o ( I, ,-N N C 0 a- n r -IO I I r M00DA 0 N 0 0 C0 I w H " m o0 I Ln w a Ioo ac
PO cOc oooO inor.orQO
IN 0d v w w N 0M I % -I •L ' r •- LA O I--h I 10-C'Y AND- r0CD 00 D o0 L o
m or-W a \o oooor- m W1 IOVOD q O 1 I H m0 I 1o) NOD MA 0 C'-0 *000 o . ... S ) O 1 D1 C i o C C1 C C LA 0 0) 1 .r o(n .C0 .H0 .O O OC . . O . .0 o.LA . . 0I I . or0 ' o o 1 CD I I w W 0 m OD Hr4 SIo n moo... 1 Hh I oI O .A C L0 O0 t in Cl o 0 N 0000 cO rn I H S0) C ... r I •r-I 0 V CD0 0 0 10 0 rl 4m I H m Ln C") mCD CN CD H wH I I L Cl ID O o 10 0 H 0 o ý ) i i H . iV O CD 0 irA I c ' 1 r0l LA 010 00 N 0 Io n ...4 O H I 10 C)H C' 0 H 0 O A 010 I I1 .LtAOC OOC N NO -I I 0H 10) I H moLA CD o0 000 o r 0 1:1H0'10010' 10 C 0 0 I o 0 rC o N 1.0 0' rHI 01 1, I 0) I. . . . . . I m IH I Pc 0 I . . . . . . a • .. . . 01 I H 10)0 )0 ) C0 CII 'T0 C 0E 44 l S I
1 0 1S O
0 ) (dH 4 'O CI)4)aI010UQ10.d1 iii I e 'o id oe ffifi..1010Qc..Q *P 150 'O M OD co CA 0 (V) C, 0' Ln Ln v LA 0 Ln 10' 01 in C1 co co OD in O0 CO OD 0' ONv0-a;
o( en0« a^ r -r'-oor in oo o in S . ... a . o iLnHr- o o Nr- m o0oc)%o 0% OD1 oW > 0 oH iLn I o 0( m 'n 0 H r- H r- H O N1 i00 o D0o oo - oo 0-Oi .OOC-'O C)OCO OrH O OI rC - N C) in Lo rH O) 1 r-W o OD o C w I - oOCrN chO O oo o . . 01 00 rJ • 0 0 a O N 1 O COD vO OO -O
a*,
0% r-4 rm r- OD r- 0 C) N O i0 -. o oo n or On S -i r- H Lin I' 0) C Ol • or m - O p a 0 01 ... S t - o »« P- o o ro o a) ... I I vD C; O1 am t n )N OO LA S r-O C i , 1 O) r-I r- r-I r-i LAEO 0CC00 HH0H0 NrC- 0 CW0 )O
0 . ... . . .
H r-I o rH H or-io L
rHI rlOU) r- o0.• . 0
r-0 00 D C) 0) H l rl r-I in .iC rI v O ,o• ,V r- o o o 0o -IH i o LA0r0)U 0)ICo o i ) I C. . . , . .t; C . n* C; . I 0) I1 .o NOC D oLA0)0 O 0 HIC r-l 1 0' i0n 0 1 0 rH r-l H- r-l I r-" 1 C0 0 v, H 0 0 .r-I r r-( H H L
0)IC-')LA oH oorfloO oHO 0 o
IrI a NlO LA O0 0 0 I CH CD o H Cl 0O I I H H H 1.0 CU t I . . . . I HH Hc H L l(i '00 ) ) 0)) en rI H r.H44 r'. l i I: 0 ): c O 10 d)U1I]E 44 41 I2 '' - 4J 4 0 E (C ( 14 (T 4 44-lH -r i e4 k -ri r, (d 1 0 0 . 0I 0 ,-d 4-,. (1
.0e~ I I 0()C)0U WEQ U•• O04
4•
0
ri) r I - - d - -'d' 1 1.M 4 -4 Hi IL UI ) fl )l nlV,30VC 0 CaI) H H 10 I. . .1010.
U U
W 4
.14 H r-I HI r-1o 1 MMno o nooooO in o . . . . . . . . o 0 0 o(N 0 o o ooo1 V m 0 r- O r, 0o1 O 00
0 in r- N 0N in ve r - 01 r-l SI in... C O N 00 C 0 i' 0 O O 1.0 C O C ) 64 m U )oO% m OD on oM in r- r-l r-l I O 1. I 00. r \.. SI ' in O o O •O o O oI otV O min kO ol in -Iin r vl r r-O I ~O H N rH 0 O 0I v I r- iH n in O in U) 0 en O I01 oC Ir H. *- . inC. H r-l iLIOD 1 00I 4 N OOD C r O O O Al
nI . . . . . . . . .. .
InIrOAoOHOHOHO 10
r- r- in
m oi w omaoooin ooo in
In in O Ooo Oin oro o o t
rl I N 10 r0 0) 00 1 In oco w^ qw
O
r0 r-l rl in 'n . . .. ... . rl ILA o C N O H M 00 r-n o on (Y) 0 oo S r- H L S . . . . . . . . . . . IH I O\ O U l 0 (D C• , I r m W % N LnA H m 0o Ln mLA I m N rI H CA H H v r0 ) . . . . . . . . . 04 I UU H I 0 I. . . . . . . E' ' 0'^ 10 ' C 0) H 0 r0l I(U U ) C 0 10010 C) I -l 4)4) 4 .4c ft I ) ' (U C EI M I I C H(4 (4 ( (1 04444 0) Id ' ad 4 44 4400) ) 44 I d1 . 10 oe. 10 I' <0 10 .0 3 O ^H-d 0) 10 ' * * * * (I ('d'd .4- (U i I 0D C 0 C l t) H 1 0l I. . . .* * 0 0 .i - H -^ &~Ur01v Mt 10Mexico
-
Wheat Imports (1000 metric tons)
1993
1994
1995
1996
1997
U.S. Hard Red Spring Whea U.S. Hard Red Winter Whea U.S. Soft Red Winter Whea U.S. White Wheat
U.S. Durum Wheat
Canada Western Red Spring
Canada Western Amber Duru
E.U. Common Wheat
E.U. Durum Wheat
Australian Wheat
Argentine Wheat
All Wheat190.7
370.9
9.6
42.5
13.7
648.1
0.0
46.4
0.0
0.0
19.6
198.3
379.9
10.0
42.9
20.7
663.1
0.0
42.9
0.0
0.0
20.7
174.5
337.3
8.7
38.4
27.8
610.3
0.0
40.5
0.0
0.0
20.4
186.8
364.4
9.5
42.5
35.1
648.6
0.0
45.0
0.0
0.0
23.3
196.0
379.5
10.4
45.3
42.5
679.9
0.0
45.9
0.0
0.0
25.0
1998
1999
2000
2001
2002
2003
2004
207.9
218.6
229.3
240.3
252.3
265.3
279.4
397.9
417.0
437.3
458.5
481.7
506.4
533.3
11.1
11.6
12.1
12.7
13.5
14.3
15.2
47.6
49.9
52.6
55.6
59.0
62.5
66.1
50.1
57.8
65.7
73.7
81.9
90.3
98.8
709.8
739.8
769.2
799.3
828.6
857.2
883.6
0.0
0.0
0.0
0.0
0.0
0.0
0.0
46.6
48.0
49.7
51.7
53.7
55.9
58.3
0.0
0.0
0.0
0.0
0.0
0.0
0.0
0.0
0.0
0.0
0.0
0.0
0.0
0.0
26.5
28.3
30.4
32.7
34.9
37.2
39.6
1341.5
1378.5
1257.9
1355.4
1424.5
1497.6
1570.9
1646.4
1724.5
1805.7
1889.2
1974.2
Morocco - Wheat Imports (1000 metric tons)
U.S. Hard Red Spri]
U.S. Hard Red Winte
U.S. Soft Red Winti
U.S. White Wheat
U.S. Durum Wheat
Canada Western Red
S
Canada Western Ambe
E.U. Common Wheat
E.U. Durum Wheat
Australian Wheat
Argentine Wheat
All Wheat
1993
1994
1995
1996
1997
1998
1999
2000
ng Whea
418.7
444.4
431.3
416.4
412.1
410.2
403.1
385.7
er Whea
395.4
414.4
411.6
398.0
391.2
384.7
375.3
357.1
er Whea
396.4
437.3
434.5
418.0
428.8
430.9
421.0
401.0
0.0
0.0
0.0
0.0
0.0
0.0
0.0
0.0
427.2
443.3
469.7
484.0
499.3
514.3
528.7
541.9
Spring
80.9
84.0
82.1
79.9
79.4
78.4
76.8
73.3
er Duru
127.6
132.5
139.2
142.9
147.0
151.2
155.4
159.1
1524.5
1440.4
1429.0
1440.1
1405.9
1364.7
1325.2
1266.4
385.2
405.6
408.5
431.0
448.3
463.6
480.0
496.5
0.0
0.0
0.0
0.0
0.0
0.0
0.0
0.0
0.0
0.0
0.0
0.0
0.0
0.0
0.0
0.0
3755.9
3802.0
3805.9
3810.3
3812.0
3798.2
3765.4
3680.8
3603.4
3506.1
3385.0
3235.8
Former Soviet Union - Wheat Imports (1000 metric tons)