Air Force Institute of Technology
AFIT Scholar
Theses and Dissertations Student Graduate Works
3-22-2019
A Blockchain-Based Anomalous Detection System
for Internet of Things Devices
Joshua K. Mosby
Follow this and additional works at:https://scholar.afit.edu/etd
Part of theDigital Communications and Networking Commons, and theInformation Security Commons
This Thesis is brought to you for free and open access by the Student Graduate Works at AFIT Scholar. It has been accepted for inclusion in Theses and Dissertations by an authorized administrator of AFIT Scholar. For more information, please [email protected].
Recommended Citation
Mosby, Joshua K., "A Blockchain-Based Anomalous Detection System for Internet of Things Devices" (2019).Theses and Dissertations. 2275.
A BLOCKCHAIN-BASED ANOMALOUS DETECTION SYSTEM FOR INTERNET OF THINGS DEVICES
THESIS
Joshua K. Mosby, Captain, USAF AFIT-ENG-MS-19-M-047
DEPARTMENT OF THE AIR FORCE AIR UNIVERSITY
AIR FORCE INSTITUTE OF TECHNOLOGY
Wright-Patterson Air Force Base, OhioDISTRIBUTION STATEMENT A.
The views expressed in this thesis are those of the author and do not reflect the official policy or position of the United States Air Force, Department of Defense, or the United States Government. This material is declared a work of the U.S. Government and is not subject to copyright protection in the United States.
AFIT-ENG-MS-19-M-047
A BLOCKCHAIN-BASED ANOMALOUS DETECTION SYSTEM FOR INTERNET OF THINGS DEVICES
THESIS
Presented to the Faculty
Department of Electrical and Computer Engineering Graduate School of Engineering and Management
Air Force Institute of Technology Air University
Air Education and Training Command In Partial Fulfillment of the Requirements for the Degree of Master of Science in Cyber Operations
Joshua K. Mosby, BS Captain, USAF
March 2019
DISTRIBUTION STATEMENT A.
AFIT-ENG-MS-19-M-047
A BLOCKCHAIN-BASED ANOMALOUS DETECTION SYSTEM FOR INTERNET OF THINGS DEVICES
Joshua K. Mosby, BS Captain, USAF
Committee Membership:
Barry E. Mullins, Ph.D., P.E. Chair
Scott R. Graham, Ph.D. Member
Timothy H. Lacey, Ph.D, CISSP Member
AFIT-ENG-MS-19-M-047
Abstract
The Internet of Things (IoT) represents a new paradigm in computing. The ability to connect everyday devices to the Internet has created a global grid of sensors, generating data that is used to boost productivity in every industry. The IoT has even entered homes, improving quality of life through smart home automation. While it provides these benefits, the IoT is under attack. Long characterized by a lack of security, particularly in terms of authentication and integrity, the IoT has become a favorite target of hackers. The last three years has witnessed the birth of the botnet, delivering never-before-seen denial of service attacks. Traditional cyber security countermeasures are either inapplicable or ineffective, leaving the IoT without adequate protection.
IoT devices are often lightly defended and always online, making them an attractive target. However, many device owners do not realize they have been compromised, particularly when devices lack a user interface. This creates a need for an intrusion detection system: a way to alert device users to abnormal, potentially-malicious behavior. Low computing resources on IoT devices leads many researchers to segregate vulnerable devices and set up defenses on the network boundary. If devices cannot be segregated, this approach is ineffective. A device-centric security solution provides flexibility and be applicable to a larger number of scenarios.
This thesis describes an anomalous-based intrusion detection system that operates directly on IoT devices. In this approach, an agent on each node compares the node's behavior to that of its peers. If these values are not in alignment, the agent generates an
alert. Communication amongst nodes occurs using a distributed average consensus Blockchain. A new block is generated when the majority of nodes agree on a set of values. This becomes the new standard for agents on all nodes to compare against. Nodes continually communicate to reach consensus and generate new blocks, allowing this standard to flex and evolve over time.
To determine the effectiveness of this detection system, an experiment is conducted. Three different code samples simulating common IoT malware are deployed against a testbed of 12 Raspberry Pi devices, which emulate IoT devices. Increasing numbers of hosts are infected until two-thirds of the network is compromised, and the detection rate is recorded for each trial.
The detection system is effective at detecting malware infections, catching at least one malicious node in every trial. 52% of trials catch all infected nodes, achieving perfect detection. The average trial detection percentage is 82%. There are differences in the detection rate for the different malware types, with two above 90% and the third at 60%. This suggests that additional tailoring of the system, as well as some changes to the alert threshold, could further increase effectiveness.
This research presents a low-resource, scalable anomaly detection system that is effective at detecting malware infections. This research provides insights into how Blockchain technology can be used to improve IoT security. It also deploys security mechanisms directly to IoT devices and, by comparing nodes to their peers, turns the multitude of Internet of Things devices into an asset rather than a liability.
Acknowledgments
I would like to express my sincere appreciation to my faculty advisor, Dr. Barry Mullins, for his guidance and support throughout the course of this thesis effort. I would like to thank my sponsor for both the support and latitude provided to me in this endeavor. I would also like to thank my wife for her love and support during my studies.
Table of Contents
Page
Abstract ... iv
Table of Contents ... vii
List of Figures ...x
List of Tables ... xiii
List of Acronyms ... xiv
I. Introduction ...1
1.1 Background...1
1.2 Problem Statement...2
1.3 Research Goals and Hypothesis ...2
1.4 Approach ...2
1.5 Assumptions/Limitations ...3
1.6 Research Contributions ...3
1.7 Thesis Overview ...4
II. Background and Related Research ...5
2.1 Chapter Overview ...5
2.2.1 Symmetric vs Asymmetric ... 5
2.2.2 Public Key Cryptography ... 6
2.2.3 Digital Signatures ... 7 2.2.4 Hashing ... 8 2.3 Distributed Systems ...9 2.3.1 Overview ... 9 2.3.2 Consensus ... 10 2.4 Blockchain ...12 2.4.1 Overview ... 12 2.4.2 Bitcoin ... 13
2.4.3 Other Common Blockchains ... 15
2.5 Internet of Things ...17
2.5.1 Overview ... 17
2.5.2 Security Risks ... 19
2.5.3 Security Countermeasures ... 21
III. System Design ...25
3.1 Chapter Overview ...25
3.2 Design Goals ...25
3.3 Anomalous Detection System ...26
3.3.1 Memory ... 26 3.3.2 CPU ... 27 3.3.3 Network ... 28 3.3.4 Connections ... 29 3.3.5 Logins ... 30 3.3.6 Processes ... 31 3.3.7 Model Comparison ... 31 3.4 Agent Operation ...34 3.5 Blockchain Operation ...38 3.6 Deployment Architecture ...50 3.7 Malware Simulation ...58 3.8 Pilot Studies ...60 3.9 Chapter Summary ...65 IV. Methodology ...66 4.1 Problem/Objective ...66
4.2 System Under Test ...66
4.2.1 Assumptions ... 67 4.3 Metrics ...68 4.4 Factors ...68 4.5 Parameters ...70 4.6 Experiment Design ...70 4.6.1 Experiment Description ... 71 4.6.2 Factors ... 71 4.6.3 Logging ... 72 4.6.4 Testing Process ... 72 4.7 Chapter Summary ...73
V. Analysis and Results ...74
5.1 Chapter Overview ...74 5.2 Success/Failure Results ...74 5.3 Detection Percentages ...76 5.4 False Positives ...81 5.5 Block Characteristics ...82 5.6 Scalability ...84 5.7 Chapter Summary ...85
VI. Conclusions and Recommendations ...86
6.1 Chapter Overview ...86
6.2 Research Conclusions ...86
6.3 Research Significance ...86
6.4 Future Research ...87
Appendix A. Malware Simulation Code ...89
Appendix B. Raspberry Pi Setup ...92
Appendix C. Pilot Studies Setup ...95
Appendix D. Pilot Studies Execution ...97
Appendix E. Model Code ...100
Appendix F. Trial Execution...112
Appendix G. Trial Results ...117
Appendix H. False Positives ...124
List of Figures
Figure Page
1. Public Key Encryption and Decryption Example [9] ... 6
2. Digital Signatures Illustration [9] ... 7
3. Hash Function Illustration [9] ... 9
4. Bitcoin Block Structure [17] ... 14
5. Evolution of Data Flows [22] ... 18
6. Security Architecture of IoT [23] ... 19
7. Memory Screenshot ... 27
8. CPU Capture Screenshot ... 28
9. Network Capture Screenshot ... 29
10. Established Connections Screenshot ... 30
11. Login Capture Screenshot ... 30
12. Placeholder process count ... 31
13. Agent Gathering Data Flowchart ... 36
14. Agents Sharing Models (Simplified) ... 39
15. Record Structure ... 40
16. Block Structure ... 40
17. Consensus Example: Starting Partial Blocks ... 42
18. Consensus Example: Node A Sends Partial Block to Node B ... 44
19. Agent Receiving Blocks Flowchart ... 48
20. Logical Diagram of Test Equipment ... 51
22. Stack Containing Pis 7-12 ... 54
23. Pi Stacks and Switches ... 55
24. Kill-A-Watt Power Meters ... 56
25. Disk Space Capture Screenshot ... 61
26. Malware Simulation Attack Path ... 62
27. System Under Test ... 67
28. Detection Percentages: One Compromised Node ... 77
29. Detection Percentages: Three Compromised Nodes ... 78
30. Detection Percentages: Six Compromised Nodes ... 78
31. Detection Percentages: Eight Compromised Nodes ... 79
32. Detection Percentage by Number of Compromised Nodes ... 80
33. Detection Percentage by Malware Simulation ... 81
34. Block CPU Values Comparison ... 83
35. Malware Simulation 1 Code: Cryptocurrency Mining Bot ... 89
36. Malware Simulation 2 Code: DDoS Malware ... 90
37. Malware Simulation 3 Code: Spyware ... 91
38. Routing Metrics ... 92
39. Agent Install Script ... 94
40. Metrics Script ... 96
41. Telnet Command Sample 1 ... 97
42. Telnet Command Sample 2 ... 98
43. Telnet Command Sample 3 ... 98
45. Pull Logs Script ... 113
46. Block Logs Example ... 114
47. Process Blocks Script ... 115
List of Tables
Table Page
1. Model Comparison Example: Similar Nodes ... 32
2. Model Comparison Example: Dissimilar Nodes ... 32
3. Model Comparison Scoring Formula ... 33
4. Local Model Example: Non-infected Node ... 37
5. Local Model Example: Infected Node ... 38
6. Consensus Example: Partial Block Snapshot ... 45
7. Consensus Example: Forked Partial Block Snapshot ... 46
8. Pilot Studies Mann-Whitney U Test Results ... 64
9. Trial Description ... 69
10. Detection Percentages by Trial ... 77
11. Detection Percentage by # Compromised Hosts ... 79
12. Detection Percentage by Malware Simulation ... 80
13. Block Timing by Malware Simulation ... 84
14. Block Timing by # Compromised Nodes ... 84
15. Trial Results: 1 Compromised Node ... 117
16. Trial Results: 3 Compromised Nodes ... 118
17. Trial Results: 6 Compromised Nodes ... 119
18. Trial Results: 8 Compromised Nodes ... 121
List of Acronyms
Abbreviation Page
AES Advanced Encryption Standard ...40
C2 Command and Control ...20
CIoTA Collaborative Internet of Things Anomaly Detection ...23
CPU Central Processing Unit ...15
CUT Component Under Test ...66
DDoS Distributed Denial of Service ...20
IoT Internet of Things ...1
IDS Intrusion Detection System ...2
IP Internet Protocol...39
IT Information Technology ...50
OS Operating System ...52
PBFT Practical Byzantine Fault Tolerance ...11
PSSH Parallel Secure Shell ...51
SCP Secure Copy ...62
SD Secure Digital...92
SSH Secure Shell ...62
SUT System Under Test ...66
A BLOCKCHAIN-BASED ANOMALOUS DETECTION SYSTEM FOR INTERNET OF THINGS DEVICES
I. Introduction 1.1 Background
In recent years, the number of Internet connected devices has exploded. In the early 2000s, there were more people than devices, whereas today computers far outnumber humans. Estimates predict between 20-50 billion devices by 2020 [1-2]. Much of this growth comes from the “Internet of Things” (IoT), a new paradigm where objects, or things, are connected and are able to work together to achieve a goal, often without the need for human intervention [3]. This growth has benefited various industries by improving productivity, yet security has suffered. Availability is prioritized in many IoT devices while authentication [4], integrity, and confidentiality are lacking. One area of concern is intrusion detection. Botnets infect millions of IoT devices worldwide, yet many owners remain unaware of the compromises occurring in their own home [5]. This issue is exacerbated by the fact that traditional defense mechanisms, such as anti-virus, are infeasible on IoT systems due to computing resource constraints [6]. An additional factor is the constant updates which are required by a signature-based detection approach [7]. A security solution that provides anomaly-based detection helps solve this problem but still requires manual changes when a vendor update occurs. For these reasons, existing research recommends segmenting IoT devices and strengthening defenses on the network boundary [8]. Few solutions for intrusion detection exist for the actual IoT devices.
1.2 Problem Statement
IoT does possess several security advantages, mainly due to the large number of devices on the network. In many networks, the same model of device may be used dozens or hundreds of times. By comparing individual devices to their peers, an Intrusion Detection System (IDS) to detect and alert on anomalous behavior can be created. Blockchain can be used to create such a system that can detect botnet malware. This system is also able to adapt to changing environments (such as a vendor update) without requiring manual whitelist changes.
1.3 Research Goals and Hypothesis
The research goal is to create a system that utilizes Blockchain to run an IDS directly on IoT devices. This IDS focuses on anomalous system detection by comparing nodes to their peers. The hypothesis states that this solution successfully alerts on IoT botnet malware.
1.4 Approach
Three code samples simulating common types of IoT botnet malware are deployed against a testbed of 12 Raspberry Pi devices. Each node participates in a Blockchain, which holds a software configuration model that is agreed upon by the majority of nodes. Each node checks its currently running software against the model stored on the Blockchain and generates an alert if the differences exceed a given threshold. This experiment observes whether the simulation is successful at detecting the malware.
1.5 Assumptions/Limitations
In order to enable proper analysis of the test results, this research applies the following assumptions:
The code samples are representative of realistic IoT malware. Raspberry Pis are representative of IoT devices.
All nodes have identical functionality. Code can be deployed on IoT devices.
Major changes to nodes, such as vendor updates, occur at the same time.
In order to maintain scope and keep the research focused on its goals, this research applies the following limitations:
Raspberry Pis lack a full IoT application.
Symmetric key encryption limits the ability for digital signatures. The Blockchain has the ability for forked branches.
1.6 Research Contributions
This research provides a Blockchain IoT security application that can be directly deployed to IoT devices. Current research assumes that the IoT devices either cannot be modified or lack the resources to run a Blockchain application. For these reasons, current research focuses on segmenting all IoT devices in a network and strengthening defenses on this segment boundary. For some networks, this separation may not be feasible. These situations require a device-centric approach.
Additionally, this thesis utilizes the inherent capabilities of IoT devices: their numbers. The Blockchain created in this thesis is strengthened by higher numbers of cooperating nodes; this decreases the ability of the malware to avoid detection.
1.7 Thesis Overview
This thesis document is organized into six chapters. Chapter 2 presents a brief summary of IoT security issues and voting-based consensus algorithms. Chapter 3 explains the testbed system design as well as the Blockchain itself. The experiment methodology and the results analysis are presented in Chapters 4 and 5 respectively. Chapter 6 summarizes this thesis and describes future work.
II. Background and Related Research 2.1 Chapter Overview
The purpose of this chapter is to explain background technologies necessary to understand Chapters 3 and 4. Section 2.2 discusses cryptography and explains the difference between symmetric and asymmetric technologies. Section 2.3 describes distributed systems and the concept of consensus. Section 2.4 explains Blockchain and its characteristics. Section 2.5 discusses IoT and the security issues associated with it.
2.2 Cryptography
2.2.1 Symmetric vs Asymmetric
Cryptography generally refers to hiding the meaning of a message [9]. The two most common types are symmetric key and asymmetric key cryptography. In symmetric key cryptography, two parties can communicate securely if they know a shared secret key. Both parties use this key to encrypt and decrypt the message; any third party who lacks the shared secret cannot decipher the message. However, this key must be exchanged via a separate secure channel, which often involves physically transporting the key. This creates an implementation problem, especially if the parties do not possess a secure means of transport. Asymmetric cryptography, often referred to as “public key cryptography”, allows two parties to establish a secure connection solely using a public channel (e.g., the Internet) [10]. However, asymmetric key cryptography is generally slower to encrypt and decrypt messages. It is also more resource intensive than symmetric cryptography.
2.2.2 Public Key Cryptography
Public key cryptography features two distinct values: an encryption key and a decryption key. These two keys have an inverse relationship. As the names suggest, the former is used for hiding a message and the latter for deciphering it. Given one of the keys, there is no computationally feasible way to find the other. This allows one of the keys to be made public, while the other is kept secret. The encryption key is referred to as the “public” key, and the decryption key as the “private” key. For example, if Alice wants to send an encrypted message to Bob, she uses his public key to encrypt the message, knowing that only he is be able to decrypt it. Figure 1 illustrates this process.
Figure 1. Public Key Encryption and Decryption Example [9]
Let 𝒙 represent the original message and 𝒚 represent the encrypted message. Bob’s asymmetric cryptography 𝒌 consists of two keys: 𝒌𝒑𝒖𝒃 is Bob’s public key, and 𝒌𝒑𝒓 is Bob’s private key. In this example, Bob begins by sending his public key to Alice. The center represents the unsecure channel, where anyone may listen to communications. Alice uses an encryption algorithm 𝒆 and Bob’s public key to encrypt the plaintext 𝒙. This results in a cipher text 𝒚 which is sent to Bob. Using his private key, Bob uses a decryption algorithm 𝒅 to retrieve the plaintext 𝒙. The only data that was sent through the unsecure
channel is the public key 𝒌𝒑𝒖𝒃 and the cipher text 𝒚. Neither of these can be used by an outside attacker to compromise the original message 𝒙.
2.2.3 Digital Signatures
One application of public key cryptography is digital signatures. On physical documents, participants are asked to sign the form in ink with their unique signature. This verifies the identity of the person and provides non-repudiation: the person cannot deny having signed the message. On the Internet, non-repudiation is provided by digital signatures, which build on the inverse relationship between the public and private key [11]. This process is illustrated in Figure 2.
Figure 2. Digital Signatures Illustration [9]
A user named Bob has a message x that he wants to sign. Bob uses his private key but encrypts the message instead of decrypting it. This encrypted message is known as the signature and is denoted by 𝒔in Figure 2. He then sends the original message 𝒙 and the signature 𝒔 to Alice, who can verify the signature using Bob’s public key 𝒌𝒑𝒖𝒃. Alice
attempts to decrypt the signature with Bob’s public key. If the decrypted message is the same as the original message, then the signature is valid. Alice can trust that Bob sent this message, since only Bob has access to the private key used to sign the message. If the decrypted message and original are different, the signature is not valid. Either Bob signed the wrong message, or the message did not really come from Bob. In summary, Bob “signs” a message with his private key, and Alice “verifies” the message using Bob’s public key. In fact, multiple people can verify the signature, if they have access to the original message.
2.2.4 Hashing
Public key cryptography allows the creation of digital signatures. However, these signatures are the same length of the original message, which raises some implementation issues. Some asymmetric cryptography functions require breaking up the input into smaller chunks. This results in multiple signatures, one for each fragment. This creates a security risk because while individual fragments are protected, the whole message is not. If an attacker can intercept the transmission, they could re-arrange fragments or remove segments. Additionally, long signatures require overhead. The computational cost to generate them is higher, and more resources are required to send them across the network. These issues can be solved by a short signature that could represent messages of any length. Hash functions provide the solution.
This process is shown in Figure 3. A user wants to sign the message 𝒙, but the message is too long. Rather than breaking up the message and individually signing each segment,
𝒙 is sent to a hash function 𝒉. This produces a fixed-length output 𝒔𝒊𝒈, which can then be signed using a private key 𝒌𝒑𝒓. Interestingly, this process also works with multiple
messages. If 𝒙𝟏 through 𝒙𝒏 are different messages or files, a user can generate a single hash for the collection.
Figure 3. Hash Function Illustration [9]
Hash functions map input data of any length into a fixed length output [9]. Hash functions are one-way, or trapdoor, functions. It is computationally easy to calculate the hash in one direction, but computationally infeasible to calculate the opposite direction. Even if an attacker knows the hash function and possesses the output, it is difficult to find the input. Likewise, it is infeasible to find collisions, which is where two different inputs produce the same hash output. Overall, the output of a hash function reveals no information about the original message. This functionality is critical to the creation of Blockchains.
2.3 Distributed Systems 2.3.1 Overview
The first computers were large, expensive, and difficult to connect together [12]. The arrival of the personal desktop computer changed this, followed by the growth of embedded systems and eventually leading to the IoT. Each transition has made computers smaller and cheaper. This has made it feasible to combine large numbers of computers into a single computing system, which we call a distributed system [12]. These systems are comprised
of nodes, which can be physical hardware devices or software processes. These nodes are autonomous; they behave independently. However, nodes work together to achieve a common goal. The nature of this goal is determined by the application. Common uses include distributed databases, web applications, and a distributed ledger.
When designing a distributed system, there are several important issues to consider. Network reliability, clock management, and distribution transparency must be addressed in the architecture. Additionally, the concept of consensus and consistency is critical. The distributed system must maintain a consistent set of data on every node. The ability to handle crashes and malicious nodes leads to several complex approaches.
2.3.2 Consensus
Consensus means reaching agreement. In the context of distributed systems, this refers to all nodes in a system agreeing on a set of data. This is a requirement for many distributed system applications, especially for a distributed ledger. There is a large amount of literature on this subject; consensus mechanisms are differentiated by their ability to handle crash faults and “Byzantine Faults”. Crash faults refer to when a node shuts down or otherwise loses its ability to communicate and process data. These crashes may be short or long term. Crash-tolerant algorithms allow the system to continue to reach consensus even if nodes crash. Byzantine faults refer to the Byzantine Generals Problem and represent the presence of malicious nodes on the system. These concepts are explored in the following paragraphs.
One of the most widely used consensus algorithms is Paxos [13]. This is a crash-tolerant algorithm that seeks to achieve consensus on a value. That is, from a set of proposed values all nodes agree on which value should be chosen. Paxos uses a leader
election system to establish the chosen value. A system of timeouts ensures that even if the leader node shuts off, the algorithm selects a new one on the next iteration. This system is complex yet effective. However, Paxos is not designed to address nodes acting maliciously.
The Byzantine Generals Problem [14] is an example of how malicious nodes can affect consensus. In this example, a group of generals must determine whether to attack or retreat via sending messengers to each other. All generals must agree on the same outcome, otherwise they are destroyed. However, messengers may be intercepted or stopped, and one of the generals may be a traitor. The ability for the system to reach consensus under these circumstances is a complex problem. Many consensus algorithms refer to “Byzantine Faults” as the presence of malicious nodes, and “Byzantine Fault Tolerance” as the ability to reach consensus despite the presence of malicious nodes.
One of the algorithms to address this problem is Practical Byzantine Fault Tolerance (PBFT) [15]. This consensus algorithm shows that a distributed system is able to reach consensus as long as 2/3 of the nodes in the system are not malicious. If that threshold is crossed, the system breaks down and consensus may not be achieved. Alternatively, an invalid consensus may be pushed by the malicious nodes. PBFT does have some flaws, mostly with the large amount of network traffic required.
In almost every case, consensus requires nodes to agree upon a value. However, which values are possible depends on the application. In some cases, like the Byzantine Generals Problem, there are only two options, attack or retreat. Algorithms like Paxos allow for several values to be proposed by nodes. Other applications use distributed average consensus. This method is used when every node has a set of data, and the consensus value
should be the average of all nodes. In these algorithms, the complexity occurs in how the nodes communicate and calculate this average value.
2.4 Blockchain 2.4.1 Overview
A new approach to the distributed consensus problem is known as Blockchain. The term Blockchain is often confused with the specific implementation of its most common applications. This section explores the basics of Blockchain, briefly touch on the proof-of-work consensus protocol popularized by Bitcoin, and establish why Blockchain is still useful even with different consensus mechanisms.
At its core, Blockchain is a decentralized data structure. The same set of data is distributed across several nodes, eliminating central points of failure. This data is organized into blocks, with each block linked to the previous one in an unbroken chain. There are two variants of Blockchain. The first is a transaction-based approach; a known state is assumed to have existed before the first block, and every block consists of actions affecting that state. Nodes calculate the current state by applying actions to the previous state. This approach makes individual blocks smaller, but requires that each node keep a copy of the full chain. The second approach involves storing the entire state in each block. This approach is less common but allows storing a subset of the chain rather than the entire chain.
Blockchain is characterized by strong integrity. Each block possesses a field containing a hash of the previous block. This makes it difficult for an attacker to tamper with previous blocks. If any data in a block is changed, its hash changes as well. All subsequent blocks
are now invalid since the previous block fields do not match [16]. This mechanism provides a simple yet effective ability to monitor changes to previous blocks.
2.4.2 Bitcoin
In late 2008, Satoshi Nakamoto (suspected to be a pseudonym) published the Bitcoin whitepaper [16]. In this publication, Nakamoto describes the implementation of a digital currency system. Such ideas had been proposed before, but Bitcoin is unique because it does not require a trusted third party. The utilization of public key infrastructure [17] and secure hashing algorithms allows for central functions, like verifying transactions, to be performed in a decentralized fashion. This is achieved by a transaction based Blockchain, in which each node applies the transactions in the new block to its current state. Critically, Bitcoin allows each node to verify the validity of a block before executing its transactions.
Bitcoin’s consensus algorithm is called proof-of-work, and it ensures that the ledger is append-only. Several items are used as the inputs to a hash function including a group of transactions, the hash of the previous block, the timestamp, and an unknown number called a nonce. The goal is to find a nonce that makes the resulting hash match a pattern. For example, there exists some number that makes the result hash begin with eight zeroes. Special nodes called miners are constantly working on the next block, and broadcast it when they find a valid nonce. The miners are running a brute force algorithm, but other nodes can verify it with a single hash function. Most importantly, if a previous block’s value is changed, its hash changes. This makes every subsequent nonce no longer valid, and the corresponding blocks fail verification. With each successful nonce calculation, the Blockchain grows, and nodes reach consensus by accepting the new block as valid. This includes recognizing and executing all transactions found in that block. Figure 4 illustrates
Bitcoin’s block structure. Each block contains a field containing the hash of the previous block. A change in one of the transactions on the left block changes its hash, resulting in the previous hash field of the block on the right being invalid.
Figure 4. Bitcoin Block Structure [16]
The key piece of Bitcoin’s consensus is that nodes always work to extend the longest Blockchain. Consider the following example. Nodes A, B, and C are all working on the same ledger of length 10. Node A finds the nonce first, and broadcasts it to B and C. Now Node A is working off a valid Blockchain of length 11, while B and C are working off length 10. Thus, B and C switch to furthering Node A’s chain, accepting the new block to their copy of the ledger. All three nodes are now in sync. It is possible for two nodes to discover the nonce at the same time, or to discover different nonces that are both valid. This leads to a “fork”, where there are two versions of the Blockchain. These often occur due to network latency making it appear that different events occur simultaneously. When a forks occurs, the Blockchain continues to operate. One of the forks eventually outpaces the others, and since nodes are configured to extend the longest chain, all nodes switch to that fork.
Extending the longest chain acts as a security mechanism as well. Suppose an attacker changes a transaction in a previous block. The new values exist only in the attacker’s copy of the ledger; no one else accepts the new data as valid. In order for other nodes to accept
the changes, the attacker must to extend his chain beyond the real one by calculating new nonce values. This requires the attacker to have more computing power than the rest of the nodes, which is known as the 51% attack. On a global Blockchain like Bitcoin, this is difficult [16].
Bitcoin is well suited for its stated goal of a decentralized, electronic cash system. However, there are several limitations. Firstly, the proof-of-work consensus algorithm is resource intensive. The mining process places a heavy workload on the Central Processing Unit (CPU). This algorithm also requires that the entire chain be stored, which at the time of this writing is >100 GB. All applications that use this approach must be aware of the storage issue, particularly if the desire is for a public Blockchain (this concept is be explained in Section 2.4.3). Overall, a direct application of Bitcoin’s technology to a different industry is inefficient.
2.4.3 Other Common Blockchains
Since the creation of Bitcoin, many variants of Blockchain have appeared, supporting a myriad of applications. All of these variants involve combining a set of blocks into a chain and linking these blocks using a hash of the previous block. However, other aspects, including proof-of-work, may be absent.
Ethereum combines Bitcoin with a Turing-complete programming language [18] through “smart contracts”. These are simple programs that live on the Blockchain and interact with nodes according to their code. Smart contracts allow Ethereum to serve as a framework for creating more advanced Blockchain applications. The code for each contract is stored as part of the block (often as a special type of transaction). This inherits the strong integrity found in Bitcoin; a smart contract represents an immutable piece of
code that is also publicly viewable. In theory, this allows greater confidence in the code that is running. However, there are several limitations. Smart contracts have restrictions on non-determinism, which limits the ability to write complex code. Secondly, code is not updated; instead a new version is deployed to the Blockchain. This makes updating and adapting to new situations more difficult.
Ethereum itself began as a proof-of-work Blockchain, with a slightly different algorithm that kept many of the same characteristics. A stated goal is to move to a proof-of-stake approach, which resembles a voting system where the share of the vote is determined by the cryptocurrency owned by the account. This approach is seen as an alternative to proof-of-work that eliminates some of the intensive computations. Ethereum is also one of the first Blockchains to allow private chains. A private Blockchain is restricted to a small set of users, and provides the owners with greater control. However, the integrity of Bitcoin depends on having a large number of nodes. Private Blockchains may end up with weaker security as opposed to public options. Ethereum does offer a global public Blockchain which remains its most popular, but the concept of private and permission-controlled Blockchains are used in other applications.
Hyperledger Fabric [19] is an effort by the Linux Foundation to develop a Blockchain framework completely removed from cryptocurrency. This is a highly modular approach built with Docker [20] containers that allows for a high degree of customization. Hyperledger Fabric moves away from cryptocurrencies and towards the realm of distributed systems, but does maintain some of the key elements of Bitcoin. This Blockchain relies heavily on the use of smart contracts, which originate from peer nodes. Hyperledger Fabric requires each transaction to be endorsed by a set of nodes, and all
transactions are sent to a central ordering service that arranges the transactions. Following this step, the final transactions are validated before being applied to the local ledger on all nodes. Each of these steps are highly customizable, which represents a major benefit of Hyperledger Fabric. However, there are some limitations. The requirement for an ordering service re-introduces a measure of centralization. Additionally, endorsing nodes must reach an agreement on the resulting value of a smart contract. For example, if two nodes want a smart contract to compare a local file to a value stored on the Blockchain, both nodes must agree on the result for the transaction to be executed. If one node has a successful match while the other does not, no transaction is endorsed and the process stops, leaving the user with no knowledge of which node failed the check. Creative use of multiple smart contracts with restrictive endorsement policies could mitigate this problem, but another limitation is the reliance on containers. Pilot studies with Hyperledger Fabric were unable to get memory usage below 100 MB, which may be too intensive for IoT platforms.
These three examples are the most common implementations of Blockchain. However, each has its limitations and caters to a particular audience. For specific applications and scenarios, a Blockchain framework is the best solution. However, if the most common frameworks fail, a Blockchain can be designed from scratch.
2.5 Internet of Things 2.5.1 Overview
Internet of Things is a term that generally refers to Internet-connected embedded devices, especially those that operate with little to no interaction with users. These devices
may be in vehicles, home appliances, medical technology, industrial processes, or any other industry. This reflects a new paradigm in which every device is a sensor. Figure 5 illustrates the change in Internet traffic, with sensors uploading data to cloud providers [21]. The influx of IoT devices means that more data is being uploaded than downloaded. Data is constantly being collected, analyzed, and used as feedback to improve the process. This last point is why these devices are often called “smart”. Often constructed with a singular purpose, these devices are much simpler than traditional personal computers.
Figure 5. Evolution of Data Flows [21]
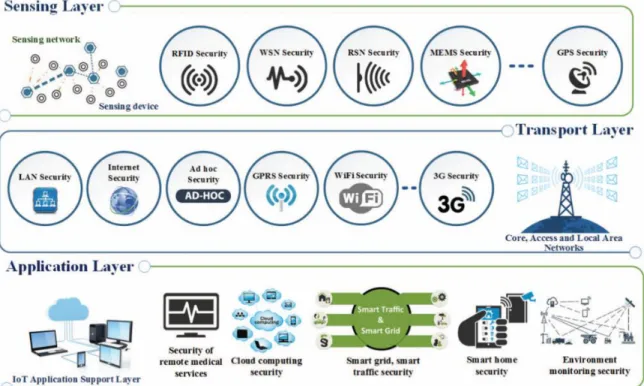
There are many models for IoT, usually consisting of three layers [23-24]. The first of these is the sensing layer. These devices sense their environment and collect data. This data is passed to the transport layer, which handles the transportation of data. Various methods [23] are used to deliver data from the sensors to the application layer. Here, the data is stored and used to generate feedback. This feedback may be completely automated,
or could produce reports for a user. It may send signals back to the sensing devices to change their processes or may host the feedback on a cloud server for later consumption. Figure 6 shows an illustration of the layers and the security issues at each level.
Figure 6. Security Architecture of IoT [22]
In all its forms, IoT is spreading. In 2012 the number of Internet connected devices exceeded the number of humans for the first time [23]. Experts predict that this trend continues, with Cisco predicting 50 billion devices by 2020 [2]. This fast growth, fueled by affordable device manufacturing and cloud infrastructure, has led to security risks [23], which are be explored in Section 2.5.2. Countermeasures to mitigate these risks are explored in Section 2.5.3.
2.5.2 Security Risks
For many IoT device manufacturers, security is an afterthought. The security standards of confidentiality and integrity are often not implemented or fail to adequately protect
against threats. In terms of confidentiality, many users are unaware of the data their devices are collecting, which can lead to privacy concerns [6][24]. This risk is heightened since many IoT devices use insecure protocols that send data in clear text. IoT systems have little to no checks on device and message integrity, which opens the possibility of an attacker intercepting and modifying firmware. Another issue is authentication. In many cases a default password encompasses the entirety of this security [4].
The rise of IoT has seen the rise of botnets and the distributed denial of service (DDoS) attacks they specialize in [5][25]. Botnets function by infecting large number of devices and establishing command and control (C2) channels over these “bot” nodes. During an attack, the botnet owner sends signals to the bots through a series of intermediary nodes. These bots attempt to send as much traffic as possible to a target host (often a webserver). If the botnet is large enough, the target host is crippled. This is one of the most common uses of a botnet, but there are many other nefarious activities a malicious actor can perform with a compromised IoT device.
One of the most famous botnets is called Mirai. The original form of this botnet was active during late 2016 and early 2017, although variants of it continue to persist. Mirai is notable for setting records for DDoS attacks, at one point reaching 1.3 terabytes per second in an attack against Dyn [5]. Mirai was also notable due to its makeup; most of Mirai’s bots were IoT devices, which had not been used in such an attack before. The weak authentication, Internet accessible ports, and the fact that these devices were always left on made them perfect targets for the malware. Mirai specifically targeted the Telnet service, which many IoT devices utilize. A 2017 study ran a search for Internet-accessible Telnet
ports, and found over 400,000 devices with Telnet open. The majority of these were IoT devices, and 50,000 had no authentication [4].
2.5.3 Security Countermeasures
Many IoT devices are resource-constrained. Compared to a multi-purpose computer workstation, these single-purpose devices have few computing resources. The processor and memory are limited, and power consumption must also be monitored. Many IoT systems also feature a limited user interface, and some feature none at all [7]. These factors limit the effectiveness of traditional security countermeasures. For example, anti-virus often cannot effectively run on these platforms [7]. When combined with the lack of a user interface, it is difficult for system owners and security professionals to defend IoT networks.
To combat these issues, many researchers use non-IoT devices to support the Blockchain. Dorri [8][28] adds a central device called a “smart home manager”. This device has the resources to run as a full Blockchain node, and interacts with cloud providers and other intermediaries, creating a tiered system. IoT devices are not directly connected to the Blockchain, instead they send communications to the smart home manager, who then encodes the request into the Blockchain. The smart home manager acts like a network proxy, while also maintaining a secure log of connections. All IoT traffic must flow through this node, and it compares the traffic to rules (also encoded on the Blockchain). This research is a promising solution that bypasses many IoT resource concerns. Similar approaches can be seen in other research by Özyılmaz [27] and Novo [28] and the idea is also prevalent in non-Blockchain solutions [25]. However, this method has some limitations. This approach is centralized, and all devices could lose availability if the
manager node goes down. Additionally, a device may have multiple communication channels but the proxy only observes one of them. This approach does not provide immediate notification that a device has been compromised, although it does limit its ability to communicate outside the network. This could be mitigated by an automated script to review connection logs. Lastly, this approach requires that all IoT devices be segmented in a network behind the manager node. IoT devices may be physically and logically separated, and it may not be feasible to combine them together in one place. This could be mitigated by having separate enclaves with a manager at each one, but the cost of such a system rapidly increases.
There are security approaches that focus on devices, but these are limited in their scope. Huh [29] utilized the Ethereum Blockchain and smart contracts to integrate several IoT devices including a smart thermostat and lightbulb, with all communication occurring over the Blockchain. Benefits of this approach include message integrity and authentication. Messages encoded in the Blockchain are immutable, creating a secure log of all communication. Likewise, a device can verify who sent a message, since each is signed with the private key of the sender. However, the cost of calling smart contracts in Ethereum presents a challenge. Ethereum is closely tied with cryptocurrency, and executing smart contracts requires a payment for each execution. On the public Ethereum Blockchain, this can lead to rising costs. On a private Ethereum Blockchain, “free” currency can be given to nodes, but the administrator must act to ensure that nodes have enough to execute their contracts. Likewise, some applications may not easily convert to smart contracts. Lastly, the public Ethereum Blockchain is used in Huh’s experiment, which could lead to privacy concerns as well as storage issues.
One promising proposal is the Collaborative IoT Anomaly Detection (CIoTA) system proposed by Golomb [31]. This research creates a lightweight framework for collaborative anomaly detection: nodes work together to detect anomalous behavior. This occurs by leveraging a trusted detection model that nodes compare against using self-attestation. This trusted model is constantly updated via group consensus; the model represents the behavior of the majority of nodes. In CIoTA, nodes collaborate through a custom-built Blockchain mechanism, which is used to reach consensus on a new trusted model and to share this amongst all relevant devices.
In Golomb’s research, CIoTA is a framework that can support various security solutions. CIoTA defines an agent that runs directly on the device and participates in Blockchain with other agents. How the agent interacts with the system, and what data it uses, can be defined by the user. In Golomb’s research, the featured solution is called JumpTracer. This technology is designed to combat code injection and code re-use attacks, which attempt to manipulate control flow of a program with the end goal of executing the attacker’s code. The CIoTA agent utilizes the JumpTracer code to monitor a specific application. The agent tracks the memory jump sequences the application uses, and compares these sequences with data from other agents. By comparing the same application running on several machines, JumpTracer hopes to spot anomalies and identify intrusions.
Golomb makes several assumptions during this research. This system relies on the majority of the network behaving normally (i.e., with unaltered applications). Thus, Golomb assumes that an attacker cannot exploit the majority of the network in a short period without detection. If every node is infected instantly, CIoTA sees all nodes in agreement and does not generate an alert. However, if the attack proceeds slowly, infecting
a few nodes at a time, CIoTA can catch it. Another assumption is related to the agent itself, which sits on the IoT devices that may become compromised. The agent runs with elevated permissions, and Golomb assumes that bypassing the agent is unlikely without being detected first. There are several limitations. CIoTA depends on many identical devices with the same functionality. A separate Blockchain is required for each different device model, and even firmware differences between devices could negatively impact the system. CIoTA also depends on heavy network traffic.
There are benefits to CIoTA. Golomb’s research included an experiment where code injection attacks are launched against a testbed of 48 Raspberry Pi devices. CIoTA is successful at detecting this malware, and runs with a low footprint, including memory usage of ~60 KB. Despite its limitations, this research represents a low-resource security solution that can run directly on IoT devices. Additionally, CIoTA acts as a framework; all aspects of the system can be customized, and the anomaly detection model itself can be switched out entirely. Instead of tracking memory jump sequences, CIoTA can check variables such as memory usage across a program or the entire device, while still utilizing the Blockchain framework for communication and consensus.
2.6 Chapter Summary
This chapter explains background technologies necessary to understand Chapters 3 and 4. Section 2.2 discusses cryptography and explains the difference between symmetric and asymmetric technologies. Section 2.3 describes distributed systems and the concept of consensus. Section 2.4 explains Blockchain and its characteristics. Section 2.5 discusses IoT and the security issues associated with it.
III. System Design 3.1 Chapter Overview
This chapter explains the system design, which utilizes the CIoTA Framework designed by Golomb but features a custom anomaly detection model designed to combat different threats. Section 3.2 covers the design goals and reasons for modifying Golomb’s CIoTA. Section 3.3 describes the anomaly detection model and its operations, specifically how two models are compared against each other. Section 3.4 describes the agent that runs on each device, and how it uses the anomaly detection model to alert on malicious behavior. Section 3.5 explains how agents communicate over the Blockchain, and how the system reaches consensus. Section 3.6 outlines the hardware and software specifications of the testing equipment, as well as resource requirements for running the Blockchain and agent. Section 3.7 explains the malware threats this research confronts, and the code created to simulate these threats. Section 3.8 provides additional data on the anomaly detection model, specifically why certain variables are chosen.
3.2 Design Goals
The overall goal of this research is to create a system that can detect malicious behavior. This system must be able to run directly on IoT devices, and thus requires a low resource footprint. A blacklist approach to detection (similar to anti-virus) is not desired, as constant signature updates are currently infeasible in an IoT environment. For these reasons, this research builds on the CIoTA system. This framework provides an agent that runs directly on IoT devices and performs collaborative detections to alert on anomalous activity. This agent is flexible and can adapt to changing criteria without requiring manual updates. A
key difference between Golomb’s work and this research is the trusted model for nodes to compare against. Rather than focus on memory jump sequences, the model is replaced with six variables that represent the overall behavior of the device. Changing the model allows for the scale of detection to extend beyond a single application, and combats a wider variety of malware threats. The code for CIoTA is available on Golomb’s Github page, and is licensed under the MIT open source license [30]. Several files are modified, but the majority of changes occur in the new model code. This consists of three files, and can be viewed in Appendix E.
3.3 Anomalous Detection System
With the goal of detecting anomalies, each node’s behavior is compared against a trusted source. In order to quantify a node’s behavior, and allow for operations like comparison, the concept of an “anomaly detection model” (hereafter referred to as a “model”) is introduced. This is a structure which defines relevant variables and operations, and in this research the model provides a snapshot of how a device is running. The model used in this research focuses on six areas: memory, CPU, network, connections, logins, and processes. Sections 3.3.1 - 3.3.6 describe these areas, and Section 3.3.7 describes how models are compared. In this research, the hosts are Raspberry Pi devices running a Linux operating system, which is discussed further in Section 3.6.
3.3.1 Memory
Memory refers to the memory usage of the device, specifically how much of the system’s memory is utilized. The command to gather this data is:
The free command shows statistics on memory usage of the host, and a screenshot of the command’s output is shown in Figure 7. This output is fed into the awk command, which divides the memory used by the total memory to achieve a percentage. When the free command is called, the -m option specifies to list values in MB. For the awk command, the NR==2 option specifies to operate on the second line. The print statement tells awk to print the result as a floating-point number with two decimal places. The $3 references the third column, which displays the used memory in MB. The $2 references the second column, which represents the total memory in MB. The used value is multiplied by 100 and divided by the total value to produce a percentage.
Figure 7. Memory Screenshot
3.3.2 CPU
CPU refers to the overall processor utilization of the device. Specifically, processor load average is used to compare nodes. Processor load measures whether the processor is over or under-utilized. This includes recording the time the processor is idle (under-utilization) and how many processes are waiting for CPU time (over-(under-utilization) [31]. Numbers lower than 1.0 indicate that the CPU is under-utilized, with lower numbers indicating more idle time. Numbers higher than 1.0 indicate that the CPU is over-utilized and that processes are waiting for CPU time. The command to gather this data is:
The top command is run with the -b option, which enables re-directing the output, and the -n1 option, which specifies to only show a single iteration, or snapshot, before ending. A sample of the output from this command is shown in Figure 8. This output is passed to the grep function, which searches for a line with the keyword “load”. This line is passed to the awk command which prints the third value from the right (NF-2) as a floating-point number with two decimal places. In Figure 8, this value is 0.07. The top command output shows the load average over the last minute (0.07), last five minutes (.02), and last 15 minutes (.00). For this research, only the last minute is considered.
Figure 8. CPU Capture Screenshot
3.3.3 Network
Network refers to the amount of network activity on a device. This is measured in the number of packets received by, and transmitted by, a specific network interface. For this research, the number of received packets and transmitted packets are calculated independently, then added together to create a final value. The command for the number of received packets is:
netstat --interfaces | grep eth0 | awk '{print $3;}' The command for the number of transmitted packets is:
netstat --interfaces | grep eth0 | awk '{print $7;}'
The netstat command with the --interfaces option displays all interfaces and their statistics, and its output is shown in Figure 9. This output is passed to the grep command
which extracts the line containing the keyword “eth0”. This line is forwarded to the awk command which prints the 3rd (for received packets) or 7th (for transmitted packets)
columns. These two columns are labeled “RX-OK” and “TX-OK”, and they show the number of normal packets; these are packets that the interface can receive, do not contain errors, and are not dropped. In Figure 9, the number of packets increases between the execution of commands, with RX-OK increasing from 25 to 29 and TX-OK increasing from 28 to 29.
Figure 9. Network Capture Screenshot
3.3.4 Connections
Connections refers to the number of established connections between a given host and other nodes. Specifically, the number of active transmission control protocol (TCP) connections are observed. The command to pull this data is:
sudo netstat -ntap | grep EST | wc -l
The netstat command is used to view the status of network ports. The output of this command can be seen in Figure 10. The sudo command is used to ensure that all ports are seen. The -n option does not resolve host names and uses numeric addresses. The -t option focuses on TCP connections, the -a option shows all sockets, and the -p option shows the program name and process ID. The output from netstat is provided to grep, which searches for the lines with the keyword “ESTABLISHED”. The number of lines is counted and
produces the final number using the wc command, where the -l option outputs the number of lines. Figure 10 shows an example of this command.
Figure 10. Established Connections Screenshot
3.3.5 Logins
Logins represent the number of successful logins on the device. Only recent and interactive logins are considered. The command to gather this data is:
last -s -10min | wc -l
The last command shows successful logins. The -s option specifies to look at only recent logins, and the -10min option limits the results to only logins in the last ten minutes. The output from last is shown in Figure 11 and is passed to the wc command to count the number of lines, and thus the number of logins. However, the last command always provides at least two lines of output. For this reason, the value from this command is subtracted by 2 to gain the actual number of recent logins. In Figure 11, the actual number of recent logins is 3 – 2 = 1.
3.3.6 Processes
Processes refers to the number of processes running on the device. Specifically, this research looks at all processes, regardless of user/owner or how the processes are started. The command used to capture this data is:
ps aux | wc -l
The ps command displays a list of running processes, and a sample of the output can be seen in Figure 12. The ‘a’ option shows processes from all users. The ‘u’ option provides a column with the process owner, and the ‘x’ option shows processes that are not executed from a terminal. Similarly to logins, the output from the ps command always has one line, so the result is subtracted by 1 to get the final process count. The recorded number of processes in Figure 12 is 100.
Figure 12. Placeholder process count
3.3.7 Model Comparison
These six variables present a picture of a node’s current state. However, the anomaly detection system requires the ability to compare two nodes and establish their similarity. This is accomplished through a comparison function that evaluates each variable individually. It calculates the difference between the two values and assigns a number of points representing the degree of similarity. Higher points represent similarity, and lower
points represent differences. The points for each variable are added to create a final value. Examples of this comparison can be seen in Tables 1 and 2.
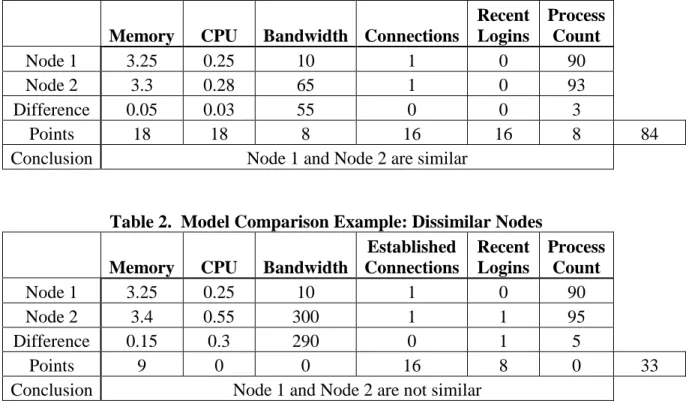
Table 1. Model Comparison Example: Similar Nodes
Memory CPU Bandwidth Connections
Recent Logins Process Count Node 1 3.25 0.25 10 1 0 90 Node 2 3.3 0.28 65 1 0 93 Difference 0.05 0.03 55 0 0 3 Points 18 18 8 16 16 8 84
Conclusion Node 1 and Node 2 are similar
Table 2. Model Comparison Example: Dissimilar Nodes
Memory CPU Bandwidth
Established Connections Recent Logins Process Count Node 1 3.25 0.25 10 1 0 90 Node 2 3.4 0.55 300 1 1 95 Difference 0.15 0.3 290 0 1 5 Points 9 0 0 16 8 0 33
Conclusion Node 1 and Node 2 are not similar
In Tables 1 and 2, two nodes are compared. For both nodes, the six variables that make up the model are listed, and the difference between these fields is calculated. From the difference, points are allocated based off the scoring system shown in Table 3. These points are tallied to produce a compare score, shown in the bottom right of Tables 1 and 2. In Table 1, this score is 84, which indicates that these two nodes are operating in a similar fashion. In Table 2, this score is 33, which indicates that these two nodes are operating differently. This research uses a threshold of 55, which testing reveals to represent a balance between detecting malicious nodes and limiting false positives. Scores below 55 indicate that nodes behave differently, while scores above 55 indicate that nodes are similar. The scores are calculated from a possible 100 points. Since 100 does not divide
evenly into six variables, memory and CPU data is given a slight preference, with a possible 18 points while the other four variables have a maximum of 16 points. These values are chosen because pilot studies reveal memory and CPU to consistently be strong indicators of malicious presence. Pilot studies also provides initial estimates of the range of potential difference values for each variable, and further testing found the values in Table 3 to represent the best balance between detections and false positives. The resulting scoring formula is shown in Table 3.
Table 3. Model Comparison Scoring Formula
Full Points Half Points Zero Points CPU ≤ 0.1 ≤ 0.25 > 0.25 Memory ≤ 0.1 ≤ 0.25 > 0.25 Bandwidth ≤ 50 ≤ 100 > 100 Established Connections 0 1 > 1 Logins 0 1 > 1 Process Count ≤ 1 ≤ 3 > 3
Due to the wide range of values across these six variables, a sliding scale is rejected in favor of three possible outputs. Each of the six model variables can provide full points, half points, or zero points. For memory and CPU this is 18, 9, or 0; for the other variables the possible outcomes are 16, 8, and 0.
The specific values in Table 3 are designed to maximize detection while limiting false positives. They are initially estimated by observing data from the pilot studies, but further testing adjusted these values to the current Table 3. A discrete scale is chosen due to be consistent across all variables. Memory and CPU give full points for a difference less than or equal to 0.1, half for a difference greater than 0.1 but less than or equal to 0.25, and zero
points for differences greater than 0.25. Bandwidth gives full points for differences less than or equal to 50, half points for differences less than or equal to 100, and zero points for differences greater than 100. For established connections and logins, full points are only given for no difference between the values. A difference of 1 gives half points and anything higher results in zero points. Process count grants full points for differences of zero or one, half points for differences of two or three, and zero points for anything higher than three.
3.4 Agent Operation
From a code standpoint, the heart of the CIoTA framework is the agent. This process runs on each IoT device and handles all aspects of detection, to include gathering data about its node, sharing this data with others, and receiving data from other nodes. Each agent maintains a local model that represents the current state of the device. This local model is constantly updated by the agent; every second it pulls new data from the device and compares it to the previous local model. If the changes are drastic, an alert is generated. However, when the agent initially starts there is no previous model to compare against. For this reason, the agent begins in a training phase where it simply accepts new values without doing a comparison. The agent also does not interact with other nodes during this time. The training phase is designed to establish a baseline of normal activity. An attacker could infect a node during the training phase, but when the nodes begin to communicate this infection is discovered [32]. In this research, the training phase lasts 20 seconds. Since launching the agent requires interacting with the devices, this period allows for any artifacts from that interaction to subside.
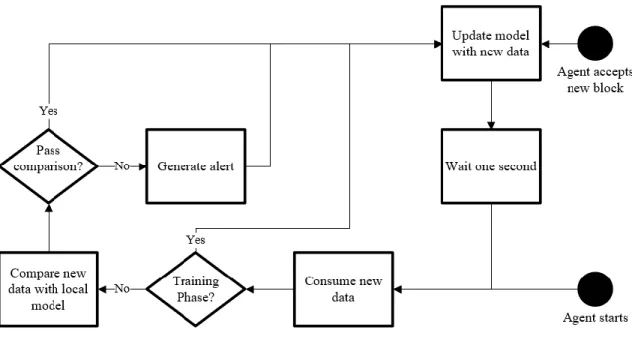
The flowchart in Figure 13 describes the agent’s operations for updating its local model. There are two starting positions for this process. When the agent first starts running, the flowchart begins at the black circle on the bottom right side of the diagram. The agent pulls new data from its node (referred to as “consuming” new data). This is accomplished using the commands discussed in Section 3.3, and this diagram assumes that the agent has created an empty local model if one does not already exist. During the training phase the new data is accepted, and the local model is replaced with the new data. Outside the training phase, the new data is compared to the local model. If the two are similar (above the 55 compare score threshold), it passes comparison and updates the local model. However, if the comparison fails, an alert is generated to indicate that something is amiss. Regardless of the comparison result, the model is updated with the new data. This ensures that the local model represents the latest state of the node. After updating the local model, the agent sleeps for one second before gathering new data.
Figure 13. Agent Gathering Data Flowchart
Blocks are discussed in depth in Section 3.4, but they can influence how the agent handles its local model. When the agent accepts a new block, it interrupts the gathering data process. This can be seen at the black circle at the top right of Figure 13. The values from a new block are directly applied to the local model. The next time the agent polls data from its node, it compares against the block’s model. The model from the new block represents the consensus of the network; the majority of nodes agree that these values look correct. In essence, the agent now compares its node against the trusted model, and generates an alert if behavior differs.
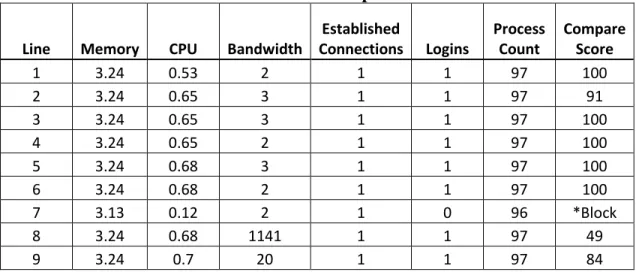
Tables 4 and 5 provide further examples of this process. These tables show a snapshot of logs from a node and illustrate how local models change.
![Figure 5. Evolution of Data Flows [21]](https://thumb-us.123doks.com/thumbv2/123dok_us/933775.2621064/34.918.164.789.407.795/figure-evolution-data-flows.webp)