ENGINEERING PHYSICS AND MATHEMATICS
A hybrid elicit teaching learning based optimization
with fuzzy c-means (ETLBO-FCM) algorithm for
data clustering
Janmenjoy Nayak
a,*, Bighnaraj Naik
b, D.P. Kanungo
a, H.S. Behera
a aDepartment of Computer Science Engg. & Information Technology, Veer Surendra Sai University of Technology (VSSUT), Burla 768018, Odisha, India
b
Department of Computer Application, Veer Surendra Sai University of Technology (VSSUT), Burla 768018, Odisha, India
Received 19 April 2015; revised 3 December 2015; accepted 19 January 2016
KEYWORDS FCM; K-means; Elicit TLBO; TLBO; PSO; IPSO
Abstract Since its inception, Fuzzy c-means (FCM) technique has been widely used in data clus-tering. The advantages of FCM such as balancing of individual number of cluster points, drifting of small cluster centers to large neighboring cluster centers, and presence of fuzzy factor, make it more popular. However, early trapping at local minima and high sensitivity to the cluster center initial-ization are the major limitations of FCM. In this paper, a novel Elicit Teaching learning based opti-mization (ETLBO) approach has been incorporated with the Fuzzy c-means clustering algorithm to obtain the improved fitness values of the cluster centers. The simulation results of the proposed method have been compared with some other existing methods such as GA, PSO and IPSO. Exper-imental results show that the proposed approach is superior to the other methods in terms of their fitness value calculations.
Ó2016 Faculty of Engineering, Ain Shams University. Production and hosting by Elsevier B.V. This is an open access article under the CC BY-NC-ND license (http://creativecommons.org/licenses/by-nc-nd/4.0/).
1. Introduction
Clustering is an unsupervised pattern recognition technique used for partitioning the untrained data into various clusters which results in the high degree of similarity in the similar clusters and high degree of dissimilarity in case of dissimilar
clusters [1]. In general, there exist two groups of clustering namely hierarchical and partitioning. The first method works in a nested hierarchy fashion by taking an input and producing the corresponding output. On the other hand, the second clus-tering method is based on the objective function for partition-ing the input into a set of fixed number of clusters to produce the output. This clustering process initiates with a random cluster partition and progressively refines the partition for the optimization of the objective function value. Again, the partitioning clustering can be grouped into either hard clusters or soft clusters. FCM is a soft partitioned clustering method introduced by Dunn [2,3] and Bezdek [4]. The first fuzzy concept was introduced by Lotfi Zadeh[5] and thereafter, a number of fuzzy algorithms such as RCFCM [6], BCFCM * Corresponding author. Tel.: +91 9439400784.
E-mail address:[email protected](J. Nayak). Peer review under responsibility of Ain Shams University.
Production and hosting by Elsevier
Ain Shams University
Ain Shams Engineering Journal
www.elsevier.com/locate/asej[7], S-FCM[8], KFCM-S1 & S2 [9], MS-FCM [10], SIFCM [11], GKFCM[12], MFCM[13], Recursive FCM[14], Possi-bilistic FCM[15], GRFCM[16], and Type-2 FCM[17]were implemented in clustering and other application areas. But among all these developed algorithms, FCM is quite popular due to its fuzziness factor in the membership of cluster objects. Although, several attempts[18–22] have been made to solve the problem of cluster size sensitivity, a very few have been successful in coming close toward the optimal cluster center and achieving the best fitness values of the cluster. Some of the other researchers[23,24] have also developed few FCM-based meta-heuristic algorithms. Naik et al.[25]have proposed a TLBO based FCM technique and compared the results with hard c-means algorithm. However, in their paper, emphasis has only been laid upon the initialization of the cluster centers which is insufficient for optimal cluster centers.
Teaching Learning based Optimization is a recently devel-oped metaheuristic proposed by Rao et al. [26,27] inspired by the teaching and learning process of a teacher and students or learners. Unlike other optimization techniques, it does not require any controlling parameter setting which makes the algorithm simple and effective to use in real life domains. Since its inception, it has been a key interest among a wide range of researchers and has been successfully implemented in various application areas including Mechanical Design Optimization [28], Optimal Power flow [29], Multi-objective optimization [30], Hydro Thermal Scheduling [31], Power System [32,33], Machining processes[34], Scheduling of Thermal Power Sys-tems [35], Power Quality [36] and global optimization [37,38]. Due to its easy implementation and less design issues, it attracts researchers to use it in various application areas. Inspired by this, TLBO has been hybridized with the efficient FCM algorithm to find out the best fitness value as well as the optimal cluster centers.
The major contribution of this paper relies on three phases: (1) first we have proposed the hybrid FCM-TLBO technique, (2) secondly, an improved version of TLBO called Elicit TLBO has been hybridized with FCM, and (3) thirdly, The perfor-mance of the proposed method has been compared with other existing methods such as GA, PSO, IPSO and with the popular hard clustering method called K-means. Also, some elabora-tive and effecelabora-tive performance comparisons have been drawn between the FCM andK-means techniques to show the supe-riority of the proposed method over the others. The rest of the paper is organized as follows. Section 2 outlines the back-ground studies such as K-means, FCM, TLBO and Elicit TLBO. Section3describes our proposed work and the simula-tion results along with the performance comparisons of vari-ous methods outlines in Section 4. Section 5 elaborates various cluster validation indices to show the effectiveness of the proposed method as compared to others. Section 6 describes the statistical significance of the proposed method and performance comparison with others. Section7gives the concluding remarks with some future directions.
2. Background study
2.1.K-means algorithm
The k-means algorithm [39,40] receives k number of input parameters and performs the partition on a set of nobjects
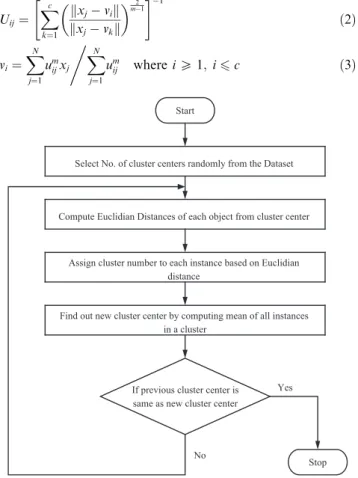
in the multidimensional space. The method ofk-means starts with the random selection ofknumber of objects and is repre-sented as cluster means (cluster centers). Depending on the dis-tance metric between the object and the cluster mean, for each of the residual objects, a similar object is being assigned which helps to compute a new cluster mean. This process is continued till the convergence of criterion function. Hence, k-means is able to find the best cluster center points in the space. The general steps can be realized inFig. 1.
2.2. Fuzzy c-means (FCM) algorithm
The FCM algorithm makes use of fuzzy membership function which is used to assign a degree of membership for each class. FCM is able to form new clusters having close membership val-ues to existing classes of the data points[41]. The technique of FCM relies on three basic operators such as fuzzy membership function, partition matrix and the objective function[42]. FCM is used to partition a set ofNclusters through minimization of the objective function[43]w.r.t. the fuzzy partition matrix.
JðU;VÞ ¼X C i¼1 XN j¼1 um ijjjxjvijj2 ð1Þ
wherexjdenotes thej th
cluster point, andvirepresents thei th cluster center.
ui,jis the membership value ofxjw.r.t. clusteri.mdenotes the fuzzy controlling parameter i.e. for the value 1, it will tend to hard partition and for the value of1, it tends toward the complete fuzziness.k krepresents the norm function.
The iterative method is used to compute the membership function and cluster center as follows:
Uij¼ Xc k¼1 kxjvik kxjvkk 2 m1 " #1 ð2Þ vi¼ XN j¼1 um ijxj XN j¼1 um ij , whereiP1;i6c ð3Þ
If previous cluster center is same as new cluster center
Start
Select No. of cluster centers randomly from the Dataset
Compute Euclidian Distances of each object from cluster center
Assign cluster number to each instance based on Euclidian distance
Find out new cluster center by computing mean of all instances in a cluster
Stop Yes
No
The steps of FCM algorithm are as follows: 1. Initialize the number of cluster centersv.
2. Select an inner product metric Euclidean norm and the weighting metric (fuzziness).
3. CalculateU(partition matrix) using Eq.(2). 4. Update the fuzzy cluster centers using Eq.(3). 5. Calculate the new objective functionJusing Eq.(1). 6. IfjjJnewJoldjj62then stop.
7. Else repeat steps 3–5.
2.3. Teaching learning based optimization (TLBO)
It is a new population based metaheuristic inspired by the teaching and learning process in a teaching environment. The main basis of the algorithm relies on two ideas: (a) the effects of teaching of a teacher upon a student and (b) gaining knowledge through the interaction of the student with his or her friends. In this algorithm, group of students are considered as population, different subjects offered [44] are the design parameters of the algorithm, results of the student are the fit-ness value and the teacher is the best solution in the intact pop-ulation. The algorithm has two consequent phases such as Teaching phase and Learning phase.
2.3.1. Phase-I (Teaching)
The teaching phase simulates the behavior of the student through the teacher. A teacher always tries to give his/her best in the class to bring all the students up to his/her own level of knowledge. But, practically it may not be possible due to the knowledge difference between the students in terms of average, good and best. So, for an overall calculation of level of knowl-edge in the classroom, the mean can be considered which is a random procedure and depends on various external factors.
2.3.2. Phase-II (Learning)
The learning phase simulates the behavior of the student through the interaction or discussion of his or her knowledge with other students or friends in the class. He/she may acquire some knowledge on a concerned subject from his/her friends by the method of discussion or interaction. A student can also acquire some new knowledge from his friends if his friends have more expertise than him on the concerned subject. The algorithm of the TLBO can be realized through the following steps:
Teacher Phase
Step-1.Initialize the population of studentsX(candidate solutions) randomly.
Step-2.Calculate the mean of each student in the population (Xmean).
Step-3.Compute the fitness of each student in the population and find out the best solution (Xteacher)
Step-4.Generate new population by modifying the solutions in initial population based on best solution (teacher), mean of students in the population (mean) and teaching factorTF. fori= 1:1: nos. of weight-sets in the populationX
TF= round(1 + rand(0, 1)(21))
Xi(new) =Xi(old) + rand(1)(XteacherTF*Xmean)
End for Learner Phase
Step-5.Update population of studentsXby comparing fitness of students in old populationXand new populationXnew.
fori= 1:1: nos. of weight-sets in the populationX
if(Fitness ofXi(old) < Fitness ofXi(new)) Xi=Xi(new)
Else
Xi=Xi(old) end if
end for
Step-6.Randomly select two weight-sets from population and improvise them.
Selectithandjthweight-setsX
iandXjrandomly from population.
if (fitness ofXi< fitness ofXj) Xi(new) =Xi(old) + rand(1)(XjXi) Else
Xj(new) =Xj(old) + rand(1)(XiXj) If end
Step-7.Check for termination criteria (if maximum no. of iteration is reached OR the improvement in cluster centers is saturated). If reached, stop. Else go to step-2.
Step-8.Exit
2.4. Elicit TLBO
Rao et al.[45]introduced the concept of elitism in TLBO and they proposed the elicit TLBO to solve the constraint opti-mization problem. Later on, Rajasekhar et al.[46]have intro-duced the elitism concept in a different manner by integrating opposition based optimization with TLBO. However, the elit-ism term is very popular as it is being frequently used in several population based evolutionary algorithms. The concept of elit-ism is the modification of the best solution by replacing the worst solution during the iteration. As in the TLBO algorithm, mean value of the learners is considered, so there may be a pos-sibility of existence of duplicate values after the replacement of elite solution with the worst solution. During each generation of the TLBO algorithm, the solutions are modified in both the phases (Phase-I & II) and the duplicate solutions are modified in a random fashion. Hence, for the elicit TLBO, we have con-sidered twice of both as the population size and number of population plus the number of function evaluations required at duplicate value elimination step, i.e. [{2 *X* no. of genera-tions} + {no. of function evaluations needed for duplicate value elimination}], whereXis the size of the population. 3. Proposed approach
In this section, an Elicit TLBO based Fuzzy c-means clustering algorithm (ETLBO-FCM) has been proposed. From an opti-mization problem point of view, the overall deviation among the cluster partitions is to be minimized. It can be computed through the distance calculation among the total distance between the clusters and their respective cluster center (the objective function value of FCM algorithm). In Eq.(1), the
value of the fuzzy controlling parameter or the weighting fac-tor m has been set to 2. The candidate solutions are repre-sented through the fuzzy matrixU(km) in the population, where every element in the matrix indicates the degree of belongingness of the data items to the kth clusters. As per the size of the population, the fuzzy partition matrix is gener-ated randomly. The distance between the data point and the centroid is calculated to evaluate the center of each of the clus-ters. After evaluating the population, mean of the clusters and fitness of each cluster are computed. From the fitness value, the best value is assigned as the best teacher. Then, the other solutions are computed as per the best teacher and are ranked based on the best one. As per the fitness values, the students are assigned to the teachers. The population of the cluster cen-ters (learners) is initialized randomly. After the evaluation of initial population, worst solutions will be replaced by the elicit solution. The elite solutions of every cluster group are to be considered and through the elitism concept, the best entity can be obtained through the generation of solutions, for which there are less chances of losing the best solution in the popula-tion. The mean of the clusters is calculated along with the fit-ness of each cluster center using Eq.(4):
FðCiÞ ¼ k Pm j¼1 Pn r¼1ðorci;jÞ2 þd ð 4Þ
whereCiis theithcandidate solution in the populationP,F(Ci) is the fitness of the solutionCi,nis the number of instance in the dataset,oris therthinstance in the dataset,mis the number of cluster centers inCi,ci,jis thejthcluster center ofith(Ci) solution fromP,kis a positive constant, anddis a small valued constant. In Eq.(4),Fis a function to evaluate the generalized solu-tion called fitness funcsolu-tion.orci,jis the Euclidean distance from the objector toci,j (cluster center). The main objective of using Eq.(4)is to minimize the intra cluster distance, i.e. when the intra cluster distance is low, the value of the objective function will be high.
Depending upon the best solution in the population, mean of the students and the teaching quality of the teacher, new population is created. At each iteration, based on the compar-ison between the old and new clusters, the population is updated. The cluster centers are ranked based on their fitness values and accordingly the best cluster center can be obtained which will be the cluster center for fuzzy c-means algorithm.
Pseudo-code of the Proposed ETLBO-FCM algorithm
1. Initialize the population of Cluster centersP= {C1,C2,. . .,
CN} (candidate solutions) randomly, whereCi= {ci,1,ci,2,. . .,
ci,m},Nis the size of the population and m is the no. of clusters in
the population.
2. Calculate the mean of cluster in the population (Pmean).
3. Find out the elicit solution.
4. Compute the fitness of each cluster centerCiin the population by using Eq.(4)and find out the best solution (Pteacher)
5. Generate new population by modifying the solutions in initial population based on best solution (Pteacher), mean of
cluster in the population (Pmean) and teaching factorTF.
fori= 1:1: nos. of weight-sets in the populationP TF= round(1 + rand(0, 1)(21))
Pi(new) =Pi(old) + rand(1)(PteacherTF*Pmean)
End for
6. Update population of clusterPby comparing fitness of cluster in old populationPand new populationPnew.
fori= 1:1: nos. of weight-sets in the populationP
if(Fitness ofPi(old) < Fitness ofPi(new)) Pi=Pi(new)
Else
Pi=Pi(old) end if
end for
7. Randomly select two weight-sets from population and improvise them.
Selectithandjthweight-setsP
iandPjrandomly from population. If(fitness ofPi< fitness ofPj)
Pi(new) =Pi(old) + rand(1)(PjPi) Else
Pj(new) =Pj(old) + rand(1)(PiPj) If end
8. Substitute the worst solutions with elite solutions in the population.
9. Check for termination criteria. If reached stop. Else go to step-3.
10. Exit
11. Rank the cluster centers based on their fitness, obtain the best cluster center.
12. Initialize the FCM center with position of the best cluster center.
13. Then using this center, iterate the FCM algorithm. Repeat
Update the membership matrix by Eq.(2) Refine the cluster centers by Eq.(3), Dountil it meets the convergence criteria 14. Exit
In the above algorithm,Pis the population of cluster centers,
Pmeanis the mean of the clusters in the population andF(Ci) is the fitness of the cluster center. Among all the generated teach-ers, (Cteacher) is the best teacher in the population. ‘rand’ is the randomly generated number between the interval [0, 1]. A tea-cher may give his/her maximum efforts to improve the knowl-edge level of the students, but the students will be able to gain knowledge only through the quality teaching by the teacher and the quality of students present in the classroom. Owing to this fact, the mean value will be required between teacher’s result and the students’ mean result. AsTFis not a TLBO algo-rithmic parameter and rather is a function to decide the mean, so its value changes (either 1 or 2) and is randomly decided by the expression TF= round(1 + rand(0, 1)(21)) with the chance of equal probability. As both ‘rand and TF’ are not TLBO algorithmic specific parameters, their values are not to be tuned as in case of the mutation and crossover parame-ters in GA, the value of the inertia weight in PSO, etc. Both ‘rand and TF’ are generated randomly during the run of the program and TLBO does not require controlling any major parameters. This property of TLBO makes it more popular than the other evolutionary population based algorithms.
4. Experimental analysis and simulation results
In this section, the performance of the proposed ETLBO-FCM has been analyzed with some of the other existing techniques.
The main aim of this paper is to expose the quality of cluster-ing through the proposed ETLBO with fuzzy c-means algo-rithm. But to correctly classify and show the superiority of the results of the proposed approach over the other approaches, an extensive experimental work has been done with fourteen datasets. Out of fourteen (Table 1), eleven real datasets have been considered from UCI machine learning repository [47] and three artificial (synthetic) datasets have been considered for testing all the clustering approaches in our experiment. The developing environment for the proposed method is MATLAB 9.0 on a system with an Intel Core Duo CPU T5800, 2 GHz processor, 2 GB RAM and Microsoft Windows-2007 OS. For the individual experiments and result comparison, this section has been divided into two subsections.
4.1. Experiment-1
In this section, the traditional hard clustering algorithm such asK-means technique has been considered and compared with other three techniques such as GA-K-means, PSO-K-means, IPSO-K-means, TLBO-K-means and ETLBO-K-means. For the purpose of fitness calculation, Eq. (4)has been used for all the methods. For the simulation, the value ofk has been set to 50 anddis set to 0.1. As the selected value fork (basi-cally a positive constant) may not affect the clustering algo-rithm performance, so the value 50 is adopted only for the comparison of results in the paper[48]. By setting the same val-ues for bothkandd, better results have been achieved in this paper. In IPSO-K-means algorithm, the acceleration coeffi-cientsc1andc2are set to 1.4 for early convergence. The value of inertia weight is set between 1.8 and 2. The detailed algorith-mic implementation has been elaborated by Nayak et al.[49]. In case of TLBO, the teaching factor is set to 1 or 2 with equal probability. In case of ETLBO-K-means, initially the Elicit TLBO steps are set to obtain the best solutions in the popula-tion. Then from the best chosen solutions in the population, the fitness has been calculated. Also, the mean of the cluster center will be computed and based on the mean value, the best fitness will be considered. For each of the algorithm, 50
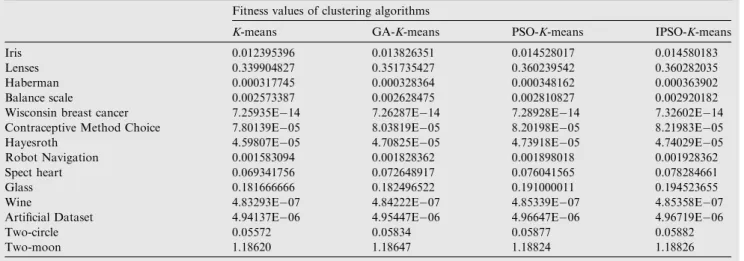
num-ber of independent runs have been performed and resulting values of 1400 number of iterations are shown inTables 2–5. InTable 2, the comparison of the fitness values between the methods such asK-Means, GA-K-means, PSO-K-means [48] and IPSO-K-means is shown. Here the superiority stands for the IPSO-K-means method over others. InTable 3, the com-parison between the TLBO-K-means and ETLBO-K-means is shown and inFig. 2the result of the clusters for artificial data-sets has been indicated. In all the datadata-sets, ETLBO-K-means performs better than TLBO-K-means except for the Haber-man, Balance scale and Glass datasets.
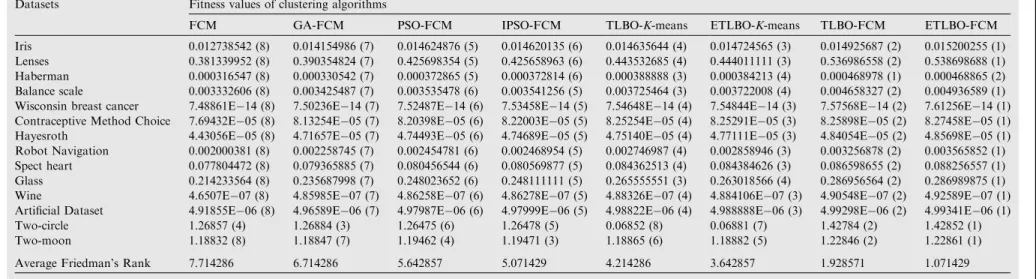
4.2. Experiment-2
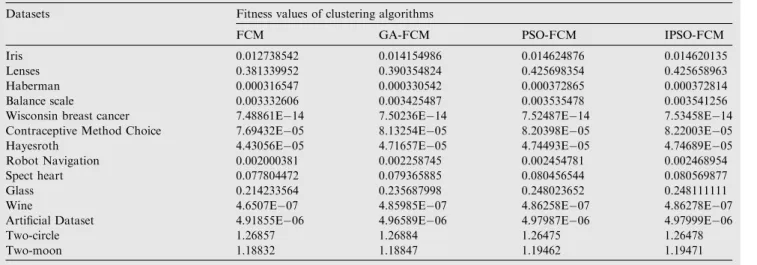
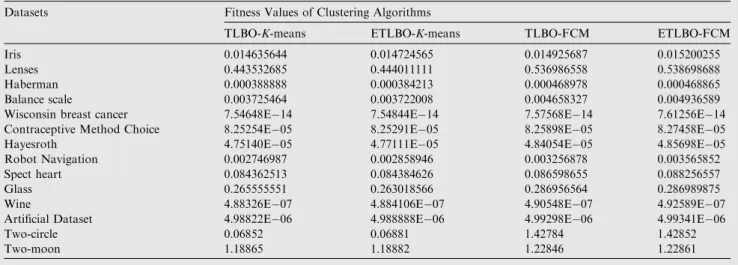
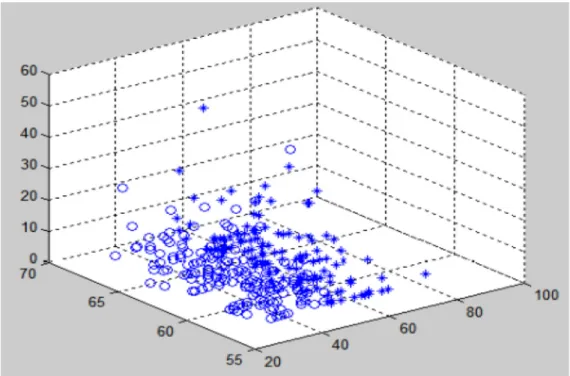
This section deals with the performance comparison among FCM, GA-FCM, PSO-FCM, IPSO-FCM, TLBO-FCM along with the proposed ETLBO. During the ETLBO implementa-tion, the initial population and the design variables such as teaching factor and number of generations are initialized. After the evaluation of the initial population, the elite solu-tions are considered for the next phase mean calculation of the clusters. In case of duplicate values, the elite solutions have been replaced with the worst solutions. The cluster centers are randomly initialized. The teaching factor is set to 1 or 2 having equal probability and size of the population is 50. The value of the fuzzy coefficient (m) is set to 2. For each of the algorithms, the mean results of 1400 number of iterations have been shown inTables 4 and 5, comparing all the existing well known meth-ods with the proposed method. In case of all the fourteen data-sets, the proposed ETLBO-FCM performs marginally better than the other methods of FCM. However, only in case of Haberman natural dataset, the value of TLBO-FCM is slightly better than ETLBO-FCM. For more rigorous experimenta-tion, the two most unconventional synthetic datasets such as two-circle and two-moon, having 300 and 400 number of instances with two attributes have been considered. The simu-lation results obtained from the proposed method along with the K-means results have been compared which can be depicted in Figs. 6–8. In Fig. 6, the clusters obtained by ETLBO-FCM & TLBO-FCM are well separated in the two circles than those of ETLBO-K-means and TLBO-K-means. Although the dataset is spherical and globular in nature, still the proposed hybridization method is able to classify the clus-ters within the boundary (Fig. 7). In both the figures, it can be clearly concluded that as the considered synthetic datasets are elongated in nature, soK-means method is unable to identify the clusters in a speculated fashion. In Fig. 8, the first row shows the results ofK-means, TLBO-K-means and
ETLBO-K-means on another synthetic dataset two-moon dataset and the second row shows the results of FCM, TLBO-FCM and ETLBO-FCM respectively. In the 2nd row, the good clusters has been shown in black and red color. They are well separated than the clusters obtained byK-means methods. For calcula-tion of computacalcula-tional complexity, the fitness values have been taken into measure. Although, many researchers have shown the complexity in terms of number of iterations required to run the algorithm or less number of iterations; in this work we have considered the fitness value of the algorithms, as the variations on the performance result along with the number of iterations are dependent on the number of iterative loops in that algorithm. Also, in various optimization algorithms Table 1 Dataset information
Datasets No. of patterns No. of clusters No. of attributes Iris 150 3 4 Lenses 24 3 4 Haberman 306 2 3 Balance scale 625 3 4 Wisconsin breast cancer 699 2 10 Contraceptive Method Choice 1473 3 9 Hayesroth 132 3 5 Robot Navigation 5456 4 2 Spect heart 80 2 22 Glass 214 6 9 Wine 178 3 13 Artificial Dataset 600 3 2 Two-circle 300 2 2 Two-moon 400 2 2
there are number of dependent parameters. GA involves some basic operations such as mutation and crossover; PSO involves position, velocity of the particle; and IPSO takes the value of inertia weight, etc. And more importantly, as all the above-mentioned algorithms are stochastic in nature, the perfor-mance results during each run may not match. Therefore, the mean values of the fitness values over 50 number of runs in every case have been considered for efficiency of the pro-posed fuzzy based algorithm over others. The result of some other considered real datasets such as Iris, Haberman and Hayesroth has been shown inFigs. 3–5respectively.
5. Result analysis and cluster validation
This section explains some more detailed rigorous ways of result analysis and for statistical validity, various clustering validation indices have been calculated. Clustering validation is an important step in cluster analysis due to the computations of clustering results for finding the best partition which may fit the considered dataset. The main objective of the clustering method is to find out the important cluster groups in the
dataset based on the property of either similarity or dissimilar-ity. i.e. similar groups will be more closer on the basis of high degree of similarity. Cluster validity is the computation of the resulting performance of a clustering algorithm and its quality cluster partitioning.
5.1. Rand statistics, Jaccard coefficient, Fowlkes and Mallows index and Huberts statistics
In general, there are three approaches[50]for computation of cluster validity: (a) based on external criteria, (b) based on internal criteria, and (c) based on relative criteria. Due to mas-sive use and depending on the suitability of K-means algo-rithm, we have considered the external criteria for cluster index calculations. According to this criteria, all the results of a clustering algorithm will be computed depending on a pre-fixed structure and then applied on the dataset, which helps to guess about structure of the clustering.
In external criteria, the basic aim is to test whether the data points are randomized or not. The analysis is based on the principle of null hypothesis. The hypothesis is Table 2 Performance comparison ofK-means with the other clustering methods
Fitness values of clustering algorithms
K-means GA-K-means PSO-K-means IPSO-K-means
Iris 0.012395396 0.013826351 0.014528017 0.014580183
Lenses 0.339904827 0.351735427 0.360239542 0.360282035
Haberman 0.000317745 0.000328364 0.000348162 0.000363902
Balance scale 0.002573387 0.002628475 0.002810827 0.002920182
Wisconsin breast cancer 7.25935E14 7.26287E14 7.28928E14 7.32602E14
Contraceptive Method Choice 7.80139E05 8.03819E05 8.20198E05 8.21983E05
Hayesroth 4.59807E05 4.70825E05 4.73918E05 4.74029E05
Robot Navigation 0.001583094 0.001828362 0.001898018 0.001928362
Spect heart 0.069341756 0.072648917 0.076041565 0.078284661
Glass 0.181666666 0.182496522 0.191000011 0.194523655
Wine 4.83293E07 4.84222E07 4.85339E07 4.85358E07
Artificial Dataset 4.94137E06 4.95447E06 4.96647E06 4.96719E06
Two-circle 0.05572 0.05834 0.05877 0.05882
Two-moon 1.18620 1.18647 1.18824 1.18826
Table 3 Performance comparison betweenK-means, TLBO-K-means, ETLBO-K-means method
Datasets Fitness values of clustering algorithms
K-means TLBO-K-means ETLBO-K-means
Iris 0.012395396 0.014635644 0.014724565
Lenses 0.339904827 0.443532685 0.444011111
Haberman 0.000317745 0.000388888 0.000384213
Balance scale 0.002573387 0.003725464 0.003722008
Wisconsin breast cancer 7.25935E14 7.54648E14 7.54844E14
Contraceptive Method Choice 7.80139E05 8.25254E05 8.25291E05
Hayesroth 4.59807E05 4.75140E05 4.77111E05
Robot Navigation 0.001583094 0.002746987 0.002858946
Spect heart 0.069341756 0.084362513 0.084384626
Glass 0.181666666 0.265555551 0.263018566
Wine 4.83293E07 4.88326E07 4.884106E07
Artificial Dataset 4.94137E06 4.98822E06 4.98888E06
Two-circle 0.05572 0.06852 0.06881
realized as a random structure of the dataset. For testing the said hypothesis, Monte Carlo method has been used, which is used to compute the probability density function. In this paper, we have considered the comparison of proximity matrix PM to the partition P. Let us have some following assumptions:
Xi: Datasets.
HS: Null Hypothesis.
C= {C1,C2,C3,. . .,Cm} is a structure of the cluster in the dataset.
P= {P1,P2,P3,. . .,Pk} is the partition of data.
q: the defined validity index.
qi: defined validity index forPandCi.
Two points (xa,xb) from the datasets have been considered from the dataset by taking the following distributed assump-tions into consideration:
Group-1: If bothxaandxbmove to same cluster groups of
Pand same cluster groups ofC.
Group-2: If the clusters move to same cluster groups ofC, but different groups toP.
Group-3: If the clusters move to different groups ofC, but same groups toP.
Group-4: If bothxaandxbmove to different cluster groups ofPand different cluster groups ofC.
Now, let us assign some variablesG1,G2,G3,G4to the four groups Group-1, Group-2, Group-3 and Group-4 respectively. The sum ofG1,G2,G3,G4isMand it is the maximum number of all possible pairs in the dataset.
IfNis the size of the dataset, then the value ofMwill beN
(N1)/2. There are four statistics[51]namely Rand statistics (R), Jaccard Coefficient (J), Fowlkes and Mallows Index (FM) and Huberts statistics (C). The values of these statistics have been evaluated as per the following equations:
Figure 2 Clusters on artificial dataset
Table 4 Performance comparison of FCM with the other clustering methods
Datasets Fitness values of clustering algorithms
FCM GA-FCM PSO-FCM IPSO-FCM
Iris 0.012738542 0.014154986 0.014624876 0.014620135
Lenses 0.381339952 0.390354824 0.425698354 0.425658963
Haberman 0.000316547 0.000330542 0.000372865 0.000372814
Balance scale 0.003332606 0.003425487 0.003535478 0.003541256
Wisconsin breast cancer 7.48861E14 7.50236E14 7.52487E14 7.53458E14
Contraceptive Method Choice 7.69432E05 8.13254E05 8.20398E05 8.22003E05
Hayesroth 4.43056E05 4.71657E05 4.74493E05 4.74689E05
Robot Navigation 0.002000381 0.002258745 0.002454781 0.002468954
Spect heart 0.077804472 0.079365885 0.080456544 0.080569877
Glass 0.214233564 0.235687998 0.248023652 0.248111111
Wine 4.6507E07 4.85985E07 4.86258E07 4.86278E07
Artificial Dataset 4.91855E06 4.96589E06 4.97987E06 4.97999E06
Two-circle 1.26857 1.26884 1.26475 1.26478
R¼ ðG1þG4Þ=M ð5Þ J¼G1=G1þG2þG3 ð6Þ FM¼ ffiffiffiffiffiffiffiffiffiffiffiffiffiffiffiffiffiffiffiffiffiffiffiffiffiffiffiffiffiffiffiffiffiffiffiffiffiffi G1 G1þG2 G1 G1þG3 r ð7Þ C¼ ð1=MÞX N1 i¼1 XN j¼iþ1 Xði;jÞ Yði;jÞ ð8Þ
whereXandYare the matrices andi,jare the respective ele-ments of the matrices.
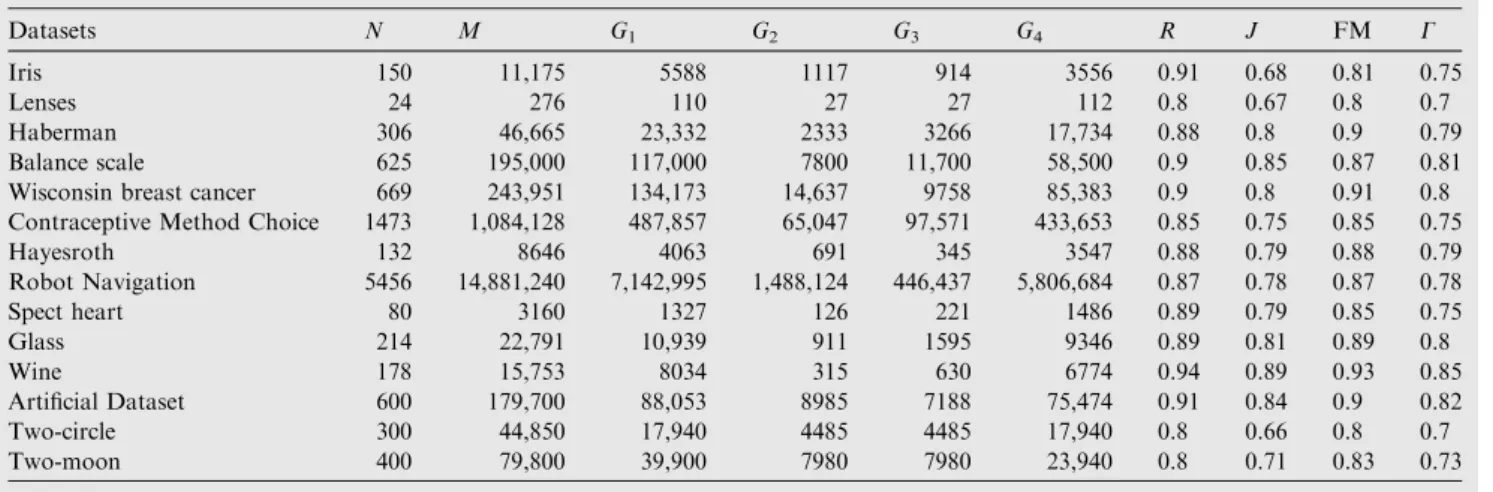
Now, we have calculated the values of the indicesR,J, FM andCas per Eqs.(5)–(8)respectively. All the index values for fourteen datasets have been mentioned inTable 6.
Initially the percentage of clusters for four groups from the dataset is chosen as per each run. For example, suppose con-sider the case of Iris dataset. It has 150 number of patterns having 3 number of clusters and 4 number of attributes. Then
G1+G2+G3+G4=Mis computed which is the maximum
number of all pairs in the dataset (M=N(N1)/2 as 11,175 whereNis the total number of points in the dataset). So, dis-tributingMpatterns in four groups (approx.) such as 50% in
G1(5588 from 11,175), 10% inG2(1117 from 11,175), 9% in
G3(914 from 11,175) and 31% inG4(3556 from 11,175). By using Eqs. (5)–(8)we have computed the respective values of
R,J, FM andCas 0.91, 0.68, 0.81 and 0.75. Then for the Iris datasets, 100 numbers of random vectors (Rv) for each set are generated through the uniform distribution process. The K -means algorithm has been run for 100 times (fori= 100) to describe the cluster centers. For each instance, the new values such asRi,Ji, FMiandCiare calculated. In our experiment, the significance level (q) has been set to 0.06, that means (1q) *Rvis (10.06) * 100 = 96. So, based on that more than 96 values ofRi,Ji, FMiandCiare compared withR,J, FM and Cand found smaller which leads to reject the null hypothesis. In case of all the considered datasets, similar pro-cedure has been followed.
Table 5 Performance comparison between TLBO-K-means, ETLBO-K-means, TLBO-FCM and ETLBO-FCM methods
Datasets Fitness Values of Clustering Algorithms
TLBO-K-means ETLBO-K-means TLBO-FCM ETLBO-FCM
Iris 0.014635644 0.014724565 0.014925687 0.015200255
Lenses 0.443532685 0.444011111 0.536986558 0.538698688
Haberman 0.000388888 0.000384213 0.000468978 0.000468865
Balance scale 0.003725464 0.003722008 0.004658327 0.004936589
Wisconsin breast cancer 7.54648E14 7.54844E14 7.57568E14 7.61256E14
Contraceptive Method Choice 8.25254E05 8.25291E05 8.25898E05 8.27458E05
Hayesroth 4.75140E05 4.77111E05 4.84054E05 4.85698E05
Robot Navigation 0.002746987 0.002858946 0.003256878 0.003565852
Spect heart 0.084362513 0.084384626 0.086598655 0.088256557
Glass 0.265555551 0.263018566 0.286956564 0.286989875
Wine 4.88326E07 4.884106E07 4.90548E07 4.92589E07
Artificial Dataset 4.98822E06 4.988888E06 4.99298E06 4.99341E06
Two-circle 0.06852 0.06881 1.42784 1.42852
Two-moon 1.18865 1.18882 1.22846 1.22861
5.2. XB index
This is one of the suitable and popular validity indexing methods for fuzzy clustering. It involves the membership values and the dataset. XB (Xie-Beni index)[52]is known as compactness and separation validity function, which involves the Fuzzy Deviation (FD) of the clusters. For a dataset
X= {xj,j= 1, 2, 3,. . .,n}, the fuzzy deviation can be realized in Eq.(9).
distij¼uijjjxjvijj ð9Þ
where {vi,i= 1, 2,. . .,nc} is the cluster center of each cluster,
uijis the membership value of thej th
data point which belongs to clusterianddistijis the distance betweenxjand the weighted cluster center by the fuzzy membership of thejth data point which belongs to clusteri.
The variation of the clusterican be defined as in Eq.(10):
p¼ ðri=niÞ ð10Þ
Figure 4 Clusters on Haberman dataset
where ri is the summation of the square of each individual fuzzy deviation of the data points for the clusteri, p is the
ithcluster compactness and niis the number of points in the cluster belonging to the clusteri.
The minimal distance between the cluster centers is calcu-lated for the separation of fuzzy partition:
distmin¼minjjvivjjj ð11Þ
By using Eq.(11), the minimum distance between the clus-ter cenclus-ters is calculated.
So, the XB index can be computed by using Eq.(12):
XB¼p=Npdistmin ð12Þ
whereNpis the number of data points.
For good clusters (compact and well separated), the value of the XB index must be small. For XB index calculation, seven datasets have been considered for six FCM methods including the proposed method. First, for the Iris dataset, a detailed calculation with all the required values has been com-puted for XB index (Table 7).
Figure 6 Results on the synthetic (non linear) two-circle dataset.
(a)K-means, (b) TLBO-K-means, and (c) ETLBO-K-means
Figure 7 Results on the synthetic (non linear) two-circle dataset. (a) FCM, (b) TLBO-FCM, and (c) ETLBO-FCM
InTable 8, the XB index has been computed for seven data-sets. The index value for the proposed ETLBO-FCM is smaller than the other considered fuzzy methods, which clearly indi-cates the proposed method is able to result good clusters. However, similar procedure can be obtained for other datasets. As for maximum number of real world datasets, the proposed method performs better than others, so ETLBO-FCM has greater capability to produce good clusters as compared to other described fuzzy methods.
6. Proof of statistical significance
In this section, the performance of the proposed method has been compared with the other methods by using Friedman test [53,54]and Holm Test under null hypothesis, in order to prove the proposed method is significantly better in performance than others.
6.1. Friedman test
In Friedman Test, Certain ranks have been assigned to each of the method’s values in each rows, such that the best performed algorithm will have the chance of getting highest rank followed Figure 8 Results on the synthetic (non linear) two-moon dataset. (a)K-means, (b) TLBO-K-means, (c) ETLBO-K-means, (d) FCM, (e) TLBO-FCM, and (f) ETLBO-FCM
Table 6 Various statistical coefficient’s values for all the datasets
Datasets N M G1 G2 G3 G4 R J FM C
Iris 150 11,175 5588 1117 914 3556 0.91 0.68 0.81 0.75
Lenses 24 276 110 27 27 112 0.8 0.67 0.8 0.7
Haberman 306 46,665 23,332 2333 3266 17,734 0.88 0.8 0.9 0.79
Balance scale 625 195,000 117,000 7800 11,700 58,500 0.9 0.85 0.87 0.81
Wisconsin breast cancer 669 243,951 134,173 14,637 9758 85,383 0.9 0.8 0.91 0.8
Contraceptive Method Choice 1473 1,084,128 487,857 65,047 97,571 433,653 0.85 0.75 0.85 0.75
Hayesroth 132 8646 4063 691 345 3547 0.88 0.79 0.88 0.79 Robot Navigation 5456 14,881,240 7,142,995 1,488,124 446,437 5,806,684 0.87 0.78 0.87 0.78 Spect heart 80 3160 1327 126 221 1486 0.89 0.79 0.85 0.75 Glass 214 22,791 10,939 911 1595 9346 0.89 0.81 0.89 0.8 Wine 178 15,753 8034 315 630 6774 0.94 0.89 0.93 0.85 Artificial Dataset 600 179,700 88,053 8985 7188 75,474 0.91 0.84 0.9 0.82 Two-circle 300 44,850 17,940 4485 4485 17,940 0.8 0.66 0.8 0.7 Two-moon 400 79,800 39,900 7980 7980 23,940 0.8 0.71 0.83 0.73
Table 7 XB index calculations for Iris dataset
Methods r p distmin XB
FCM 32.696 2.179 3.07 0.0473 GA-FCM 30.528 2.036 2.89 0.0469 PSO-FCM 27.482 1.832 2.82 0.0433 IPSO-FCM 27.376 1.825 2.86 0.0425 TLBO-FCM 23.937 1.595 2.66 0.0399 ETLBO-FCM 23.402 1.560 2.73 0.0280
by others and the measured dependent variable must be ordi-nal. For the similar cases, the average ranks may be calculated by using Eq.(13)in each of the columns:
Rj¼1=N
X1 i
rij ð13Þ
whererijis the rank of thejthmethods andNis the number of datasets.Table 9indicates the assigned ranks (shown in brack-ets) of each methods on different datasets. The fitness values fromTables 4 and 5of all the fourteen datasets have been con-sidered for ranking purpose in all the cases. Based on the assigned rank values, the average values [R1= 7.714286,
R2= 6.714286, R3= 5.642857, R4= 5.071429, R5= 4.214286, R6= 3.642857, R7= 1.928571, R8= 1.071429] have been calculated for all the eight algorithms.
Let us consider the Null hypothesis, ‘‘H: All the methods are in same rank and hence they are equivalent”, all the algo-rithms are same and so that, the ranks will be equal. Based on the ranksRjof the methods, the Friedman statisticsX2Fis com-puted by using Eq.(14):
X2 F¼12N=mðmþ1Þ X1 j R2 j mðmþ1Þ2 4 " # ð14Þ where X2
F is the Friedman statistics and is distributed with (m1) degree of freedom. The values ofNandmare consid-ered as integer values. Iman and Davenport[55]distributed the statistics with (m1), (m1) (N1) degree of freedom as perF-distribution and developed a better performed Friedman statistics shown in Eq.(15):
FF¼ ðN1ÞXF2=Nðm1Þ X 2
F ð15Þ
The value ofN(no. of datasets) is 14 andX2
Fis 83.98 under the (m1) degree of freedom. As perF-distribution, theFFis computed as 77.87 by placing the values ofX2F,N,m in Eq. (11). The FF value is calculated with the (m1), (m1) (N1) degree of freedom i.e. (8–1), (8–1) (14–1) degree of freedom and the crucial value can be obtained as 2.84, when the value ofais 0.01. As per the above calculations, the critical value is less than the FF statics, so, the null hypothesis is rejected. Hence we can proceed for the Post Hoc analytical test. The density plot with the F value and critical value is shown inFig. 9.
6.2. Holm test
After rejection of the null-hypothesis, the post hoc test has been carried out by using the Holm procedure [56,57] to
compute the performance of each of the methods against the other methods depending on the z-value and p-value. The
z-value is calculated by using Eq. (16) and accordingly, thep-value is computed from the normal distribution table.
Z¼ ffiffiffiffiffiffiffiffiffiffiffiffiffiffiffiffiffiffiffiffiffiffiffiffiffiffiffiffiðRiRjÞ mðmþ1Þ=6N
p ð16Þ
wherezindicates thez-score value.RiandRjare the average rank ofithandjthmethod respectively. The number of methods ismandNis the number of datasets respectively. The methods FCM, GA-FCM, PSO-FCM, IPSO-FCM, TLBO-K-means, ETLBO-K-means, TLBO-FCM are compared with ETLBO-FCM based on z-value, p-value and a/(mi) and are described inTable 10.
By using the Holm test, when we compare the value ofpi witha/(mi), it is observed that, the null hypothesis can be rejected aspiis less thana/(mi) in almost all the cases. How-ever, when the proposed method is compared with TLBO-FCM, the pi value is found to be greater than a/(mi) (Table 8). So, the proposed method is significantly better than FCM, GA-FCM, PSO-FCM, IPSO-FCM, TLBO-K-means and ETLBO-K-means. But, in comparison with TLBO-FCM, the ETLBO-FCM is found better, but not significantly different from TLBO-FCM. Hence, the null-hypothesis is rejected in most of the cases (six out of seven). Hence, the pro-posed method ‘ETLBO-FCM’ is statistically significant and performs quite well on real world bench mark datasets and outperforms the other explained methods.
7. Conclusion and future scope
TLBO is a new metaheuristic that has been applied in various engineering and other diversified applications. Some properties such as zero dependent parameter settings, and easy implemen-tation make it more popular than the other evolutionary pop-ulation based algorithms. Elicit TLBO is a modified TLBO approach where always the best or elite solutions will be taken into consideration and these solutions will also replace the duplicate values in the population. In this paper, a novel elicit Teaching learning based fuzzy clustering has been proposed for effective clustering. The proposed method has been tested with some standard benchmark real datasets as well as artifi-cial datasets. To show the effectiveness as well as performance of the proposed method, a number of other evolutionary and swarm based optimization algorithms have been considered. The results in Tables 2–5 report that the proposed ETLBO-FCM performs better (in case of many) than the other techniques in terms of their fitness values. Normally, due to Table 8 XB index values of seven datasets for all the fuzzy methods
Dataset Methods
FCM GA-FCM PSO-FCM IPSO-FCM TLBO-FCM ETLBO-FCM
Iris 0.0473 0.0469 0.0433 0.0425 0.0399 0.0280
Haberman 4.330 4.312 3.899 3.894 3.602 3.433
Contraceptive Method Choice 3.307 3.269 3.252 2.223 2.092 2.004
Hayesroth 1.061 1.048 0.923 0.910 0.762 0.531
Wine 15.277 13.282 12.777 12.603 11.540 11.212
Artificial Dataset 0.0666 0.0391 0.0190 0.0181 0.0028 0.0011
random selection of initial cluster centers, there may be the possibility of trapping at local minima for traditional cluster-ing algorithms. ETLBO takes the advantage of choosing the elite solutions from the population after the initialization of the population even if the centers are chosen randomly. Also, due to mean value consideration, it helps to avoid the dupli-cate values (if any in the population) through the elite solu-tions. Hence, it can be concluded that being a parameter free algorithm, it performs quite well than the other existing meth-ods in terms of better cluster centers as well as fitness values. As a future work, the application of this algorithm may be integrated in some large multidimensional problems as well as constraint optimization problems. Also, the complexity of the algorithm during the computation of initial population from the random population and replacement of duplicate val-ues with elite values is our next keen interest. Acknowledgments This work is supported by Department of Science & Tech-nology (DST), Ministry of Science & Technology, New Delhi, Govt. of India, under Grant No. DST/INSPIRE Fellowship/2013/585.
Table 9 Friedman’s rank calculation of all the algorithms
Datasets Fitness values of clustering algorithms
FCM GA-FCM PSO-FCM IPSO-FCM TLBO-K-means ETLBO-K-means TLBO-FCM ETLBO-FCM
Iris 0.012738542 (8) 0.014154986 (7) 0.014624876 (5) 0.014620135 (6) 0.014635644 (4) 0.014724565 (3) 0.014925687 (2) 0.015200255 (1) Lenses 0.381339952 (8) 0.390354824 (7) 0.425698354 (5) 0.425658963 (6) 0.443532685 (4) 0.444011111 (3) 0.536986558 (2) 0.538698688 (1) Haberman 0.000316547 (8) 0.000330542 (7) 0.000372865 (5) 0.000372814 (6) 0.000388888 (3) 0.000384213 (4) 0.000468978 (1) 0.000468865 (2) Balance scale 0.003332606 (8) 0.003425487 (7) 0.003535478 (6) 0.003541256 (5) 0.003725464 (3) 0.003722008 (4) 0.004658327 (2) 0.004936589 (1) Wisconsin breast cancer 7.48861E14 (8) 7.50236E14 (7) 7.52487E14 (6) 7.53458E14 (5) 7.54648E14 (4) 7.54844E14 (3) 7.57568E14 (2) 7.61256E14 (1) Contraceptive Method Choice 7.69432E05 (8) 8.13254E05 (7) 8.20398E05 (6) 8.22003E05 (5) 8.25254E05 (4) 8.25291E05 (3) 8.25898E05 (2) 8.27458E05 (1) Hayesroth 4.43056E05 (8) 4.71657E05 (7) 4.74493E05 (6) 4.74689E05 (5) 4.75140E05 (4) 4.77111E05 (3) 4.84054E05 (2) 4.85698E05 (1) Robot Navigation 0.002000381 (8) 0.002258745 (7) 0.002454781 (6) 0.002468954 (5) 0.002746987 (4) 0.002858946 (3) 0.003256878 (2) 0.003565852 (1) Spect heart 0.077804472 (8) 0.079365885 (7) 0.080456544 (6) 0.080569877 (5) 0.084362513 (4) 0.084384626 (3) 0.086598655 (2) 0.088256557 (1) Glass 0.214233564 (8) 0.235687998 (7) 0.248023652 (6) 0.248111111 (5) 0.265555551 (3) 0.263018566 (4) 0.286956564 (2) 0.286989875 (1) Wine 4.6507E07 (8) 4.85985E07 (7) 4.86258E07 (6) 4.86278E07 (5) 4.88326E07 (4) 4.884106E07 (3) 4.90548E07 (2) 4.92589E07 (1) Artificial Dataset 4.91855E06 (8) 4.96589E06 (7) 4.97987E06 (6) 4.97999E06 (5) 4.98822E06 (4) 4.988888E06 (3) 4.99298E06 (2) 4.99341E06 (1)
Two-circle 1.26857 (4) 1.26884 (3) 1.26475 (6) 1.26478 (5) 0.06852 (8) 0.06881 (7) 1.42784 (2) 1.42852 (1)
Two-moon 1.18832 (8) 1.18847 (7) 1.19462 (4) 1.19471 (3) 1.18865 (6) 1.18882 (5) 1.22846 (2) 1.22861 (1)
Average Friedman’s Rank 7.714286 6.714286 5.642857 5.071429 4.214286 3.642857 1.928571 1.071429
Figure 9 Density plot Table 10 Result of Holm procedure i Methods z -Values p -Values a / ( m i ) 1 ETLBO-FCM : FCM 7.181 0 0.00142 2 ETLBO-FCM : GA-FCM 6.1 0 0.00166 3 ETLBO-FCM : PSO-FCM 4.942 3.87E 07 0.002 4 ETLBO-FCM : IPSO-FCM 4.324 0.000008 0.0025 5 ETLBO-FCM : TLBO-K -means 3.397 0.000341 0.0033 6 ETLBO-FCM : ETLBO-K -means 2.779 0.002726 0.005 7 ETLBO-FCM : TLBO-FCM 0.926 0.177223 0.01 hybrid elicit teaching learning based optimization 13 cite this article in press as: Nayak J et al., A hybrid elicit teaching learn ing based optimization with fu zzy c-me ans (ETLBO -FCM) algorithm fo r data clustering, S hams Eng J (2016), http://dx.doi.o rg/10.1016/ j.asej.2016.01.010
The authors would like to thank the editor and reviewers for their valuable and inspiring comments, which help to improve the quality of the paper.
References
[1] Nayak J, Nanda M, Nayak K, Naik B, Behera HS. An improved firefly fuzzy C-means (FAFCM) algorithm for clustering real world data sets. Smart Innov Syst Technol 2014;27:339–48.http:// dx.doi.org/10.1007/978-3-319-07353-8_40.
[2]Dunn J. A fuzzy relative of the ISODATA process and its use in detecting compact well separated clusters. J Cybern 1974;3:32–57. [3]Dunn J. Well separated clusters and optimal fuzzy partitions. J
Cybern 1974;4:95–104.
[4]Bezdek JC. Pattern recognition with fuzzy objective function algorithms. New York: Plenum Press; 1981.
[5] Zadeh LA. Fuzzy sets. Inf Control 1965;8(3):338–53.http://dx. doi.org/10.1016/S0019-9958(65)90241-X, ISSN 0019-9958. [6]Wei LM, Xie WX. Rival checked fuzzy c-means algorithm. Acta
Electron Sinica 2000;28(7):63–6 [in Chinese].
[7]Ahmed MN, Yamany SM, Mohamed N, Farag AA, Moriarty T. A modified fuzzy c-means algorithm for bias field estimation and segmentation of MRI data. IEEE Trans Med Imag 2002;21:193–9. [8]Fan JL, Zhen WZ, Xie WX. Suppressed fuzzy c-means clustering
algorithm. Pattern Recogn Lett 2003;24:1607–12.
[9]Chen SC, Zhang DQ. Robust image segmentation using FCM with spatial constrains based on new kernel-induced distance measure. IEEE Trans Syst Man Cybern B 2004;34:1907–16. [10]Hung WL, Yang MS, Chen DH. Parameter selection for
suppressed fuzzy c-means with an application to MRI segmenta-tion. Pattern Recogn Lett 2006;27:424–38.
[11]Chuang KS, Tzeng HL, Chen S, Wu J, Chen TJ. Fuzzy c-means clustering with spatial information for image segmentation. Comput Med Imag Graph 2006;30:9–15.
[12]Yang MS, Tsai HS. A Gaussian kernel-based fuzzy c-means algorithm with a spatial bias correction. Pattern Recogn Lett 2008;29:1713–25.
[13]Geweniger T, Zulke D, Hammer B, Villmann T. Median fuzzy c-means for clustering dissimilarity data. Neurocomputing 2010;73:1109–16.
[14]Dovzˇan D, Sˇkrjanc I. Recursive fuzzy c-means clustering for recursive fuzzy identification of time-varying processes. ISA Trans 2011;50:159–69.
[15]Ji ZX, Sun QS, Xia DS. A modified possibilistic fuzzy c-means clustering algorithm for bias field estimation and segmentation of brain MR image. Comput Med Imag Graph 2011;35:383–97. [16]Ji Z, Sun Q, Xia Y, Chen Q, Xia D, Feng D. Generalized rough
fuzzy c-means algorithm for brain MR image segmentation. Comput Methods Programs Biomed 2012;108:644–55.
[17]Qiu C, Xiao J, Yu L, Han L, Iqbal MN. A modified interval type-2 fuzzy C-means algorithm with application in MR image segmentation. Pattern Recogn Lett 2013;34:1329–38.
[18]Cai W, Chen S, Zhang D. Fast and robust fuzzy c-means clustering algorithms incorporating local information for image segmentation. Pattern Recogn 2007;40:825–38.
[19]Gath I, Geva A. Unsupervised optimal fuzzy clustering. IEEE Trans Pattern Anal Mach Intell 1989;11:773–81.
[20]Hathaway R, Bezdek JC, Hu Y. Generalized fuzzy C-means clustering strategies using norm distances. IEEE Trans Fuzzy Syst 2000;8:576–81.
[21]Pal NR, Bezdek JC. On cluster validity for the fuzzy c-means model. IEEE Trans Fuzzy Syst 1995;3:370–9.
[22]Pal NR, Pal K, Keller JM, Bezdek JC. A possibilistic fuzzy c-means clustering algorithm. IEEE Trans Fuzzy Syst 2005;13:517–30.
[23]Doostparast MH, Zarandi Fazel. Alpha-plane based automatic general type-II fuzzy clustering based on simulated annealing
meta-heuristic algorithm for analyzing gene expression data. Comput Biol Med 2015;64:347–59.
[24] Garcia MLL, Rodenas RG, Gomez AG. Hybrid meta-heuristic optimization algorithms for time-domain-constrained data clus-tering. Appl Soft Comput 2014;23:319–32.
[25] Naik A, Satapathy SC, Parvathi K. Improvement of initial cluster center of c-means using teaching learning based optimization. Procedia Technol 2012;6:428–35.
[26] Rao RV, Savsani VJ, Vakharia DP. Teaching–learning-based optimization: an optimization method for continuous non-linear large scale problems. Inf Sci 2012;183(1):1–15.
[27] Rao RV, Kalyankar VD. Parameter optimization of modern machining processes using teaching–learning based optimization algorithm. Eng Appl Artif Intell 2013;26(1):524–31.
[28] Rao RV, Savsani VJ, Vakharia DP. Teaching–learning-based optimization: a novel method for constrained mechanical design optimization problems. Comput Aided Des 2011;43:303–15. [29] Nayak MR, Nayak CK, Rout PK. Application of multi-objective
teaching learning based optimization algorithm to optimal power flow problem. Procedia Technol 2012;6:255–64.
[30] Zou Feng, Wang Lei, Hei Xinhong, Chen Debao, Wang Bin. Multi-objective optimization using teaching-learning-based opti-mization algorithm. Eng Appl Artif Intell 2013;26:1291–300. [31] Roy PK, Sur A, Pradhan DK. Optimal short-term hydro-thermal
scheduling using quasi-oppositional teaching learning based optimization. Eng Appl Artif Intell 2013;26:2516–24.
[32] Singh M, Panigrahi BK, Abhyankar AR. Optimal coordination of directional over-current relays using Teaching Learning-Based Optimization (TLBO) algorithm. Electr Power Energy Syst 2013;50:33–41.
[33] Sahu BK, Pati S, Mohanty PK, Panda S. Teaching–learning based optimization algorithm based fuzzy-PID controller for automatic generation control of multi-area power system. Appl Soft Comput 2015;27:240–9.
[34] Venkata Rao R, Kalyankar VD. Parameter optimization of modern machining processes using teaching–learning-based opti-mization algorithm. Eng Appl Artif Intell 2013;26:524–31. [35] Azizipanah-Abarghooee R, Niknam T, Bavafa F, Zare M.
Short-term scheduling of thermal power systems using hybrid gradient based modified teaching–learning optimizer with black hole algorithm. Electr Power Syst Res 2014;108:16–34.
[36] Khalghania MR, Khooban MH. A novel self-tuning control method based on regulated bi-objective emotional learning controller’s structure with TLBO algorithm to control DVR compensator. Appl Soft Comput 2014;24:912–22.
[37] Wang Kai-Lin, Wang Hui-Bin, Yu Li-Xia, Ma Xue-Yu, Xue Yun-Sheng. Toward teaching-learning-based optimization algorithm for dealing with real-parameter optimization problems. In: Proceedings of the 2nd international conference on computer science and electronics engineering (ICCSEE 2013); 2013. p. 0606–9.
[38] Satapathy et al. A teaching learning based optimization based on orthogonal design for solving global optimization problems, vol. 2. Springer Plus; 2013. p. 130.
[39] Hartigan JA. Clustering algorithms. John Wiley & Sons, Inc.; 1975.
[40] Hartigan JA, Wong MA. Algorithm AS 136: a K-means clustering algorithm. J Roy Stat Soc Ser C 1979;28(1):100–8 [JSTOR 2346830].
[41] Asyali MH, Colak D, Demirkaya O, Inan MS. Gene expression profile classification: a review. Curr Bioinform 2006;1:55–73. [42] Nayak J, Naik B, Behera HS. Fuzzy C-means (FCM) clustering
algorithm: a decade review from 2000 to 2014. Smart Innov Syst Technol 2000;32(2014):133–49. http://dx.doi.org/10.1007/978-81-322-2208-8_14(vol. 2).
[43] Lin Phen-Lan, Huang Po-Whei, Kuo CH, Lai YH. A size-insensitive integrity-based fuzzy c-means method for data clus-tering. Pattern Recogn 2014;47:2042–56.
[44]Venkata Rao R, Patel Vivek. An improved teaching-learning-based optimization algorithm for solving unconstrained optimiza-tion problems. Sci Iran D 2013;20(3):710–20.
[45]Venkata Rao R, Patel Vivek. An elitist teaching-learning-based optimization algorithm for solving complex constrained optimiza-tion problems. Int J Ind Eng Comput 2012;3:535–60.
[46] Rajasekhar A, Rani R, Ramya K, Abraham A. Elitist teaching learning opposition based algorithm for global optimization. In: IEEE international conference on systems, man, and cybernetics (SMC); 2012. p. 1124–9.
[47] Bache K, Lichman M. UCI machine learning repository. Irvine. CA: University of California, School of Information and Com-puter Science; 2013. <http://archive.ics.uci.edu/ml>.
[48] Naik B, Swetanisha S, Behera DK, Mahapatra S, Padhi BK. Cooperative swarm based clustering algorithm based on PSO and k-means to find optimal cluster centroids. In: IEEE conference on computing and communication systems (NCCCS), 2012 National; 2012. p. 1–5.http://dx.doi.org/10.1109/NCCCS.2012.6413027. [49] Nayak J, Naik B, Kanungo DP, Behera HS. An improved swarm
based hybrid K-means clustering for optimal cluster centers. Adv Intell Syst Comput 2015;339:545–53. http://dx.doi.org/10.1007/ 978-81-322-2250-7_54.
[50]Theodoridis S, Koutroubas K. Pattern recognition. Academic Press; 1999.
[51]Halkidi Maria, Batistakis Yannis, Vazirgiannis Michalis. On clustering validation techniques. J Intell Inf Syst 2001;17(2/ 3):107–45.
[52]Xie XL, Beni G. A validity measure for fuzzy clustering. IEEE Trans Pattern Anal Mach Intell 1991;13(4):841–6.
[53]Friedman MA. The use of ranks to avoid the assumption of normality implicit in the analysis of variance. J Am Stat Assoc 1937;32:675–701.
[54]Friedman MA. Comparison of alternative tests of significance for the problem of m rankings. Ann Math Stat 1940;11:86–92. [55]Iman RL, Davenport JM. Approximations of the critical region of
the Friedman statistic. Commun Stat 1980:571–95.
[56]Garcia S, Fernandez A, Luengo J, Herrera F. Advanced nonparametric tests for multiple comparisons in the design of experiments in computational intelligence and data mining: experimental analysis of power. Inf Sci 2010;180:2044–64. [57]Luengo J, Garcia S, Herrera F. A study on the use of statistical
tests for experimentation with neural networks: analysis of parametric test conditions and non-parametric tests. Expert Syst Appl 2009;36:7798–808.
Janmenjoy Nayakis a Research Fellow in the Department of Computer Sci. Engineering & Information Technology, Veer Surendra Sai University of Technology, Burla, Odisha, India. He completed his M.Tech. (Gold Medalist) degree in Computer Science from Fakir Mohan University, Balasore, Odisha, India, and M.Sc. (Gold Medalist) degree in Computer Science from Ravenshaw Univer-sity, Cuttack, Odisha, India. He has been awarded INSPIRE fellowship of Department of Science and Technology, Ministry of
Science and Technology, Govt. of India for pursuing Ph.D. in Com-puter Science & Engineering at Veer Surendra Sai University of Technology (VSSUT), Burla, Sambalpur, Odisha, India. His area of interest includes Data Mining, Artificial Intelligence, and Pattern Recognition & Soft Computing. He has contributed many research papers to various National and International Conferences and Jour-nals.
Bighnaraj Naikis an Assistant Professor in the Department of Computer Application, Veer Surendra Sai University of Technology, Burla, Odisha, India. He received his Bachelor degree from National Institute of Science and Technology, Berhampur, Odisha, India, and Master degree from SOA University, Bhuba-neswar, Odisha, India. He has more than five years of teaching experience in the field of Computer Science and Information Technol-ogy. His area of interest includes Data Mining and Soft Computing.
Devi Prasanna Kanungois a Ph.D scholar in the Department of Computer Sc. Engineering & Information Technology, Veer Surendra Sai University of Technology, Burla, Odisha, India. He completed his B.Tech. in Computer Science & Engineering from Biju Patnaik University of Technology, Rourkela, Odisha, India. Data Mining and Soft Computing are his areas of interest. He has published various research papers in International conferences.
Himansu Sekhar Behera is working as Asso-ciate Professor in the Department of Com-puter Sc. Engineering & Information Technology, Veer Surendra Sai University of Technology, Burla, Odisha. He received M. Tech from N.I.T., Rourkela (formerly R.E.C.) and Ph.D. from BPUT, Odisha, respectively. Having more than 15 years of both teaching & research experience, he has published more than 80 research papers in internationally reputed journals and conferences, has edited 11 books and is acting as a member of the editorial board/reviewer of various international journals. He is a hefty in the field of Computer Science and served the capacity of keynote speaker, plenary speaker, Program chair, Tutorial Chair and as advi-sory member of programme committees of many national and inter-national conferences. He has guided a good number of M.Tech and Ph.D. scholars. His research interest includes Data Mining, Soft computing, Fuzzy Sets, Uncertainty Analysis, and Evolutionary Computation. He has been an active member of various educational and research societies such as IAENG and ISTE.