Study and Analysis of Calcium Substitution in Y
0.8Pr
0.2Ba
2Cu3O
7- ΔRashmi Meel ; Dr.Amit Kumar ,Dr.Sumit Kumar Gupta
1 Research Scholar, Sunrise University, Alwar, Rajasthan, India
2Professor, Department of Physics, Sunrise University, Alwar Rajasthan, India
3Professor, Department of Physics, Parishkar College of Global Excellence, Jaipur, Rajasthan,
India
ABSTRACT:
YBa2Cu3O7−δ cuprate is a suitable system for the study of impurity effect on superconducting properties because carrier concentration can be widely changed without introducing significant disorder. Thus, the effect of replacing Cu by Co atoms, and Y by Ca atoms is reported to provide useful information about the mechanism of high-Tc superconductivity. In this paper, we have investigated the effect of Ca and Co simultaneous substitution on the structural and physical properties for a series of (Y1−xCax)Ba2(Cu0.98Co0.02)3O7−δ (0 ≤ x ≤ 0.35) ceramic. Doped Y123 samples are prepared by conventional solid-state reaction method and characterized by X-ray diffraction (XRD), SEM, and resistivity measurements. We found that the obtained crystalline structure is mainly orthorhombic. No parasite phase is observed. The orthorhombicity increases with Ca content. The analysis of the superconducting behavior of the samples showed that co-substitution of Ca does not counteract the adverse influence of Co within the single-phase range Introduction
INTRODUCTION
SAMPLE PREPARARTION
The preparation method of the substitutions of 5% to 25% Ca, with a constant 20% Pr, into Y0.8Pr0.2Ba2Cu3O7- δ is different from the
Pr substituted samples and thus a 0% Ca substituted sample is included as a
comparison for the previous set of measurements. Mixed powders of (Y 0.8-YPr0.2CaY)Ba2Cu3O7-δ for the concentrations
of y = 0.05, 0.1,0.15, 0.2, and 0.25 were calcined in air at 905• C for a total of 125 hours with several intermediate regrindings to improve the homogeneity of the samples. The sintering process was performed in the parallel processing system and consisted of the following heat treatment:
1. heat to 935•C holding for 48 hours; then and
2. cool to 500•Cand hold for 18 hours; then
3. cool to 400•Cand hold for 10 hours; then
4. cool to 300•Cand hold for 10 hours; then
5. cool to room temperature. All sintering cooling processes were at the natural cooling rate of the oven.
Resistance measurements were performed on the pellets and then shaped rods and bars were made from the pellets. Magnetization, both ZFC and FC data, were performed on the rods and resistivity measurements were performed on the bars.
MEASUREMENTS
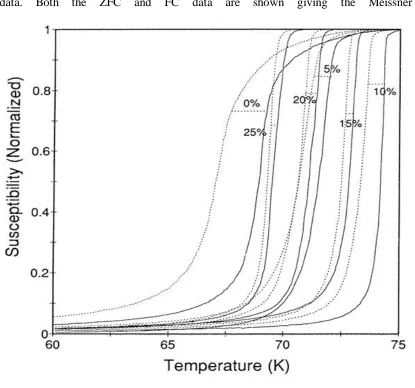
(as described earlier) from the ac susceptibility (Figure 2), and resistivity (Figure 3) measurements. A characteristic comparison (10% Ca) for the Ca substitution
series of all three measurements is given in Figure 4. The Ca samples also exhibit the small (< 3%) BaCuo2 impurities that was
seen in the Pr X- ray measurements.
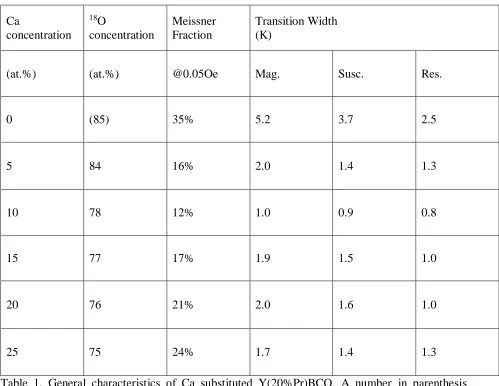
Ca
concentration
18O
concentration
Meissner Fraction
Transition Width (K)
(at.%) (at.%) @0.05Oe Mag. Susc. Res.
0 (85) 35% 5.2 3.7 2.5
5 84 16% 2.0 1.4 1.3
10 78 12% 1.0 0.9 0.8
15 77 17% 1.9 1.5 1.0
20 76 21% 2.0 1.6 1.0
25 75 24% 1.7 1.4 1.3
DC magnetization vs. temperature for Ca substituted Y(20% Pr)BCO. Top16Odata; Bottom 18O data. Both the ZFC and FC data are shown giving the Meissner fraction.
Figure 2
AC susceptibility vs. temperature for Ca substituted Y(20% Pr)BCO. Solid lines represent the
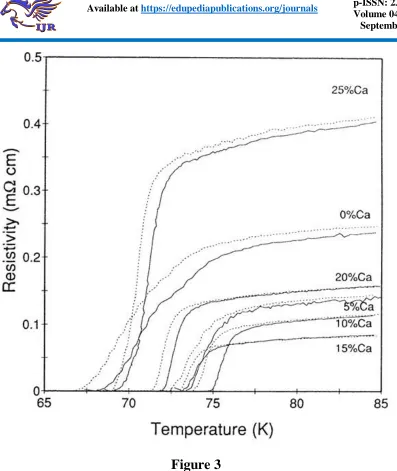
Figure 3
Figur
e .4
Comparison of dc magnetization, ac susceptibility and resistance measurementsfor Y0.8Pr0.2Ba2Cu3O7-δ .The
symbols represent the data. The solidfines provide continuity from point to point. The dotted lines are a visual aid forthe critical
temperature of the resistive transition (obtained from the straight, line extrapolation). The resistive transition was normalized to R(85K).
additions of Ca and remains fairly constant with the increasing Ca concentration. As with the Pr, the resistance has the narrowest transition and the for dc magnetization has the widest. The isotopic shift measured is similar for both magnetic measurement but the resistivity measurement give a somewhat larger value for the higher concentration .the size of the isotopic shift is affected also by the addition of Ca as it is reduced from that of the 20% Pr sample fabricated under the same conditions. The reductions is considerable since the change in Tc is quite small only about 7K throughout the entire substitution range The increase in Ca concentration in the sample has an effect on a number of properties of this system. First, Tcincrease then decrease with a maximum at approx. 10% Ca. Second, the Meissner fraction decrease then increase with a minimum at the
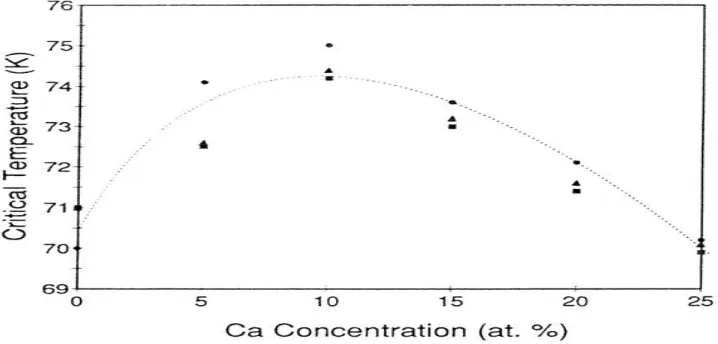
10% Ca. The normal state resistivity (at T=85K) is also parabolically dependent on the Ca concentration although its minimum is the slightly higher concentration.The parabolic effect in Tc (Figure 5) has been reported earlier The Tc data and the corresponding concentration of both the Pr, x, and the Pr:Ca, y, series has been fitted to the function proposed by Neumeier et al59. The dotted line in Figure 5 indicates this fit to equation [2.1], which gives:
Tc(x,y) = 93.6K - (157K)(0.091-0.874x+y)2
-(93.3K)x [1]
It should be noted that the last in equation [1], the linear pair-Breaking term, is an approximation to the more complicates digamma function which
Figure 5
Critical temperature vs. Ca concentration. The parabolic line is a fit of the data to the function73 T
c(x.y) = Tco-A(γ-βx-y)2
-Bx,where x is the Pr concentration and y is the Ca concentration. We obtain Tco = 93.6K,
a=157K, B= 93.3K, γ=0.091, and β=0.874. Both the Pr and the Pr:Ca data is used in
fitting the function.should be used when dealing with the highest Pr concentrations because the pair-breaking here is no longer linear.
The data, the Simplex fit to the data, and the computed isotope shift for the system of (Y0.8Pr0.2Ba2Cu3O7-δ), y = 0, 0.05, 0.1,
respectively. The critical temperatures, the isotope shifts, and the computed values of the isotope coefficient for this system are given in Table 2. The relationship between α and ∆Tc as a function of Tc is given in Figure 12.
Due to the smaller temperature range plotted here, the uncertainty in the temperature values appear large. In fact, they are actually smaller than that obtained in the Pr series. The value of Tc reported in the table is that
which has been determined from the linear extrapolation technique as explained earlier. The isotopic shift, ∆Tc and the value of the
isotope coefficient, α, change little over the short spread in critical temperature. The relationship between the critical temperature and α or ∆Tc is not clear. Considering the
parabolic nature of the other properties of the system, a possible parabolic fit to α and ∆Tc,
can be detected in the data (dotted line Figure 12). However, the large relative uncertainties also leave the possibility that of a linear
relationship or perhaps even no change in ∆Tc
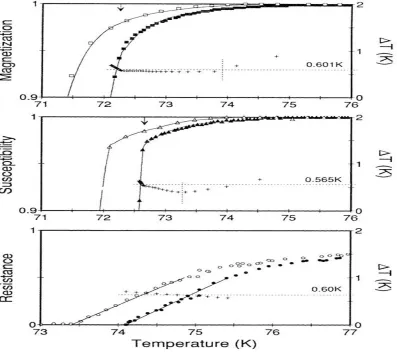
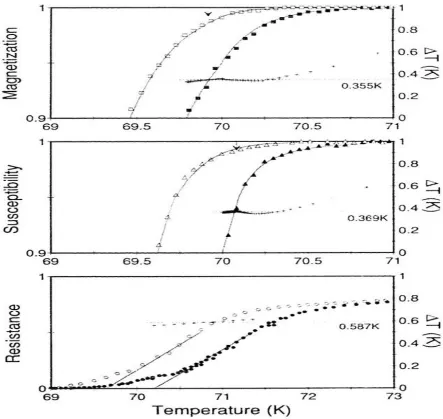
at all. The empty symbols represent the 18O data and the filled symbols represent the 16O data The solid line represents the Simplex fit to the data. The "+" symbols represent the shift, ∆Ti, as a function of temperature, between the two fits to the data. The arrows on the magnetization and susceptibility graphs indicate the critical temperature obtained from a hear extrapolation of the bulk of the transition: 71.0k for both the magnetization and susceptibility. The upper limit for Tc is 76.0 K.
Figure 6 Oxygen isotope effect in (Y
0.8Pr0.2)Ba2Cu3O7-δ, 0% Ca, 20% Pr substitution0% Ca, 20% Pr substitution
The empty symbols represent the 18O data and the filled symbols represent the16Odata. The solid line represents the Simplex fit to the data. The "+" symbols represent the shift, ∆Ti, as a function of temperature, between the
two fits to the data. The arrows on the magnetization and susceptibility graphs indicate the critical temperature obtained from a linear extrapolation of the bulk of the
transition: 72.5Kfor the magnetization (upper limit = 74.8K) and 72.6K for the susceptibility (upper limit = 74.6K). No cutoff was imposed in the calculation of the mean of the isotope shift. The horizontal line indicates this mean, and its value is indicated above the line. The resistance measurements are normalized to R(85K). Not all temperature scales are equivalent.
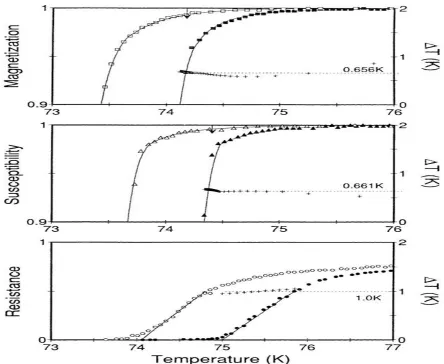
Figure 7 Oxygen isotope effect in (Y
0.8Pr0.2Ca0.05)Ba2Cu3O7-δ, 5% Ca, 20% Pr substitutionThe empty symbols represent the 18O data and the filled symbols represent the 16O data. The solid line represents the Simplex fit to the
The arrows on the magnetization and susceptibility graphs indicate the critical temperature obtained from a linear extrapolation of the bulk of the transition: 74.2Kfor the magnetization (upper limit = 75.8K) and 74.4K for the susceptibility (upper limit = 75.7K). No cutoff was imposed
in the calculation of the mean of the isotope shift. The horizontal line indicates this mean, and its value is indicated above the line. The resistance measurements are normalized to R(85K).
Not all temperature scales are equivalent.
Figure 8
Oxygen isotope effect in (Y0.8Pr0.2Ca0.1)Ba2Cu3O7-δ ),10% Ca, 20% Prsubstitution
The empty symbols represent the 18O data
and the filled symbols represent the 16O data. The solid line represents the Simplex fit to the data . The "+” symbols represent the shift,
∆Ti as a function of temperature, between the two fits to the data.
calculation of the mean of the isotope shift. The horizontal line indicates this mean, and its value is indicated above the line. The
resistance measurements are normalized to R(85K).
Not all temperature scales are equivalent.
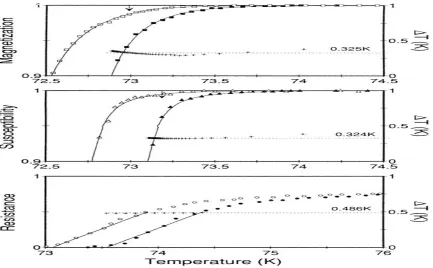
Figure 9
Oxygen isotope effect in (Y0.65Pr0.2Ca0.15)Ba2Cu3O7-δ ),15%Ca, 20%Pr substitution
The empty symbols represent the 18O data and the filled symbols represent the 16O data.
The solid line represents the Simplex fit to the data . The "+" symbols represent the shift, ∆Ti, as a function of temperature, between the
two fits to the data. The arrows on the magnetization and susceptibility graphs
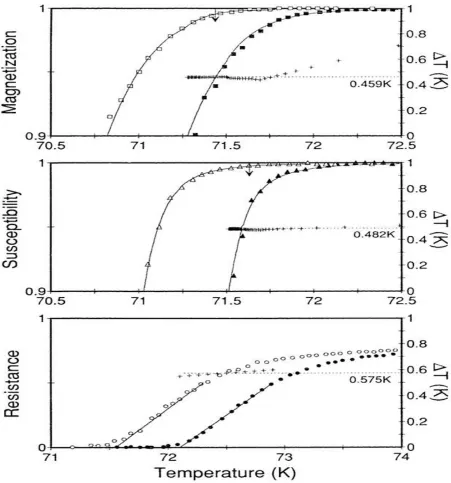
Figure 10
Oxygen isotope effect in (Y0.6Pr0.2Ca0.2Ba2Cu3O7- δ ), 0% Ca, 20% Prsubstitution
The empty symbols represent the 18O data and the filled symbols represent the 16O data.
magnetization and susceptibility graphs indicate the critical temperature obtained from a linear extrapolation of the bulk of the transition: 69.9Kfor the magnetization (upper limit = 70.9K) and 70.1K for the susceptibility (upper limit = 71.2K). No cutoff was imposed in the calculation of the
mean of the isotope shift. The horizontal fine indicates this mean, and its value is indicated above the line.
The resistance measurements are normalized to R(85K). Not all temperature scales are equivalent.
Measurement Sample Tc(K) ∆Tc(K) Α
dc
magnetization
0% 71.0 +5.0
−2.0
0.989+0.055 0.119+0.012
5% 72.5 +2.3−0.2 0.601+0.047 0.071+0.006
10% 74.2 +1.6−0.2 0.656+0.030 0.075+0.004
15% 73.0 +1.0−0.2 0.325+0.020 0.038+0.003
20% 71.4 +1.1−0.2 0.459+0.042 0.055+0.005
25% 69.9 +1.0−0.2 0.355+0.041 0.043+0.005
ac
susceptibility
0% 71.0 +5.0
−2.0
0.968+0.013 0.117+0.008
5% 72.6 +2.0−0.2 0.565+0.060 0.066+0.007
10% 74.4 +1.3−0.2 0.661+0.020 0.074+0.008
15% 73.2 +0.6−0.2 0.324+0.095 0.040+0.011
20% 71.6 +1.0−0.2 0.482+0.042 0.057+0.005
25% 70.1 +1.1−0.2 0.369+0.028 0.045+0.004
Dc
resistance
0% 70.0 +0.3
−0.3
0.969+0.028 0.118+0.004
5% 74.1 +0.1−0.1 0.600+0.082 0.073+0.010
10% 75.0+0.1−0.3 1.000+0.010 0.111+0.002
15% 73.6 +0.1−0.1 0.486+0.011 0.059+0.001
20% 72.1 +0.1−0.2 0.575+0.002 0.071+0.003
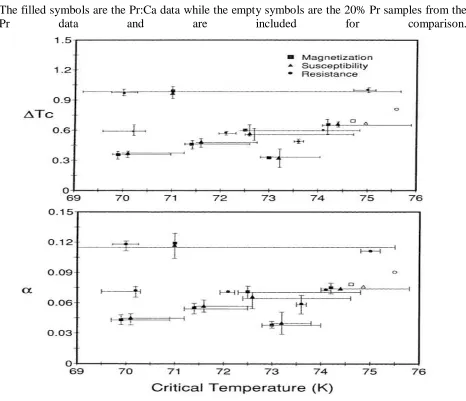
∆Tc and α vs. Tc for Ca substituted Y(20% Pr)BCO. The positive error bars in temperature reflect
the length of the tails in the magnetic measurements. Due to the temperature range platted, the error bars appear, erroneously, larger than that of the previous Pr data.
The filled symbols are the Pr:Ca data while the empty symbols are the 20% Pr samples from the
Pr data and are included for comparison.
Figure 12
DISCUSSION
The fit of Tc to the concentrations of Pr, x, and Ca, y, to equation [2.1] fit very well. The maximum obtainable Tco (in the YBCO
system) from our calculations is 93.6K, which appears to be a more reasonable value than Neumeier's 97K59.We obtain an
is consistent with the measurements that indicate a mixed valence between +3 and +4 With the optimum hole concentration, γ (= 0.091) being slightly smaller than Neumeier's (γ = 0.1), the predicted (relative) change in mobile hole concentration will also be very similar. In fact, only one parameter is significantly different from Neumeier's, and that is the coefficient A. Our value of A = 157K is 37% of Neumeier's A = 425K. The smaller value of A suggests that Tc would be
more strongly affected by pair- breaking than by a change in hole concentration. The 20% Pr, 0% Ca sample made for comparison, is quite different from that of the Pr20-50% system. Its Tc is about 5K lower than before,
the magnetic transition width is much
broader (-1.4X) and its isotope shift is also larger (-1.5X). Clearly the preparation technique greatly affects the characteristics and hence the quality of the samples. As the highest quality materials, single crystals, tend to have very sharp transitions, and the polycrystalline materials have broader transitions, the relationship between the isotope shift and the width of the transition was investigated for both the Pr and Pr:Ca substituted materials. A linear correlation between the ∆Tc and the transition width is
Figure 13
∆Tc vs. transition width for the Pr and the
Pr:Ca system. The dotted line is a linear fit to the data indicates a possible relationship between the magnitude of the isotope shift, ∆Tc ,and the width of the transition. In the Pr
system, we noted that the tails in the magnetic measurements become much larger with the increase in Pr concentration as do the transition widths, and the isotope shifts. The Ca data with its much sharper transitions and lack of low shielding tails do not exhibit thissame effect. As both sets of samples have similar impurity lines in the X-ray data, it is unlikely that the long tails can be attributed solely to the impurities within the samples. Of course, the Ca substitution does no4 have the large effect on Tc, that the Pr does and it
may then be argued that ∆Tc, the transition
width, as well as the isotope shift are dependent on Tc.
Conclusion
There does exit, in the high temperature superconducting system of (y1-xPrx)Ba2Cu 3O7- δ , (Y0.8-yPr0.2Cay)Ba2Cu3O7- δ and
YBa2(Cu1-zZnz)O7- δ an oxygen isotope effect.
In all cases, the dc magnetization, the acsusceptibility and the dc resistive measurements show that the substitution of the heavier 18O isotope for 16O leads to a reduction in the critical temperature. For the Pr data, the isotope shift in TC, ∆TC increases
with increasing concentration; hence α also increases and at the highest concentration is approximately 1⁄2 .The Zn data has a relatively constant or perhaps even a slightly decreasing ∆TC, with increasing
concentration. Consequently α increases to approximately 1⁄3 as TC, drops.
The critical temperature and isotope coefficient were modeled using a modification to the BCS theory involving a logarithmic Van Hove singularity in the density of states. This model proved relatively success full in that it predicts the general trends found in our data: the small α at the highest TC, and an increase in α as TC
drops. The range of change for a predicted is reasonable although the actual values are somewhat larger than observed. The response of the VHS model relies heavily on the parameter δ, the difference between the singularity in the DOS and the Fermi energy. The smaller δ becomes, the more the isotope shift is reduced. Thus this model indicates that the difference between the peak in the DOS and the Femi energy is an important feature.
Reference:
[1] T.A. Faltens, W.K. Ham, S.W. Keller
, K.J. Leary, J.N. Michaels, A.M. Stacy, H.C.
zur Loye, D.E. Morris, T.W. Barbee III, L.C.
Bourne, M.L. Cholen, S. Hoen AND a.Zettl,
Phys. Rev. Lett., 59, 915 (1987).
[2] L. Quan, Y.wei, Q. Yan, G. Chen, P.
Zhang, Z. Shen, Y.Ni, Q. Yang, C. Liu,
T.Ning, J. Zhao, Y. Shao, S.Han and J. Li,
Solid State Comm., 65, 869 (1988).
[3] B.Batlogg, R.J. Cava, A.Jayaraman,
R.B. Van Dover, G.A. Kourouklis, S.
Sunshine, D.W. /Murphy. L.W. Rupp, H.S.
Chen, A. White, K.T. Short, A.M. Mujsce,
and E.A. Rietman, Phys. Rev. Lett., 58., 2333
[4] B. Batlogg, G. Kourouklis, W.
Weber, R.J. Cava, A. Jayaram, A.E. White,
K.T. Short, L.W. Rupp and E.A. Rietman,
Phys. Rev. Lett., 59 912 (1987).
[5] H.C. zur Loye, K.J. Leary, S.W.
Keller, W.K. Ham, J.N. Michaels and A.M.
Stacy, Science,238 ,1558, (1987).
[6] K.J. Leary , H.C. zur Loye, S.W.
Keller, W.K. Ham, J.N. Michaels and A.M.
Stacy, Phys, Rev. Lett., 59 ,1236 (2001).
[7] D.E. Morris, R.M. Kuroda, A.G.
Markeiz, J.H. Nickel and J.Y.T. Wei, Phys.
Rev. B, 37, 5936 (2016).
[8] S. hoen, W.N. Creage , L.C. Bourne,
M.F. Crommie, T.W. Barbee III, M.L. Cohen
and A. Zetti, Phys. Rev. B, 39, 2269, (2015).
[9] H. Katayama- Yoshida, T. Hirooka,
A.J. Mascarenhas, Y. Okabe, T. Takahahsi,
T. Sasaki, A. Ochiai, T. Suzuki, J.I. Pankove,
T.F. Ciszek and S.K. Deb, Jpn. J Appl. Phys.,
26, L2085 (2002).
[10] H. Katayama- Yoshida, T. Hirooka,
A.J. Mascarenhas, Y. Okabe, T. Takahahsi,
T. Sasaki, A. Ochiai, T. Suzuki, J.I. Pankove,
T.F. Ciszek and S.K. Deb, R.B. Goldfarb and
Y. Li, Physica C,156,481 (1988).
[11] M.K. Crawford, M.N. Kunchur, S.J.
Poon, Phys. Rev. B,41,282 (2004).
[12] H.J. Bornemann and D.E. Morris,
Phys. Rev. B, 44, 5322, (1991).
[13] A.I. Kingon, S. Chevacharoenkul, S.
Pejovnik, R. Velasquez, R. Porter, 1. Hare
and H, Palmour, Hiah Temperature
Superconducting Materials, editors W. E.
Hatfield and J.H. Miller, Marcel Dekker Inc.,
New York, 327 (1988)
[14] C.C. Tsuei, Physica A,168, 238,
(2005).
[15] J.S. Sheir and D.M. Ginsberg, Phys.
Rev.,147, 384 (1966).
[16] P.P. Frietas, C.C. Tsuei and T.S.
Plaskett, Phys. Rev. B,36.833(1987).
[17] B. Oh, K. Char, A.D. Kent, M. Naito,
M.R. Beasley, T.H. Geballe ,R.H. Hammond,
A. Kapitunlik, J.M. Graybeal, Phys. Rev. B,
37,7861 (1988).
[18] D- Chen, J-A, Brug, and R. B.
Goldfarb, IEEE Transactions on Magnetics,
27, 3601 (1991).
[19] M. Denhoff, S. Gygax and J.R. Long,
Cryogenics, July, 400 (2003).
[20] R.B. Goldfarb, M. Lental, C.A.
Thompson, Alternating-Field Susceptometry
and Magnetic Susceptibility of
Superconductors, Maunetic Susceptibilitv of
Superconductors and Other Spin Svstems,
editors R.A. Hein, T.L. Francavilla and D.H.
Liebenberg, Plenum Press, New York, 49
[21] J.D. Jorgensen, B.W. Veal, A.P.
Paulikas, L.J. Nowicki, G.W. Crabtree, H.
Claus and W.K. Kwok, Phys. Rev. B,
41,1863 (1990).
[22] Y- Ueda and K. Kosuge, Physica
C,156,281 (2005).
[23] R.J. Cava, B. Batlogg, C.H. Chen,
E.A. Rietrnan, S.M. Zahurak and D. Werder,
Phys. Rev. B, 36, 5719 (1987); Nature, 329,
423 (1987).
[24] F. Beech, S. Miraglia, A. Santoro and
R.S. Roth, Phys. Rev. B, 35, 8778 (1987).
[25] K.A. Muller, ZPhys.
B,80,193(1990).
[26] B.W Veal, A.P. Paulikas, H. You, H.
Shi, Y. Fang and J.W. Downey, Phys. Rev.
B, 42,6305 (1990).
[27] J.L. Tallon and N.E. Flower, Physica
C, 204,237 (2006).
[28] J.P. Franck, J. Jung, G. Salomons,
W.A. Miner, M.A.K. Mohamed, J.
Chrzanowski, S. Gygax, J.C. Irwin,
D.F.Mitchell and G.I. Sproule, Physica C,
172, 90(2006).
[29] KC. Ott, J.L. Smith, J.O. Willis, R. M.
Aikin, E. Garcia, M. Goldblatt, W.B.
Hutchinson, G.H. Kwei, C.B. Pierce, J.F.
Smith, J.D. Thompson and T.E. Walker, Los
Atamos National Laboratory, unpublished
work, (2009).
[30] P.J. Yvon, R.B. Schwarz, C.B. Pierce,
L. Bernardez, A. Connor and R.
Melsenheimer, Phys. Rev. B, 39, 6690