R E S E A R C H A R T I C L E
Open Access
Consistency of metagenomic assignment
programs in simulated and real data
Koldo Garcia-Etxebarria, Marc Garcia-Garcerà and Francesc Calafell
*Abstract
Background:Metagenomics is the genomic study of uncultured environmental samples, which has been greatly facilitated by the advent of shotgun-sequencing technologies. One of the main focuses of metagenomics is the discovery of previously uncultured microorganisms, which makes the assignment of sequences to a particular taxon a challenge and a crucial step. Recently, several methods have been developed to perform this task, based on different methodologies such as sequence composition or sequence similarity. The sequence composition methods have the ability to completely assign the whole dataset. However, their use in metagenomics and the study of their performance with real data is limited. In this work, we assess the consistency of three different methods (BLAST + Lowest Common Ancestor, Phymm, and Naïve Bayesian Classifier) in assigning real and simulated sequence reads.
Results:Both in real and in simulated data, BLAST + Lowest Common Ancestor (BLAST + LCA), Phymm, and Naïve Bayesian Classifier consistently assign a larger number of reads in higher taxonomic levels than in lower levels. However, discrepancies increase at lower taxonomic levels. In simulated data, consistent assignments between all three methods showed greater precision than assignments based on Phymm or Bayesian Classifier alone, since the BLAST + LCA algorithm performed best. In addition, assignment consistency in real data increased with sequence read length, in agreement with previously published simulation results.
Conclusions:The use and combination of different approaches is advisable to assign metagenomic reads. Although the sensitivity could be reduced, the reliability can be increased by using the reads consistently assigned to the same taxa by, at least, two methods, and by training the programs using all available information.
Keywords:Metagenomics, Assignment, Comparison
Background
Metagenomics is an emerging field that enables the gen-omic study of environmental samples, allowing the identifi-cation and characterization of bacterial and viral genomes previously unknown given the difficulty or impossibility to culture most species. The capacity of studying envi-ronments from a genomic point of view afforded by metagenomics is unprecedented [1]. A crucial step in metagenomics is sequence assignment, both taxonomic and functional: sequence reads need to be allocated to a genomic unit, or, at least, to a particular taxonomic level, and, in a further step, they may be mapped to a gene or set of genes with known functions. Different algo-rithms have been devised to assign sequences to taxonomic
levels; they are based on sequence similarity, composition, phylogeny, or a combination of them [2]. However, at least two issues make taxonomic assignment difficult. First, the read length obtained by next generation sequencing tech-nologies is not long enough to allow the original methods to properly assign the reads to low taxonomic levels (such as genus or species) due to the low sequence divergence between closely related taxonomic groups [3]. And sec-ond, since reference genomes are not available for many uncultured organisms, an incorrect assignment (or even no assignment at all) may be produced when no closely related species have been previously identified. The main approaches for assignment are based on sequence similar-ity and sequence composition. Packages using the former approach include MG-RAST [4] and MEGAN [5], while the Naïve Bayesian Classifier (such as implemented in Frag-ment Classification Package, FCP) [6] and the interpolated * Correspondence:[email protected]
Institut de Biologia Evolutiva (CSIC-Universitat Pompeu Fabra), Barcelona, Spain
© 2014 Garcia-Etxebarria et al.; licensee BioMed Central Ltd. This is an Open Access article distributed under the terms of the Creative Commons Attribution License (http://creativecommons.org/licenses/by/2.0), which permits unrestricted use, distribution, and reproduction in any medium, provided the original work is properly credited.
Markov model classification (IMM-based), used by Phymm [7] are based on composition similarity. The performance of assignment programs has been assessed using simulated and well-known experimental data [2,3,6-8]. In the case of composition-based programs, these methods can classify all the reads [2], and report the associated likelihood of the read to be assigned to the different categories. How-ever, there are few metagenomic studies where these methods were used, e.g. [9-11].
To assess the relative performance of composition- vs. sequence-similarity methods, here we compare the Markov Model based (implemented in Phymm) and Bayesian-based (implemented in FCP) approaches against the classical pair wise sequence alignment (BLAST) in simulated meta-genomic data and in data newly generated in our group. Our aim is to clarify which strategy could be the best to deal with taxonomic read assignment in metagenomic data.
Results & discussion
Once metagenomic reads are obtained, taxonomic as-signment is a crucial step that may determine subse-quent analyses. Similarity-based approaches are the most commonly used but, due to the lack of reference se-quences in the publicly available databases, a huge per-centage of sequences are not assigned correctly or not assigned at all. For instance, between 23.5% and 29.6% of the reads were not assigned in the intestinal microbiome of the dog [12]. In our simulated data, using the BLAST + LCA (Lowest Common Ancestor) method imple-mented in FCP, between 0% and 3.65% of reads were not assigned at a domain level. Since all the sequences used are present in databases, it is not surprising that almost all reads were assigned. However, in two mouse skin metagenome real datasets (see Methods), 31.7% and 37.1% of the reads could not be assigned to a taxonomic domain. Thus, around one third of reads were of un-known origin in real data, although they are likely to be bacterial or viral, since the host genome is well character-ized. As the reference databases grow, it is expected that the proportion of unassigned fragments will decrease.
The new, composition-based algorithms such in Phymm or FCP routinely classify all the reads [2]. However, they carry the risk of incorrectly assigning reads coming from unknown taxonomic units that may be closely related to some of the references. In order to deal with those pos-sible incorrect assignments, a similarity assignment from BLAST is added to FCP and Phymm to provide some de-gree of reliability to the results obtained by their core composition-based algorithms [6,7]. And still, since all the methods rely on previously trained databases or on com-paring their classifiers against known data, the biases should not be ignored, and wrong assignments could occur. Indeed, the performance of each method, in terms
such as sensitivity and precision, has been investigated both with simulated data and with well-known data-sets separately [2,3,6,7], but, as far as we know, the analysis of the consistency of assignments by different methods with simulated and new data is limited.
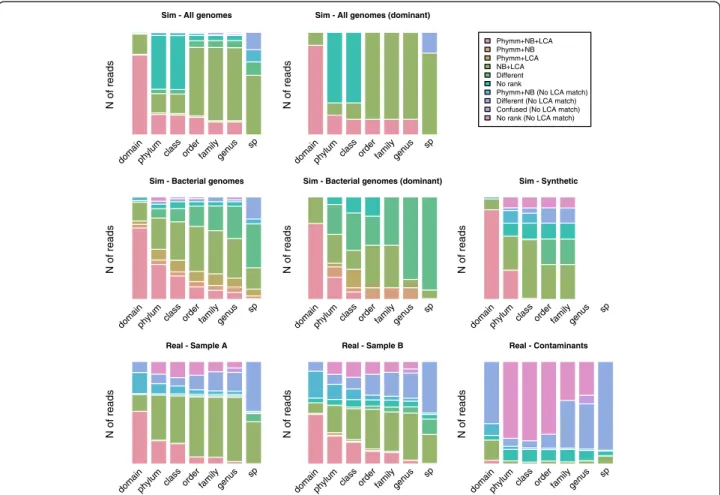
Consistency, sensitivity and precision in simulated data We simulated different metagenomic datasets with dif-ferent features (Additional file 1: Table S1) to assess the performance of the programs in diverse scenarios. Given that different simulation algorithms may mimic different environment scenarios, three different methods were used. We constructed four metagenomic environments with Metasim and two with iMESS, which are the most popular metagenomic simulation algorithms. Four add-itional datasets were simulated with a custom script de-veloped in our lab to facilitate the use of the homemade databases and the creation of different scenarios. Ac-cordingly, both Metasim and iMESS simulations were compared with our constructed datasets to test the ro-bustness of our algorithm. Finally a set called“Synthetic” was constructed using 3 genomes of hypothetical bacteria constructed through a phylogenetic-based approach. Bac-terial genomes were constructed with a script developed in our laboratory (Garcia-Garcerà, M. Manuscript in prep-aration). To deal with different complexity scenarios, two different levels of complexity (regarding the number of initial species) were used in our algorithm. In the first one, only bacteria were used, limiting the number of variants to the number of already sequenced bacteria. In the sec-ond situation, we included plasmids and other viral genomes (independently of their environmental association), constructing genomic sets with a much higher complexity. In the four simulated scenarios, a similar trend was observed (Figure 1). At domain level, the three assign-ment algorithms matched most of the reads to the same taxa (77.7% of reads were assigned to the same taxa for the “All genomes” set and 68.7% for the “Bacterial genomes” set). However, this consistency of assignment dropped dramatically in shallower taxonomic levels: no reads were assigned to the same species in the “All genomes”dataset and only 0.8% in the“Bacterial genomes”. The major difference between the “All genomes” and “Bacterial genomes”sets was the number of“no rank” as-signments (at phylum level, 52.4% of reads were assigned as“no rank”in the“All genomes”dataset and 8.4% in the “Bacterial” dataset, respectively). These differences in the unranked assignments and the inconsistencies between the assignments by different methods may probably be due to the presence of viruses, which tend to be more variable and, then, more difficult to assign. Consistency on the assignments of dominant species datasets compared to their no-dominant counterparts was quite similar, e.g. at phylum level, reads assigned by all three methods to the
same taxa was 19.2% in“All genomes” and 19.8% in“All genomes - Dominant”. Since these are simulated datasets, the consistency results could be separated between true and false positives (Additional file 2: Figure S1). The reads assigned to the same taxa by the three approaches used were defined as correctly assigned. In shallower taxonomic levels, the number of correctly assigned reads decreased, and the assignments were more discordant, especially in those that were wrongly assigned (Additional file 2: Figure S1). In the“Synthetic” set, the agreement between the three programs was higher at domain and phylum levels and in shallower levels, such as class or order, Bayesian Classifier and BLAST + LCA agreed in the taxo-nomic assignment of reads (Figure 1).
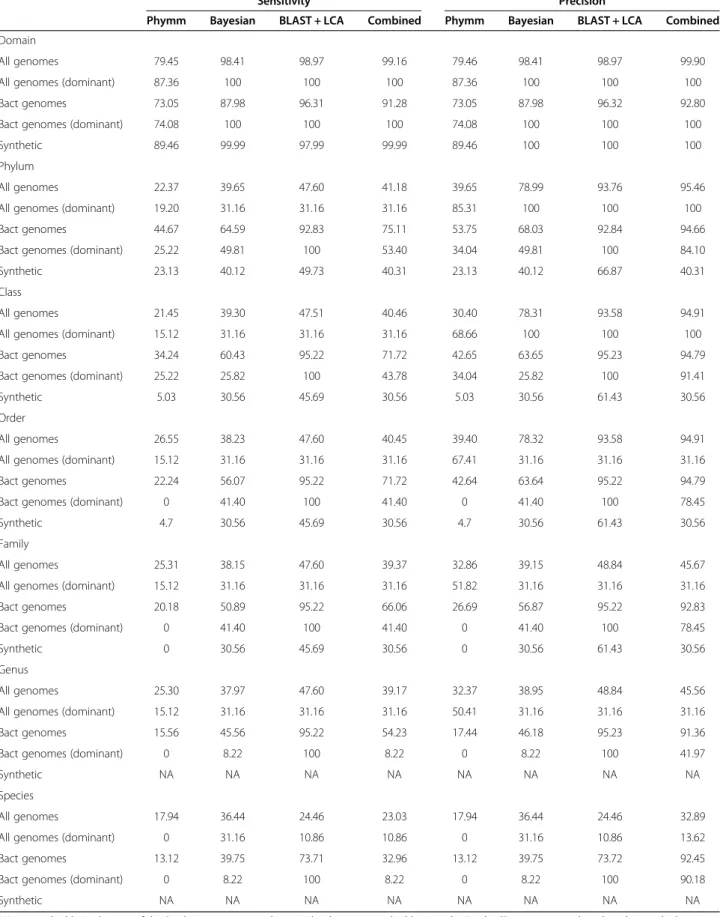
True-positive measures (sensitivity and precision) are shown in Table 1. Broadly, Phymm and NBC were less sensitive and precise than BLAST + LCA or than a combined strategy (where a read was assigned to a taxon if at least two methods converged). In addition, sensitivity and precision at genus level by Phymm and NBC were within the range previously described [2].
Thus, the use of a combined strategy improved the per-formance of assignments. However, this improvement was due to the effect of BLAST + LCA. In a more realis-tic scenario, where a high number of reads was not assigned by BLAST + LCA (that is, in a scenario where we find taxonomic units not previously described or without representatives in the reference database), the improvement would not be so remarkable. The results were very different between methods (Table 1) in the “Synthetic”dataset, that is, a metagenome simulation of three synthetic genomes (see Methods). The ability to assign correctly “evolved” genomes of a given taxo-nomic group was better in the case of BLAST + LCA (sensitivity 45.7% and precision 61.43% at class level) and poorer for PhymmBL (both sensitivity and preci-sion 5.0% at class level). This lack of sensitivity in the artificially constructed genomes could be a result of the lack of reference sequences on the original databases used to train the programs. This result points out the importance of training to correctly assign metagenomic reads [2].
Sim - All genomes
N of reads
domainphylumclass order family genus
sp
Sim - All genomes (dominant)
N of reads
domainphylumclass order family genus
sp Phymm+NB+LCA Phymm+NB Phymm+LCA NB+LCA Different No rank
Phymm+NB (No LCA match) Different (No LCA match) Confused (No LCA match) No rank (No LCA match)
Sim - Bacterial genomes
N of reads
domainphylumclass order family genus
sp
Sim - Bacterial genomes (dominant)
N of reads
domainphylumclass order family genus
sp
Sim - Synthetic
N of reads
domainphylumclass order family genus
sp
Real - Sample A
N of reads
domainphylumclass order family genus
sp
Real - Sample B
N of reads
domainphylumclass order family genus
sp
Real - Contaminants
N of reads
domainphylumclass order family genus
sp
Figure 1Number of reads assigned in each taxonomic level in simulated and real data.Sim, simulated data; Real, real data. NBC, Naïve Bayesian Classifier; LCA, Lowest Common Ancestor of BLAST results; Confused, genera that are known to be systematically confused between Phymm and Naïve Bayesian Classifier [6]. In the case of the Synthetic set, genus and species levels are not applicable since the“evolved” genomes were based on these or higher levels.
Table 1 Percentage sensitivity and precision in simulated datasets
Sensitivity Precision
Phymm Bayesian BLAST + LCA Combined Phymm Bayesian BLAST + LCA Combined
Domain
All genomes 79.45 98.41 98.97 99.16 79.46 98.41 98.97 99.90
All genomes (dominant) 87.36 100 100 100 87.36 100 100 100
Bact genomes 73.05 87.98 96.31 91.28 73.05 87.98 96.32 92.80
Bact genomes (dominant) 74.08 100 100 100 74.08 100 100 100
Synthetic 89.46 99.99 97.99 99.99 89.46 100 100 100
Phylum
All genomes 22.37 39.65 47.60 41.18 39.65 78.99 93.76 95.46
All genomes (dominant) 19.20 31.16 31.16 31.16 85.31 100 100 100
Bact genomes 44.67 64.59 92.83 75.11 53.75 68.03 92.84 94.66
Bact genomes (dominant) 25.22 49.81 100 53.40 34.04 49.81 100 84.10
Synthetic 23.13 40.12 49.73 40.31 23.13 40.12 66.87 40.31
Class
All genomes 21.45 39.30 47.51 40.46 30.40 78.31 93.58 94.91
All genomes (dominant) 15.12 31.16 31.16 31.16 68.66 100 100 100
Bact genomes 34.24 60.43 95.22 71.72 42.65 63.65 95.23 94.79
Bact genomes (dominant) 25.22 25.82 100 43.78 34.04 25.82 100 91.41
Synthetic 5.03 30.56 45.69 30.56 5.03 30.56 61.43 30.56
Order
All genomes 26.55 38.23 47.60 40.45 39.40 78.32 93.58 94.91
All genomes (dominant) 15.12 31.16 31.16 31.16 67.41 31.16 31.16 31.16
Bact genomes 22.24 56.07 95.22 71.72 42.64 63.64 95.22 94.79
Bact genomes (dominant) 0 41.40 100 41.40 0 41.40 100 78.45
Synthetic 4.7 30.56 45.69 30.56 4.7 30.56 61.43 30.56
Family
All genomes 25.31 38.15 47.60 39.37 32.86 39.15 48.84 45.67
All genomes (dominant) 15.12 31.16 31.16 31.16 51.82 31.16 31.16 31.16
Bact genomes 20.18 50.89 95.22 66.06 26.69 56.87 95.22 92.83
Bact genomes (dominant) 0 41.40 100 41.40 0 41.40 100 78.45
Synthetic 0 30.56 45.69 30.56 0 30.56 61.43 30.56
Genus
All genomes 25.30 37.97 47.60 39.17 32.37 38.95 48.84 45.56
All genomes (dominant) 15.12 31.16 31.16 31.16 50.41 31.16 31.16 31.16
Bact genomes 15.56 45.56 95.22 54.23 17.44 46.18 95.23 91.36
Bact genomes (dominant) 0 8.22 100 8.22 0 8.22 100 41.97
Synthetic NA NA NA NA NA NA NA NA
Species
All genomes 17.94 36.44 24.46 23.03 17.94 36.44 24.46 32.89
All genomes (dominant) 0 31.16 10.86 10.86 0 31.16 10.86 13.62
Bact genomes 13.12 39.75 73.71 32.96 13.12 39.75 73.72 92.45
Bact genomes (dominant) 0 8.22 100 8.22 0 8.22 100 90.18
Synthetic NA NA NA NA NA NA NA NA
NA, not applicable. In the case of the Synthetic set, genus and species levels are not applicable since the“evolved”genomes were based on these or higher levels. The features of each dataset is explained inMethodsand their descriptive and diversity parameters in Additional file1: Table S1.
To assess the robustness of the results obtained with our script to generate simulated metagenomic data and the use of different scenarios, MetaSim [13] and iMESS were used to simulate metagenomic datasets. However, the results obtained in those simulations were very simi-lar between them and more consistent than the results obtained in the “Bacterial genomes” dataset (Additional file 3: Figure S2). For example, at phylum level, the three programs assigned to the same taxa 51.33% of reads in “Metasim 1” set, 51.25% in “Metasim 2” set, 49.86% in “Metasim 3” set and 51.56% in “Metasim 4”, compared to the 33.68% of convergent assignments obtained in the “Bacterial” dataset. In the case of sensitivity and preci-sion a similar trend was observed (Additional file 1: Table S1).
Consistency in real data
The number of consistent assignments in both samples was quite similar and it depended on the depth of taxo-nomic level (Figure 1). At domain level around half of the reads were consistently assigned to the same taxa by the three approaches used, at phylum it decreased to around a quarter, and at species level there were only few agreements. The main difference compared to simu-lated data is that BLAST + LCA does not improve the assignment, perhaps because the misassignments are due to the lack of representatives in the reference data-bases, since previously uncharacterized taxonomic units may be present in the environment sampled.
In real data, ~12%-15% “no rank” assignments were consistently assigned by all three methods. This percent-age may reflect truly uncharacterized individuals, since skin is the least studied ecosystem on the body, given its extension and the difficulty to reach the commensal community. Moreover, 11 genera are consistently con-fused between Phymm and NBC [6], and we have labeled them separately as “confused”; these genera comprised 4.2% of sample A and 4.1% of sample B in our real datasets.
Regarding the “contaminant” dataset (Figure 1), with the exception of the domain level, most reads were assigned to different taxonomic group or to the “no rank” group. Only 11.5% of the read were consistently assigned by Phymm and NBC to the same bacterial or viral taxa. Those reads consistently assigned kept some degree of uncertainty since they are differently assigned by the third method, and, more importantly, were assigned as“contaminants”while they would be considered as part of the commensal community.
In general, it is a good approach to take into account the reads consistently assigned to the same taxa by, at least, two programs but being careful with those assigned by Phymm and NBC but not by BLAST + LCA. One may consider that BLAST + LCA unassignment or
missassignment indicates the lack of a representative taxonomic unit in the reference databases, but still it should be taken carefully. Given the low consistency, a large fraction of the reads were assigned to different taxa by each program. The proportion of differently assigned reads correlated negatively with phylogenetic depth, from 11-13% at domain level to 57-79% at species level in real data (Figure 1). At domain level, Phymm tended to assign as viruses the reads that NBC assigns as bac-teria (Table 2), at phylum the most repeated confusions were observed in Cyanobacteria (Phymm) with Firmi-cutes (NBC), FirmiFirmi-cutes with Proteobacteria and Proteo-bacteria with Firmicutes (Table 2). The proportion of reads that are assigned to different taxa could be used as guiding information at phylum level but it should be taken carefully.
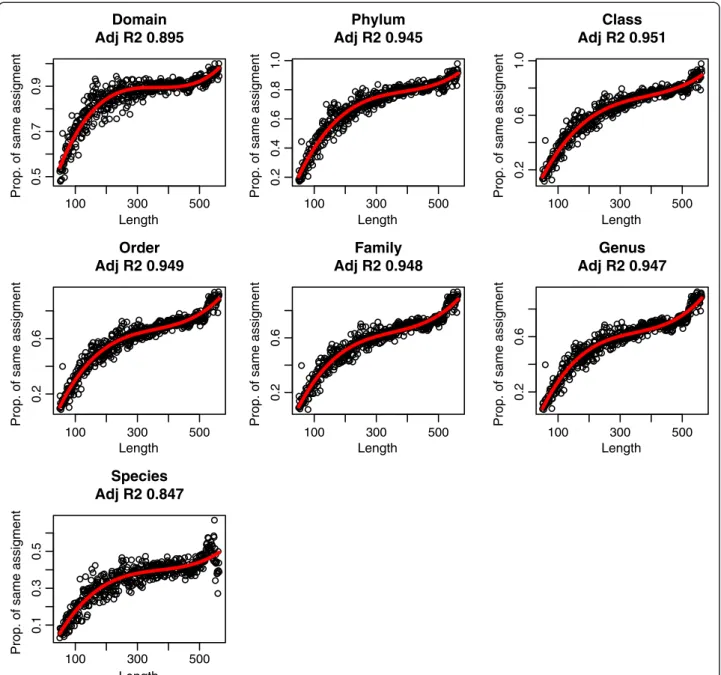
Effect of read length in consistency in real data
Although 88.7% and 86.1% of reads (in samples A and B, respectively) were assigned consistently at domain level and 76.9% and 71.9% at phylum, we observed a correl-ation between the consistency of the assignment and the read length (Figure 2). Combining both datasets and classifying them by size, we observe a tendency of im-proving consistency at lower taxonomic levels: to reach a 75% agreement by at least two approaches, a 83 bp length was needed at domain level, 254 bp at phylum, 355 bp at class, 430 bp at order, 440 bp at family and 448 bp at genus. Like in composition-based methods, in BLAST searches the limitation of assignment by read length has been previously suggested [14]. We extend this suggestion to all methodologies. Thus, in the design of metagenomic projects where proper assignment is crucial, these limitations should be taken into account to choose the sequencing platform in order to achieve the objectives of the study.
Performance of scores and cut-off values of each program in real data
PhymmBL provides a confidence score for assignments that, although it is not associated with a statistical sig-nificance, it is informative, and ranges from 0 (worst) to 1 (best) [7]. Since in one of the samples we kept the con-taminant reads (a sort of false positives), the average value given by PhymmBL of each category of reads at phylum level could be compared (Figure 3): the average for contaminant reads was 0.8413 (±0.0211), for reads assigned to different taxa by PhymmBL and NBC it was 0.8380 (±0.02712), for reads with no rank assignment at phylum it was 0.8316 (±0.0366) and for reads assigned to the same taxa it was 0.8375 (±0.0225). Surprisingly, the highest confidence value was associated to the con-taminant dataset. Differences between categories were statistically significant (ANOVA, p < 2 × 10⁻¹⁶).
On the other hand, one may use the“εvalue”as a cut-off value of consistency with BLAST + LCA. The com-bination of the Bayesian algorithm with the BLAST + LCA is performed in order to obtain more significant re-sults [6]. When anεvalue of 0 is used, without BLAST + LCA combination, almost all the reads are assigned in both samples at phylum level (Figure 4) and the number of assigned reads decreased similarly in both samples
with higherε values. In the combined BLAST + LCA +
Bayesian methods, when theεvalue is 0, only a third of the reads are assigned. Besides, regarding contaminants, the number of contaminant reads assigned decreases with theεvalue in the Bayesian classification. In the case of BLAST + LCA + Bayesian, contaminant reads were not classified at all. Then, it seems that the use of BLAST + LCA reduces the false-positive assignments as well as the overall assignments, and the use of ε value could be
omitted. In the case of only Bayesian assignment, the ε value is necessary. Based on previous studies, the recom-mendedεvalue is 10−5[6], at which point false positives match true positives. Therefore, a higher value ofεshould be used to increase sensitivity without increasing the false positive rate. For a conservative approach, an ε value of 10−10[6] is recommended, but it could be lower without raising the number of false positives at phylum level. In any case, the number of reads assigned to the same taxa by Phymm and NBC was almost similar regardless the ε value in the purely Bayesian approach and in the combined BLAST + LCA + Bayesian approach (Figure 4).
Conclusions
After analyzing the metagenomic assignment with three different approaches, since each one has its biases and uncertainties, the use and combination of different Table 2 Summary of assignments of reads that were not assigned to the same taxa by phymm and NBC
A sample B sample
Assigned by Phymm as Assigned by NBC as % Assigned by Phymm as Assigned by NBC as %
Domain Virus Bacteria 89.92 Virus Bacteria 87.5
Archaea Bacteria 3.57 Virus Archaea 4.6
Virus Archaea 2.69 Bacteria Virus 3.72
Bacteria Archaea 2.08 Archaea Bacteria 2.46
Bacteria Virus 1.74 Bacteria Archaea 1.65
Archaea Virus 0.06
Phylum Cyanobacteria Firmicutes 15.36 Proteobacteria Firmicutes 15.75
Firmicutes Proteobacteria 15.34 Firmicutes Proteobacteria 14.62
Proteobacteria Firmicutes 13.55 Cyanobacteria Proteobacteria 9.51
Cyanobacteria Proteobacteria 8.47 Proteobacteria Bacteroidetes 5.26
Firmicutes Super Bacteroidetes/Chlorobi group 3.91 Proteobacteria Cyanobacteria 4.85
Proteobacteria Super Bacteroidetes/Chlorobi group 3.56 Firmicutes Cyanobacteria 4.76
Proteobacteria Cyanobacteria 3.05 Cyanobacteria Firmicutes 4.26
Firmicutes Cyanobacteria 2.74 Proteobacteria Super Bacteroidetes/Chlorobi group 3.14
Firmicutes Fusobacteria 2.56 Firmicutes Super Bacteroidetes/Chlorobi group 2.93
Proteobacteria Bacteroidetes 2.16 Proteobacteria Actinobacteria 2.27
Class Bacilli Gammaproteobacteria 10.75 Alphaproteobacteria Gammaproteobacteria 6.43
Bacilli Clostridia 6.54 Gammaproteobacteria Bacilli 5.59
Gammaproteobacteria Bacilli 6.36 Bacilli Gammaproteobacteria 5.46
Bacilli Εproteobacteria 5.94 Gammaproteobacteria Betaproteobacteria 4.97
Gammaproteobacteria Betaproteobacteria 4.73 Gammaproteobacteria Alphaproteobacteria 4.38
Gammaproteobacteria Clostridia 4.33 Gammaproteobacteria Actinobacteria (class) 4.37
Negativicutes Bacilli 2.73 Alphaproteobacteria Betaproteobacteria 4.2
Bacilli Flavobacteria 2.65 Bacilli Εproteobacteria 3.71
Alphaproteobacteria Clostridia 2.5 Gammaproteobacteria Εproteobacteria 2.56
Bacilli Fusobacteria (class) 2.35 Gammaproteobacteria Clostridia 2.51
approaches is advisable, as it was advised in the use of gene prediction methods in metagenomic samples [15]. We recommend to use the reads consistently assigned to the same taxa by, at least, two methods, whereas the reads that are assigned to different taxa should be used with caution and taking into account the lack of consistency. New approaches performing a combination of methods, including Markov models, Bayesian and similarity-based algorithms may improve the confidence in taxonomic assignment, while the expansion of the reference databases will reduce the level of uncertainty.
Methods
Sampling
Two mouse skin samples were collected and processed according to the protocol we previously developed [16]. Mice belonged to the C57BL/6J strain, they were unre-lated and were euthanized according to a protocol ap-proved by a local IRB board (Parc de Recerca Biomèdica de Barcelona, Animal Research committee). DNA col-lected was then sheared by sonication using Bioruptor™ (Diagenode). 454™ libraries were prepared according to Zheng et al [17]. Sequencing was performed using an FLX Titanium platform. These samples were collected
100 300 500 0.5 0.7 0.9 Domain Adj R2 0.895 Length
Prop. of same assigment
100 300 500 0.2 0.4 0.6 0.8 1.0 Phylum Adj R2 0.945 Length
Prop. of same assigment
100 300 500 0.2 0.6 1.0 Class Adj R2 0.951 Length
Prop. of same assigment
100 300 500 0.2 0.6 Order Adj R2 0.949 Length
Prop. of same assigment
100 300 500 0.2 0.6 Family Adj R2 0.948 Length
Prop. of same assigment
100 300 500 0.2 0.6 Genus Adj R2 0.947 Length
Prop. of same assigment
100 300 500 0.1 0.3 0.5 Species Adj R2 0.847 Length
Prop. of same assigment
Figure 2Proportion of reads assigned to the same taxa by, at least, two methods according to length of reads at different taxonomic levels.The red line shows the polynomial regression.
as part of a larger project to analyze the skin microbiota in health and disease [16]. These two samples were used as validation for a new methodology produced in our la-boratory. Real data has been deposited to MG-RAST database (accession numbers 4496968.3 and 4496969.3).
Simulations
Three methods were chosen to simulate the metagenomic environments: first a customized perl script was con-structed to perform simulations based on expected rar-efaction curve slopes, maximum diversity H’ index, and maximum number of reads. This script generates metage-nomic datasets using the existing databases of reference genomes [18] and uses the H’ index and the expected slope of the rarefaction curve to design the metagenome. The script uses the following pipeline: according to the user-selected variables, the algorithm assigns the probabil-ities for each taxon to exist on the environment according to the H’index. With the expected number of reads and the maximum expected number of taxa on the environ-ment, the script constructs the line between point zero (0,0 co-ordinates in the diversity space) and the maximum sampling point (number of expected reads, number of ex-pected taxa). With the number of reads and the probabil-ity for each taxon to exist on the ecosystem, the algorithm calculates the maximum linear point of the rarefaction curve (the last point where the logarithm of species dis-covery per read is linear), and with those three points (point zero, maximum linear point, and maximum sam-pling point), the method fits the curve to the expected logarithmic equation. The script then randomly fragments the selected genomes with a fragment size range from 350-600bp and randomly samples the expected number of reads for each genome, according to the expected number of taxa on each point of the rarefaction curve and applies to each read the sequencing platform error rate (separat-ing both homopolymeric region modification and point mismatch). The script allows also to simulate environ-ments according to the maximum threshold of sequences for one species. In this case, four diversity scenarios were simulated, each one with 60,000 reads, since in real data the average number of reads was around 60,000: “All genomes” set, where bacterial and viral genomes were used and the maximum relative amount for species was 5%; “All genomes (dominant)” set, where bacterial and viral genomes were used and the maximum relative amount for a species was 80%; “Bacterial genomes” set, where only bacterial genomes were used and a maximum relative amount of 5%; and“Bacterial genomes (dominant)”, where only bacterial genomes were used with a maximum relative amount of 80%.
To test the consistency of results obtained by our script, four simulations were constructed using Metasim [13] using the default 454 generation option (Lognormal Distribution Mean: 0.23; Lognormal Distribution Std. Deviation: 0.15; Proportionality Constant for Std. Deviation: 0.15) and two simulations with iMESS using the following conditions: Method A (Species Selection) including all bacterial phyla to the selection without selection of gen-ome size of GC content. We limited the most abundant
0.832
0.834
0.836
0.838
0.840
PhymmBL score (B sample)
Match type
Score
cont diff norank same
n=39114 n=24109 n=14725 n=26813
Figure 3Mean and 95% of confidence interval of PhymmBL results in real sample B by each category at phylum level.Cont, contaminant reads (false positives); diff, reads assigned to different taxa by Phymm and FCP; norank, reads assigned to species with no rank at phylum; same, reads assigned to the same taxon.
0 2 4 6 8 10 12 0.0 0 .2 0.4 0.6 0.8 1.0
fraction of reads assigned
–log10(ε)
Figure 4Performance of two programs implemented in fragment classification package in different combinations and conditions at phylum level.NBC, Naïve Bayesian Classifier; LCA + NBC, combination of results from LCA based on BLAST search and
Naïve Bayesian Classifier. The optimalεvalue suggested by the
species to 100 individuals. Given that our script used a logarithmic distribution, the same model was used for iMESS, with base e. We selected the 454 platform as se-quencing method, with the Titanium read size (150-650 with mean at 350 and normal distribution) and an ex-pected read count of 50K (equivalent to 1/16th of a plate).
The features and genomes and number of reads of the six simulated datasets are shown in Additional file 1: Tables S2, S3 and S4. The synthetic and simulated datasets are provided in Additional files 4 and 5.
Finally, a set with synthetic genomes was built and analyzed. Three synthetic genomes were built based on Burkholderiales, Desulfovibrio and Thermacea known genomes, and coding regions were simulated through a hidden-Markov model-based sequence generation, using a custom script (Garcia-Garcerà, M, manuscript in preparation).
Informatic analyses
To assess the specificity and consistency of the different programs, simulated data were used. In real data, reads from the host were removed from the two metagenomic samples of mouse (NBCI37/mm9 genome version) skin using Deconseq [19] with the default options and retaining bacterial/viral reads. For the latter, Deconseq uses the genomes of bacteria and viruses described in Additional file 1: Table S4, to calculate the read coverage and alignment identity that is used to classify a specific read as contaminant. Moreover, to measure the effect of contaminants in metagenomic sequence assignment, the reads assigned as contaminants were used to construct an additional dataset. In total, 60,488 reads in Sample A, 65,647 in Sample B and 39,114 in the Contaminant dataset were analyzed. Overall, average read length was 374 bp.
BLAST [20], Phymm [7] and Naïve Bayesian Classifier implemented in FCP [6] were used to assign the metage-nomic reads in simulated and real data. BLAST searches were carried out against a custom database constructed using the following method: reference bacterial and viral genomes and draft genomes were downloaded from the NCBI FTP repository and concatenated in a single file. The Fasta file including all genomes was formatted using the formatdb software included in BLAST. This database was used for all BLAST queries (Additional file 1: Table S4). Results from BLAST were parsed with a Lowest Common Ancestor (LCA) script implemented in FCP, using a cutoff e-value of 10−5. In addition, Phymm and NBC were trained with the same bacterial and viral data (Additional file 1: Table S4). The results of both programs were improved using BLAST results (PhymmBL and NB + BLAST pro-grams, respectively). In addition, BLAST + LCA and Bayesian Classifiers were parsed with FCP using different ε-values (from 0 to 10−12).
The assignment of each read by the different programs was compared to calculate the consistency of metage-nomic assignments. The read were classified according to the number of programs that produced the same taxo-nomic assignment. In some cases, such as phyla in viruses, a particular taxonomic level may not exist. Such situations were labeled as “no rank”. Homemade scripts written in PHP and Python were used to perform these comparisons. The sensitivity (number of correct assignments/number of sequences in the data set) and precision (number of cor-rect assignments/number of assignments made) were cal-culated as in [2]. These two parameters were applied to each method used and to the combined assignment. These scripts are available at https://github.com/koldogar-cia/metagenomics.
The graphical representation of results and statistical analyses were performed with the R language [21].
Additional files
Additional file 1: Table S1.Descriptive and diversity parameters of each simulated dataset.Table S2.Sensitivity and precision in simulated
datasets generated by MetaSim.Table S3.List of genomes and number
of reads used in each simulated dataset.Table S4.List of genomes used to build BLAST database and to train Phymm and NBC.
Additional file 2: Figure S1.Number of reads assigned in each taxonomic level in simulated data according to true positives and false positives.
Additional file 3: Figure S2.Number of reads assigned in each taxonomic level in simulated data generated by Metasim.
Additional file 4:Simulated and synthetic sequences generated using our scripts in FASTA format, and their keys.
Additional file 5:Simulated sequences generated using iMESS in FASTA format, and their keys.
Competing interests
The authors declare that they have no competing interests.
Authors’contributions
KGE, MGG and FC conceived the work. KGE performed the analyses. MGG provided the real metagenomic data, and wrote the simulation script. KGE wrote the manuscript, with revisions and contributions by MGG and FC. All authors read and approved the final manuscript.
Acknowledgements
We would like to thank Juan Martín-Caballero for the skin sample donation. This work was financed by the MICINN (Spanish Ministry of Science and Innovation) grant SAF2010-16240. MGG was supported by a predoctoral fellowship from MICINN.
Received: 7 May 2013 Accepted: 22 March 2014 Published: 28 March 2014
References
1. Wooley JC, Godzik A, Friedberg I:A primer on metagenomics.PLoS Comput Biol2010,6:e1000667.
2. Bazinet AL, Cummings MP:A comparative evaluation of sequence
classification programs.BMC Bioinformatics2012,13:92.
3. Rosen GL, Polikar R, Caseiro DA, Essinger SD, Sokhansanj BA:Discovering the unknown: improving detection of novel species and genera from short reads.J Biomed Biotechnol2011,2011:495849.
4. Meyer F, Paarmann D, D’Souza M, Olson R, Glass EM, Kubal M, Paczian T, Rodriguez A, Stevens R, Wilke A, Wilkening J, Edwards RA:The
metagenomics RAST server - a public resource for the automatic phylogenetic and functional analysis of metagenomes.BMC Bioinformatics2008,9:386.
5. Huson DH, Auch AF, Qi J, Schuster SC:MEGAN analysis of metagenomic data. Genome Res2007,17:377–386.
6. Parks DH, MacDonald NJ, Beiko RG:Classifying short genomic fragments from novel lineages using composition and homology.BMC Bioinformatics 2011,12:328.
7. Brady A, Salzberg SL:Phymm and PhymmBL: metagenomic phylogenetic
classification with interpolated Markov models.Nat Methods2009, 6:673–676.
8. Mavromatis K, Ivanova N, Barry K, Shapiro H, Goltsman E, Mchardy AC, Rigoutsos I, Salamov A, Korzeniewski F, Land M, Lapidus A, Grigoriev I, Richardson P, Hugenholtz P, Kyrpides NC:Use of simulated data sets to evaluate the fidelity of metagenomic processing methods.Nat Methods 2007,4:495–500.
9. Belda-Ferre P, Alcaraz LD, Cabrera-Rubio R, Romero H, Simón-Soro A, Pignatelli M, Mira A:The oral metagenome in health and disease.ISME J 2012,6:46–56.
10. Donia MS, Fricke WF, Ravel J, Schmidt EW:Variation in tropical reef symbiont metagenomes defined by secondary metabolism.PLoS One 2011,6:e17897.
11. Suen G, Scott JJ, Aylward FO, Adams SM, Tringe SG, Pinto-Tomás AA, Foster CE, Pauly M, Weimer PJ, Barry KW, Goodwin LA, Bouffard P, Li L, Osterberger J, Harkins TT, Slater SC, Donohue TJ, Currie CR:An insect herbivore microbiome with high plant biomass-degrading capacity.PLoS Genet2010,6(9):e1001129. 12. Swanson KS, Dowd SE, Suchodolski JS, Middelbos IS, Vester BM, Barry KA,
Nelson KE, Torralba M, Henrissat B, Coutinho PM, Cann IKO, White BA, Fahey GC:Phylogenetic and gene-centric metagenomics of the canine intestinal microbiome reveals similarities with humans and mice.ISME J 2011,5:639–649.
13. Richter DC, Ott F, Auch AF, Schmid R, Huson DH:MetaSim: a sequencing simulator for genomics and metagenomics.PLoS One2008,3:e3373. 14. Wommack KE, Bhavsar J, Ravel J:Metagenomics: read length matters.
Appl Environ Microbiol2008,74:1453–1463.
15. Yok NG, Rosen GL:Combining gene prediction methods to improve
metagenomic gene annotation.BMC Bioinformatics2011,12:20. 16. Garcia-Garcerà M, Garcia-Etxebarria K, Coscollà M, Latorre A, Calafell F:A
new method for extracting skin microbes allows metagenomic analysis of whole-deep skin.PLoS One2013,8:e74914.
17. Zheng Z, Advani A, Melefors Ö, Glavas S, Nordström H, Ye W, Engstrand L, Andersson AF:Titration-free 454 sequencing using Y adapters.Nat Protoc 2011,6:1367–1376.
18. Nelson KE, Weinstock GM, Highlander SK, Worley KC, Creasy HH, Wortman JR, Rusch DB, Mitreva M, Sodergren E, Chinwalla AT, Feldgarden M, Gevers D, Haas BJ, Madupu R, Ward DV, Birren BW, Gibbs RA, Methe B, Petrosino JF, Strausberg RL, Sutton GG, White OR, Wilson RK, Durkin S, Giglio MG, Gujja S, Howarth C, Kodira CD, Kyrpides N, Mehta T,et al:A catalog of reference genomes from the human microbiome.Science2010,328:994–999. 19. Schmieder R, Edwards R:Fast identification and removal of sequence
contamination from genomic and metagenomic datasets.PLoS One2011, 6:e17288.
20. Altschul SF, Madden TL, Schaffer AA, Zhang JH, Zhang Z, Miller W, Lipman DJ: Gapped BLAST and PSI-BLAST: a new generation of protein database search programs.Nucleic Acids Res1997,25:3389–3402.
21. R Core team:R: A Language and Environment for Statistical Computing. Vienna, Austria: R Foundation for Statistical Computing; 2012.
doi:10.1186/1471-2105-15-90
Cite this article as:Garcia-Etxebarriaet al.:Consistency of metagenomic assignment programs in simulated and real data.BMC Bioinformatics
201415:90.
Submit your next manuscript to BioMed Central and take full advantage of:
• Convenient online submission
• Thorough peer review
• No space constraints or color figure charges
• Immediate publication on acceptance
• Inclusion in PubMed, CAS, Scopus and Google Scholar
• Research which is freely available for redistribution
Submit your manuscript at www.biomedcentral.com/submit