University of Nebraska - Lincoln University of Nebraska - Lincoln
DigitalCommons@University of Nebraska - Lincoln
DigitalCommons@University of Nebraska - Lincoln
CSE Conference and Workshop Papers Computer Science and Engineering, Department of 2005
An Empirical Study of Fault Localization for End-User
An Empirical Study of Fault Localization for End-User
Programmers
Programmers
Joseph R. Ruthruff
University of Nebraska-Lincoln, [email protected] Margaret Burnett
Oregon State University, [email protected] Gregg Rothermel
University of Nebraska-Lincoln, [email protected]
Follow this and additional works at: https://digitalcommons.unl.edu/cseconfwork Part of the Computer Sciences Commons
Ruthruff, Joseph R.; Burnett, Margaret; and Rothermel, Gregg, "An Empirical Study of Fault Localization for End-User Programmers" (2005). CSE Conference and Workshop Papers. 124.
https://digitalcommons.unl.edu/cseconfwork/124
This Article is brought to you for free and open access by the Computer Science and Engineering, Department of at DigitalCommons@University of Nebraska - Lincoln. It has been accepted for inclusion in CSE Conference and Workshop Papers by an authorized administrator of DigitalCommons@University of Nebraska - Lincoln.
An
Empirical
Study of Fault
Localization for
End-User
Programmers
Joseph
R.
Ruthruff
Department
of
Computer Science
and
Engineering
University of
Nebraska-Lincoln
Lincoln, Nebraska
68588-0115
Margaret Burnett
School
of
Electrical
Engineering
and
Computer Science
Oregon State
University
Corvallis,
Oregon
97331-3202
Gregg
Rothermel
Department of Computer
Science
and
Engineering
University
of
Nebraska-Lincoln
Lincoln, Nebraska 68588-0115
ABSTRACT
End usersdevelop more software than any other groupof program-mers,using softwareauthoring devices suchase-mailfiltering ed-itors, by-demonstration macro builders, and spreadsheet
environ-ments. Despitethis, there has been little researchonfindingways to help these programmers with the dependability of their soft-ware. We have beenaddressingthisproblem in several ways,one
of which includessupportingend-userdebuggingactivitiesthrough
fault localizationtechniques. This paper presents the results ofan
empirical study conducted in anend-user programming
environ-ment toexamine theimpact oftwoseparatefactors in fault local-izationtechniquesthat affecttechniqueeffectiveness. Our results shed new insights into fault localizationtechniques for end-user programmersand the factors that affectthem,withsignificant im-plications for the evaluation of thosetechniques.
Categories
and
Subject Descriptors
D.2.5 [SoftwareEngineering]: Testingand
Debugging-debug-gingaids, testingtools;D.2.6 [SoftwareEngineering]: Program-ming Environments-interactive environments; H.4.1 [Informa-tionSystemsApplications]:
OfficeAutomation-spreadsheetsGeneral
Terms
Experimentation,Verification
Keywords
faultlocalization,debugging,end-user softwareengineering,
end-userprogramming
1.
INTRODUCTION
Aquietparadigmshift isoccurringinthe world of software. Not long ago,mostsoftwarewasdevelopedby"professional"
program-*Work
performedatOregonStateUniversity,Corvallis, OR,USA. Permissiontomake digitalorhardcopiesofallorpartof this work forpersonalorclassroomuseisgrantedwithout feeprovidedthatcopiesare notmadeordistributed forprofitorcommercialadvantageand thatcopies
bear this notice and the full citationonthe firstpage. To copyotherwise,to
republish,toposton servers ortoredistributetolists,requirespriorspecific
permissionand/orafee.
ICSE'05,May15-21,2005,St.Louis,Missouri,USA. Copyright2005 ACM1-58113-963-2/05/0005...$5.00.
mers.Today,however, end users write far moresoftware than pro-fessional programmers: it is estimatedthat, in 2005 in the United Statesalone, 55 million end users, compared to only2.75 million professional programmers [8], will be creating software such as multimediasimulations, dynamic web pages, e-mail filtering rules, andspreadsheets.
Do these programmershaveadequate support? Evidence sug-geststhatthey do not. Boehm and Basili observethat 40-50% of the softwarecreated by end users contains non-trivial faults [9]. These faults canbeserious, in some cases costing millions of dol-lars[14, 20, 24].
Aproblem for thesoftwareengineering community, then, is to provide endusers withbetter support fortheir software develop-mentactivities. Forexample, end users, likeprofessional program-mers,needstrategiesforimproving the dependabilityoftheir soft-ware,such astesting and anomaly detection methodologies to help them detectfailures,
andfault
localizationtechniques to help them find thecausesof failures. The latter isourfocus in this paper.Softwareengineeringresearchershaveinvested considerable ef-fort intobringingfault localizationtechniquestoprofessional pro-grammers (e.g., [2, 10, 13, 15, 17, 23, 31]), and similar efforts,
directedatthe needs of end users, could beworthwhile. How-ever, significant differences exist betweenprofessional and
end-usersoftware development, and these differences have ramifica-tions for anysuch efforts.
First,endusersrarelyhaveknowledgeof softwareengineering methodologies,andareunlikelytotake thetimetoacquire it. Tra-ditionalfault localizationtechniquesoftenassumethat their users haveatleastsomeknowledge of software engineering in order to properlyemploy the techniqueorunderstand itsfeedback. (As re-search[7, 12]explains, understandingis criticaltotrust,whichin turniscriticalto usersactuallybelievingasystem's output and act-ing uponit.)Suchtechniquesmaybe unsuitable for end users.
Second,end-userprogramming environmentsareusually mode-less and interactive:usersincrementallyexperimentwiththeir
soft-wareandseehow the results workoutafter each change. Fault localizationtechniquesthatrelyonbatchprocessing (e.g., [2]) are
inconsistentor evenincompatiblewiththesetypesofenvironments.
Third,endusersdo notusually possess organized test suites, so largeamountsoftesting-derived data are rarely available for use in end-userenvironments. Complicatingthesituation is the interac-tivenatureof end-userdebugging: when endusersobservea
fail-uretheyoftenbegindebugging immediately-notafterrunning
severaltests-atwhichtime the system may have little
informa-tion with whichtoprovidefeedback.Thus,afault localization
tech-27th International Conference on Software Engineering, 2005. ICSE 2005. Proceedings. Digital Object Identifier: 10.1109/ICSE.2005.1553578
niquethatrequireslargeamountsof data
(e.g., [15])
maybeinap-propriatefor endusers.
Fourth,evidenceshows that endusersoften make mistakes when
performinginteractivetestinganddebuggingtasks[27].
(Profes-sional programmers errtoo, of course, but their
understanding
of testing processes may render them less error-prone than endusers.) Unfortunately, many faultlocalization techniques (e.g.,[17]) can-notoperateeffectivelywithsuch unreliable information.Wehave beenworkingtobringfault localization supporttoend
usersin ways thataccommodate theforegoingconsiderations. Our previous work [26, 27] shows that this supportcanhelp endusers
find faults by leading themtoemploy moreeffective debugging strategies.However,ourresults also showthat,attimes,somefault localizationtechniquesare noteffective. Analysisof thecasesin which thetechniquesare noteffective suggests that thereare
ac-tually twodistinctfactorsinvolved intechnique designthatcould be impacting theirperformance. The first factor-information base-referstothe type of information maintainedbyatechnique
and iscommonly the subject of the research literatureonfault lo-calization. The second factor-mapping-referstothe way in whichatechnique maps theinformation into feedback,including
both thecalculation of this feedback using the information pro-vided by theinformation base, anddisplayingthe feedback ina
manner that iscompatible with the surroundingenvironment. Sur-prisingly, comparedto theinformation basefactor, thismapping
factor has receivedscantattention in the research literature.
Fur-ther, inoursearch of the literaturewe canfindnopreviouswork that hasseparated theimpactof thesetwofactorson afault local-izationtechnique'seffectiveness.
Thiswork makes four contributions. First, weempirically in-vestigate the impact of both information base andmappingon the
effectiveness of fault localizationtechniques. Our results indicate thateach factorsignificantlyimpactseffectiveness; thus,both must beconsidered whendeveloping fault localizationtechniques. Sec-ond, we add to the end-user software engineering literature by pro-viding empirical dataonthree information bases and three map-pings that can be used in techniques for end-user programmers. Third, we provide insightsinto the way in which interactivefault localization effectivenessshould be measured-insightsthat have implications for futureempirical evaluations of end-user fault lo-calization techniques. Fourth,we add to the growingbody of ev-idence that end users make mistakes when performing interactive testing anddebuggingtasks, which has implications forthe types oftechniques that maybe suitable for end-user programmers.
2.
BACKGROUND: WYSIWYT
Our fault localizationtechniques areprototyped in the
spread-sheetparadigmin conjunctionwith our"What You See Is What
You Test"(WYSIWYT) testing methodology [25],whichwebriefly
describe here. Figure 1 presents an example ofWYSIWYT in
Forms/3[11],aspreadsheet language utilizing "free-floating"cells
in additiontotraditionalspreadsheet grids. WYSIWYT's underly-ing assumptionisthat,as a userincrementally developsa
spread-sheet,heorshe is alsotesting incrementally.Because theintended
audience is endusers,all communication isperformed through
vi-sual devices. InWYSIWYT,untested cells that havenon-constant formulasaregivenared border(lightgray in thispaper). (Cells
whose formulasaresimplyconstantsdonotparticipate in
WYSI-WYTdevices,since theassumptionis thattheydonotneedtobe
tested.) The borders of such cells remain red untilthey become
more"tested".
Forcellstobecomemoretested, tests mustoccur. Thesetests
can occuratanytime-intermingledwith formulaedits, formula
additions,andso on. Theprocessisasfollows. Wheneverauser
noticesacorrectvalue,heorshecanplaceacheckmark (A/)in the
decision boxatthecornerofthecellobservedtobecorrect: this
testingdecisioncompletesasuccessful "test". Checkmarkscan in-creasethe"testedness"ofcells, which is reflected by addingmore
bluetocellborders(moreblack in thispaper). Further,becausea
correctvalue inacellcdependsonthecorrectnessof the cells
con-tributingtoc,thesecontributingcellsparticipatein c'stest.
WYSI-WYTtestedness colors reflect theuseofadataflowtestadequacy criterion thatmeasuresthe interrelationships in thesourcecode that
have been coveredby the user'stests.
Inadditiontothecell level, WYSIWYT providesuserfeedback
about testednessattwoothergranularities. A "percenttestedness" indicator providestestedness feedbackatthe spreadsheet
granu-larity. Testedness feedback is also availableatafiner granularity
throughthe colors ofdataflowarrows,whichcanbe shownatthe cell leveloratthesubexpression level. Thesystemalsoprovides
testedness feedbackthroughanintelligent explanationsystem[33],
implemented via"on-demand"tooltips that displaythetestedness
ofanyspecifiedcellordataflow relationship.
3. ADDING FAULT LOCALIZATION
FOR
END
USERS
Most fault localizationsupport attempts tohelpprogrammers
lo-catethecauses offailuresintwoways: (1) by indicatingthe
ar-187.5
1
94.12 1Z6
sZ
I
15.03
Qulz1 QuIz2 QuIz3 QuIz4 QuIz5
QuIz-,Avg
171
7r1.7172
"ff
ILo
1-
IZ58Mitarm1
M1tetn11_P9rc
Mklterm2
Mldtnn3
vg1120
1
FI2.191
n S.6363N
Firxl
Firl_Fercentage
Exarn_Avg
Course-Avg
Caurse_Grade
87.5
194.12
_Z
Z
°5.03
Quizl Quiz2 QuIz3 Quiz4 QuIz5 QuizAvg
171
1
- 1 73Ho°
I_
Mrdtemin
Mlsrm1_Pe
Mdbn2
b M Werm3Curved_MWtrm3
Midtrk_Avg
Flna
-0._e5e
- Ce CFiral
Fina!_Percentage
Exam-Avg
Course-MAg
Course_Grde
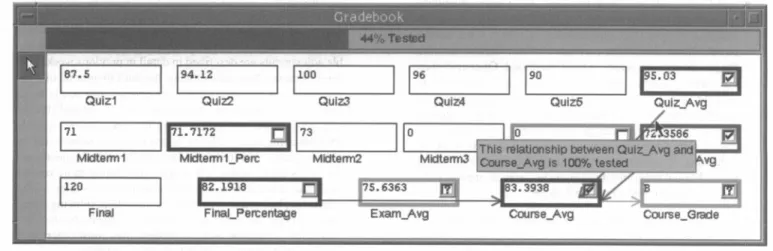
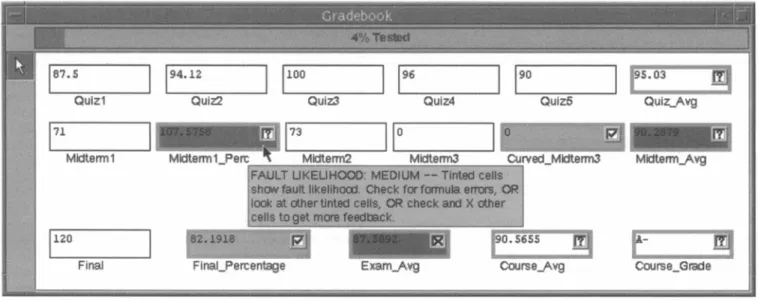
Figure2: An example offault localization in theForms/3spreadsheet environment.
easthatshould be searched for faults, thereby reducing the search space;and (2) byindicating the areas most likely to contain faults, therebyprioritizingthe sequence ofthesearch through this space.
Inourprototype, WYSIWYT serves as a springboard for fault localization: insteadof noticing that a cell's value is correct and placing a checkmark, a user might notice that a cell's value is in-correct (a failure) and place an "X-mark". In Figure 2, the user notices an incorrect value in ExamAvg-the value is too
high-andplacesanX-mark in thecell's decision box.
X-markstrigger afault likelihood calculation for each cell (with
a non-constantformula)thatmight have contributed to the failure. Faultlikelihood, updated for each appropriate cell after any testing decisionorformula edit, is represented by coloring the interior of suspect cells inshadesof red (gray in this paper). This serves our firstgoal ofreducing the user's search space. As thefault likelihood of a cellincreases,thesuspect cell is colored inincreasingly darker shades of red(gray). The darkest cellsareestimatedto bethe most likelytocontain thefault, and arethebest candidates for the user toconsider in debugging; this serves our second goal of helping endusersprioritize their search.(Thisapproach is generalizable to paradigms other thanspreadsheets [27].)
We have previously developed three techniques for realizing this support[26],whichwebrieflysummarize here.
* TestCount. Thetechnique weterm"TestCount" maintains, for each cell c, the number offailed tests (i.e., X-marks) and passed tests(i.e., checkmarks) in which c has partici-pated. Thesefailedtestsincrease c's faultlikelihood, while thepassedtestsdecrease c's fault likelihood. Ofcourse, there arevarying schemes that suchatechnique coulduse to de-cide thedegree to whichfailed andpassedtestsimpact fault likelihoodfeedback; in this paper,the TestCountTechnique uses the schemefrom our previous work [26] in whichtwo
passed tests were necessaryto counteracttheeffects ofone
failed test. TARANTULA [15], a faultlocalizationtechnique for traditionalprogramminglanguages,uses anapproach that is similar to ourTest Count Technique.
* Blocking. The "Blocking Technique"includes notonly failed andpassedtests, but also whethertests areblockedfrom a
cell c by one ormore other tests. (Atestt, can "block" anothertestt2fromaffectingthe fault likelihoodofcifall
dataflow from ctothe cellin which the t2 testing decision was made goes through the cellin which the
t,
testing de-cisionwasmade.) This isaccomplished bymaintaining, for each cell c, (1) information on the tests to which that cell contributes, and (2) dataflow informationtodetermine which of thosetests areblocked andunblocked from the cell. Un-like in the Test Count Technique, only the failedtests that are notblocked from cincrease c's faultlikelihood, while only the passedteststhatare notblocked from cdecrease c's faultlikelihood. Aswith TestCount, there are many possi-ble schemes to control theimpactoffailed and passedtestsonfault likelihood feedback. The Blocking Technique in this paper uses the schemefromourprevious work[26] that
re-quired two passedtests to counteracttheeffects ofonefailed test. Programdicing [17]uses anapproach that is similarto
ourBlockingTechnique.
* Nearest Consumers. Wedesigned the"NearestConsumers Technique" to be a low-costalternativeto the othertwo tech-niques, whose maintenance of all testing history for each spreadsheet cell maycome at toogreatacostasspreadsheet size increases. Nearest Consumers isagreedytechniquethat
considers onlythedirect consumers of a cell c(i.e., those cells connected withcdirectly byadataflow edge). The fault likelihoodof c is first estimated by computing the average fault likelihood of c's directconsumers (if any). This
av-erage fault likelihood is thenadjusted basedonthe current testing decisions forcand c's direct consumers. The possi-ble adjustments are described in detail inpreviouswork[26]. To summarize theseadjustments, the fault likelihood ofc in-creasesif c or c's directconsumerscontainsufficiently more failed tests than passedtestsusing aset of defined thresh-olds [26]- the motivation being thatareasinthe spread-sheet showingmany failures(failed tests) are morelikelyto
contain faults. Similarly, the faultlikelihood of c decreases
if c or c's direct consumers containsufficientlymorepassed tests than failed tests using a set of definedthresholds-the
motivationbeing that areas in the spreadsheetshowing many successes(passed tests)arelesslikelytocontain faults. This "discount"technique is more modest than most other fault localizationtechniques describedin the literature.
Ourprevious empirical work [26,27] shows that these three fault
localizationtechniquescanprovide feedback that is useful to end users. However, the work also suggests thattwoseparatefactors, oneofwhose impact on fault localization has not been studied be-fore, might impact technique effectiveness. This paper investigates thispossibility.
4.
EXPERIMENT
Anyfault localization approach that includes someform of re-porting or feedback to a human involvestwofactors:
* Information Base: To support the behavior ofafault local-ization technique,information must be stored and maintained eitherby the technique or by the surrounding environment. Toabstract awayimplementationoralgorithmicdetails such asdata structures, we use this term to refer only to the type of information used and the circumstances under which it is maintained.
* Mapping: Mappingstransforminformationbasesintofault
localization feedback.This transformation involves both
cal-culatingacell'sfault likelihood usingthe information pro-vided by the information base, and thentransforming that
calculationintoappropriate feedbackfortheuserina manner
that is consistent withthegoals of thetechniqueand compat-ible with thesurrounding environment.
Forexample, TARANTULA [15] uses a set offailedand passed tests,and coverageinformationindicating the program points
con-tributingtoeach test,asitsinformation base.Itsmappingusesthis information to calculate (1) a colorrepresenting each statement's
participation intesting,and(2) thetechnique's confidence in the correctnessofeach color.(TARANTULAcolors statements because these types of visualizationsare compatiblewith thetechnique's surroundingenvironment.)
Togaininsight intotheimportanceof eachfactor,weinvestigate
thefollowing research questionsfor end-userfault localization:
RQl:
Dodifferencesin information basesimpact effectiveness?RQ2: Dodifferencesinmappingsimpact effectiveness?
RQ3: Does inaccurate information impact informationbases and effectiveness?
Onereason toinvestigate RQIis that fault localization research often focusesoninformationbases. Ifthis factor affectstechniques' effectiveness in interactive programmingenvironments, then end
usersmaybenefit from research thatfocusesonprofessional pro-grammers.
Previous faultlocalizationresearchoftenevaluates techniques as
awhole,withoutconsideringthespecificfactors that contributeto
observed results. We devisedRQ2becausewesuspectthat
map-ping alone could be an important factor in determining a
tech-nique'seffectiveness.
Our third researchquestionwasinspired bytheunreliabilityin interactive end-usertesting that we have seen in previous empirical work[27].Thisquestionfocuses oninformation bases because it is specificallytheinformationbase that iscorrupted by suchmistakes.
4.1
Design
Informulatingourexperiment,weconsidered three methodolo-gies for gatheringsourcesof data. Thefirst methodology involves following the classic human-subjects approach: gather participants for the ninepossiblemappingandinformation base combinations
and compareeffectivenessacross groups. This methodologyhas
the advantage of eliciting test suites from real end users, but it has twodrawbacks.First, for proper statistical comparison, it would
re-quireaninordinately large number of subjects. Second, since each
techniquewould be given different testing actions, it would be very difficulttocontrol for the fact that differences in test suites might causedifferences in results.
The secondmethodology involves following a classic test suite
generationapproach: generate hypothetical test suites according to somecriterion, and select (randomly or according to other criteria)
testsfromthesetestsuitestosimulate end users' testing actions. A drawbackof this approach is that the test suites thus created could notbe tied to our ultimate users, and may not be representative of real end-user testing actions.
The third methodology involves obtaining testing actions from realend users, and then uniformly applying these actions across all information base and mapping combinations. This third method-ology avoids the drawback of requiring an inordinate number of subjects. It alsohas the advantages of using testing actions repre-sentative of those performed by real end users, and of measuring each technique'sability to provide feedback given the same testing actions. This latter advantage avoidsconfounding differing tech-niques withdiffering test suites.
We thus chose the third methodology. We obtained the required testing actions from 20end-userparticipants: 18 undergraduate students and twograduatestudentsfromOregon State University without personal orprofessional programming experience. The
testsuites,asdefinedby the testing actions that the end users
per-formed,werethus the"subjects" of our experiment.
4.2
Materials
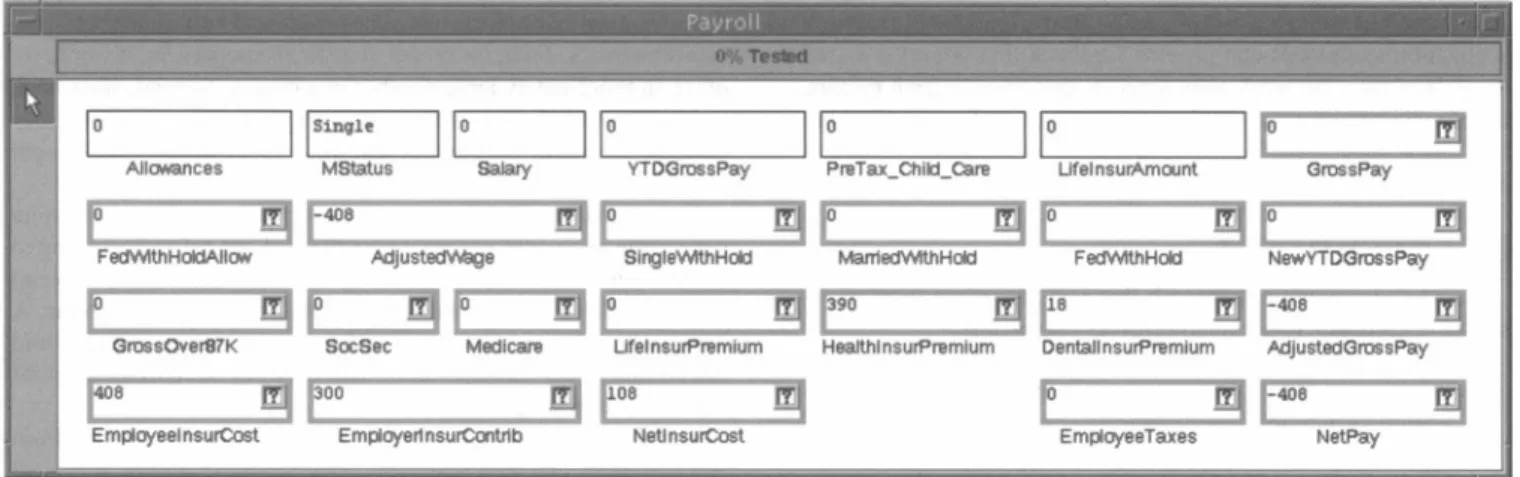
The experiment utilized two spreadsheet tasks, Gradebook and
Payroll (shown in Figures 2 and 3, respectively). To make our
spreadsheetsrepresentative of real end-user spreadsheets,
Grade-book wasderived fromanExcelspreadsheetof an (end-user) in-structor,whichweported intoanequivalent Forms/3 spreadsheet.
Payroll was aspreadsheet designed by two Forms/3 researchers
fromapayrolldescriptionfrom a real company.
Thesespreadsheetswereseeded withfive faults created by real end users. To obtain these faults, we provided three separate end userswith (1)a"template" spreadsheetfor each task with cells and cell names, butnocellformulas;and(2)adescription of how each spreadsheet should work, which included sample values and correct results for some cells. Each person was given as much time as he
orshe needed todesign the spreadsheet using these materials. From thecollection of faults left by the end users, we chose
fivethatprovided coverage of the categories in Panko's
classifi-cationsystem[21], which isbased on Allwood's classification
sys-tem [4]. Under Panko's system, mechanical faults include simple
typographicalerrorsor wrongcell references. Logical faults are mistakes in reasoning and are more difficult to detect andcorrect
thanmechanicalfaults. An omission fault isinformationthat has
neverbeen entered into a cell formula, and is the most difficult to
detect [21].Weseeded Gradebook with three mechanical faults,
onelogicalfault,andoneomission fault, and Payroll with two mechanicalfaults, two logical faults, and one omission fault. Pay-rollwasintended to be themoredifficult spreadsheet due to its larger size, greater level of dataflow and intertwined dataflow rela-tionships, andmoredifficult faults.
4.3 Dependent Variable and Measures
As adependent variable,werequireameasure of a fault localiza-tion technique'seffectiveness. Many such measures are possible.
AJIaoences M8tdtus Saiary YTOGrossPay PruTax-Chik_Cae LUfeinsurAmount GrossPay
FsdW¶ihHol1JloN AdJustMag9e SingIeWthHc4 Maed1VMthHokd FediIhHckJ NewYTDGrussPay
_- op 90
Iq
0__400
GmssOvers?K Soceoc Mdlcum LtreinsurPmumium HealthlnsurPremium DentaJlnsurPmmium MAJustdOrusePay
[we
n
POO
108
me
4m
EmpoyeselnsurCost EmpiayerinsurCcrnrb NstinsurCost EmpiyeeTaxes NstPay
Figure 3: The Payroll task. point out faults by applying identicaltestsuitesuniformly. Thus,
wedefine
effectiveness
as a technique'sability tocorrectlyand vi-sually differentiate the correct cells in aspreadsheet from those cells thatactually containfaults.Using thisnotion, we chose to measure effectiveness in terms ofthevisual separation between the faulty cells and the correct cells of each spreadsheet. Our previous work[27] indicated that usersusually restrict their attention during debugging only to the cells indicated in the fault localization feedback (i.e., the colored cells). Given thisfinding, in thisexperiment, we decided to focus our measureonlyonthecells colored by the technique.
LetFaultyCells(AvgFL) be the average faultlikelihood of col-ored faulty cells. Let CorrectCells(AvgFL) be the average fault likelihood ofcolored correctcells. Theformula to calculate ef-fectiveness accordingtothismeasureis then:
Eff=FaultyCells(AvgFL) - CorrectCells(AvgFL)
Subtraction is used instead ofcalculatingaratiobecause the color choicesformanordinal, not a ratio, scale. Positive effectiveness is preferable, and a greater effectivenessimpliesa better distinction betweenfaulty andnon-faulty cells.
4.4 Points of
Evaluation
Atwhat point should we measure effectiveness? Many tradi-tional techniques report feedback only at the end of a batch pro-cessing ofinformation. This point of maximal system reasoning potential - when the system has its best (and only) chance of producingcorrectfeedback-istherefore the appropriate point at which to measure the effectiveness of these techniques. Given the interactive nature of end-userenvironments, however, debugging, and therefore fault localization use, occur not just at the end of test-ing, butthroughoutthe testing process. Measuring effectiveness only at the end of testingwould thus ignore most of the reporting being doneby theinteractive technique.
In principle, we could measure effectiveness at each point at which a userreceivesfeedback. However, it is not statistically vi-able to utilize every such point, because many willnotbereached by numbers of userssufficient to support comparisons. Therefore, we elected to measure effectivenessatjustthefollowing feedback points:
* First X-mark. Whena failure isfirst reported by users (in our environment, signaled byanX-mark), they immediately
re-ceive fault localization feedback. Wetermthis thebeginning of adebugging session.(X-marks initiate such sessionsonly
when no other session is already in progress.) This point marks the first opportunity fortechniques to provide feed-back.
* Second X-mark The second X-mark's computations are basedon moreinformation than the first X-mark, so mea-suringatthispointhelps us gaugeeffectiveness trends over time. (In principle, third X-marks, fourth X-marks, and so oncould also beused, but the participants in our experiment kept theirdebugging incremental, with almost all debugging sessions involving two or fewer X-marks.)
* LastTest. Whenusersfind the cause of a failure (a fault),
theyoften immediately tryto fix it. This point includes at leastoneX-mark and anynumber of checkmarks, and de-notesthe end of a debugging session. As such, it is the point atwhich techniques have the most information available to them. Once a user edits the "source code" (formula), down-streamfault localizationinformation becomes obsolete, and is discarded.
Weemphasize that the need to evaluate effectiveness atmultiple points is notspecificto ourparticularexperiment. Rather, we rec-ommend that any interactive fault localization technique be eval-uated on the basis ofmultiple feedbackpoints because otherwise important data reported by the technique may be overlooked.
4.5 Information Bases
and
Mappings
Theinformation base and mapping factors in fault localization techniques have not beenpreviously isolated. Tolearn whether each factorsignificantlyimpacts technique effectiveness, while also providing data on techniques in the literature, we used the infor-mation bases and mappings of the three techniques described in Section 3.
Asdescribed earlier, the information base factor of a fault local-ization technique is responsible solely for storing and maintaining theinformation required by the technique in order to provide fault localization feedback. We now describe the three information bases of our own techniques.
* Test Count(I-TC). This technique's information base main-tains, for each cell c,the set offailed and passed tests that dynamically executec. The size of I-TC grows with respect to both spreadsheetand testsuite size.
* Blocking (I-BL).Therearetwo aspects to this information base. Like I-TC, I-BL maintains a list of all failed and
passed tests for each cell. However,toachieve the "block-ing" behavior described in Section 3, I-BLalso tracks the dataflow relationships between eachcell, usingthis informa-tion toallow tests, undercertain circumstances, to "block" other testsfrom reaching certain cells. Note that unlike pro-gramdicing [17], "blocking" does not completely remove cells from a program slice, as would dicing, because evi-dence[27] indicates that usersoccasionallymake erroneous testing decisions, and such decisions could cause the removal of acell that actually containsafault. (Rather thanbeing
re-movedfromthe programslice, such cells are later assigned a"minimalfaultlikelihood".)Becauseof the overhead
nec-essarytotrack dataflow andblockinginformation, I-BLis
morecomputationally expensive than I-TC.
* NearestConsumers(I-NC). Ratherthanmaintaininga his-toryof all previous testingdecisions,asdo the previoustwo
information bases, the I-NC information base tracks only (1) thefaultlikelihood of each cell in thespreadsheet prior toa newtestingdecision, and(2) thecurrenttesting decision foreach cell affected by the current test case(i.e., thecurrent setofinput values), including thatcurrent test case. Since
eachofthese components requires onlyconstantspacefor each cellin the spreadsheet, theinformationbase grows with respecttospreadsheet sizeonly, and is therefore the least
ex-pensiveof the three.
Because the contextofourexperimentis interactive fault
local-ization, eachoftheseinformation bases is immediately updated whenever any action is takenby auserthat affects thecontentsof thebase, potentiallyinterferingwith the environment's interactiv-ity. One reason to compare theseinformationbases, then, is tolearn
whetheramodestinformationbase suchas I-NCcancompetein
effectivenesswith the othertwo moreexpensive informationbases. Themapping factorusesthe information storedby the informa-tion base to calculate anddisplay faultlocalization feedback. We
nowdescribethe threemappings ofour ownthreetechniques.
* Test Count (M-TC). Thistechnique's mapping increases a
cell c's fault likelihoodforeach failedtestthatccontributed to, and decreases c'sfaultlikelihood forpassed tests in a manner such thattwopassedtestscounteractthe effects of
onefailedtest.Themappingusesthe setof failedandpassed
testsforeach celltoincrease the fault likelihood of cells
con-tributingtomany failed tests, and decrease thefault likeli-hood of cellscontributingtomanypassed tests,asdescribed
in Section 3.Ithas the characteristic ofmapping information basestofourpossible faultlikelihoodvalues, and begins by
assigningcthelowestfault likelihood if it contributes to a
single failure(X-mark),thereby allowingfaultlikelihoodto
build withfurther failures.
* Blocking (M-BL).This mappingis similartoM-TC,except
thatit considersonlythe failed andpassedteststhatare not
blocked,asthosearetheonlytestsprovidedtothemapping bythe I-BLinformationbase. It also supportsfive,rather thanfour, fault likelihood values, and begins by assigning
cthe second lowest fault likelihoodvalueso as tobe able
tobuildacell'sfault likelihood valueasthe number of failed
testsincreases,and also reducefaultlikelihoodasthenumber ofpassedtests orblockedfailedtestsincreases.
* NearestConsumers (M-NC). This mapping uses the informa-tionregardingthefaultlikelihoodof eachcelltocomputethe
averagefaultlikelihood ofc'sdirectconsumers. Itusesthe
currenttesting decision for each celltoadjust this calculated meanif c and c's directconsumerscontainsufficientlymore
passed tests than failed tests,orsufficientlymorefailed tests than passedtests [26]. Italso supports five fault likelihood values, andbegins by assigningcthe thirdfault likelihood value so as to make itviable to both increase and decrease fault likelihood valuesasc's direct consumers' fault likeli-hood valuesincrease and decrease.
Eachof these threemappingsexpectsacertain typeof informa-tion, and has attributesdevelopedspecificallytohandle that infor-mation. Forexample, theM-NCmapping expects the current fault likelihood of cells in ordertocomputethe average fault likelihood ofeach cell c's directconsumers.Such attributesmustbe character-isticof anymappingthat isleveragingtheI-NCinformation base. Therefore, withoutconsidering the attributes that "bind"a map-pingto aninformationbase, theessenceof the differences among ourthreemappingsare twoshared characteristics: (1) the number ofpossible faultlikelihoodvalues,and(2)an"initial" value used
to startassigningfault likelihood feedback. Assuch, whenwerefer toapplying amappingto aninformationbase,werefertoapplying onlythese two characteristics ofonemappingtoanotherto create an entirelynew mapping for thattechnique. We do notattempt
to tease apartthe influencesof thesetwocharacteristics, but sim-plyconsider themtogethertolearn whetherchanging the mapping factor ofatechniquecansignificantlyimpact that technique's ef-fectiveness.
Since the testing actions tobe uniformly applied across tech-niques had toinclude fault localization use,sometechnique had to beincorporatedinto the environment forparticipantuse. Because oftheir successes in earlier empirical work [26, 27],wechose to in-corporatetheI-TCinformation base with theM-BLmapping into the environment.
4.6 Procedure
After completingabackgroundquestionnaire, participantswere
given a tutorialtofamiliarize them with the environment. The
tu-torial taught the useofWYSIWYT (checkmarks and associated
feedback),but didnotincludedebugging ortesting strategy
con-tent.We also didnotteach theuseof faultlocalization;rather,
par-ticipantswereintroducedtothemechanics ofplacingX-marks and given timetoexplore any aspects of the feedback that theyfound
interesting.
After thetutorial, participantsweregiven the two tasks with in-structionsto testthespreadsheets andcorrectany errorsfound, sup-ported by I-TCandM-BL.Theexperimentwascounterbalanced with respecttotask orderso as todistributelearningeffects evenly. The tasksnecessarily involved time limits-set at20 minutes for
Gradebook and30 minutes for Payroll-to ensure
partici-pantsworkedonbothtasks, andto removepossible peer influence ofsomeparticipantsleaving early. To obtain the participants'
test-ing actions,the actionsby each participant were recorded into
elec-tronictranscripts.
4.7
Threats
to
Validity
Anycontrolled experimentissubjectto threatsto validity, and thesemustbe consideredin orderto assessthemeaningand im-pact ofresults. (Wohlinetal. [34] provideageneraldiscussion of
validity evaluation andathreatsclassification.)
Threatstointernal validityareotherfactors that may be respon-sible forourresults. Thespecific faultsseeded in aspreadsheet can affect fault localization results. To reduce this threat, we selected faultsaccordingtoPanko'sclassification scheme[21]to ensurethat
different types of faults were included. Also,asmentionedin Sec-tion 4.5, to applythe same test suites uniformly across all tech-niques, we had toobtainsuites using a singleinformation baseand mapping. It ispossiblethat the test suitescreatedby participants
would have varied in response to faultlocalizationfeedback had adifferent information base ormapping been chosen. However, had we chosen adesign that allowed for varying testing actions, wewould have riskedconfounding the independent variable- in-formation base or mapping selection-with a secondvariable of varying suites.
Threats to constructvalidity question whetherthe results ofan
experiment arebased onappropriate information. Oureffectiveness
metric considers only the cells colored by atechnique. This ignores search space size(i.e., the number of colored cells) because cells that are notvisually colored arenotconsideredbythemetric. To
consideran alternativemetric, wecross-checkedourresultswith
the metric used inourprevious work [26] (whichdoes consider search spacesize)andfoundthesametrendsand results. (We do not reportthese results due to space constraints.)
Threatstoexternalvalidity limit theextent towhich resultscan
begeneralized. To increase the representativeness ofour spread-sheets,weselected "real-world" spreadsheets fromarealend-user instructor and a real payroll description. Our spreadsheetswere
also moderatein size in order to allow subjectstomake progress inthe task in the allotted time. In thefuture,casestudies could be conducted withlarger spreadsheetssothatparticipants couldwork
through larger tasks,andnotbe faced withthetime constraints that werenecessarily imposed on this experiment. Also,the abilityto
generalizeourresults may also be limitedbyourselectionof faults. Tolimit this threatweattemptedtoseed realistic faultsusingthe proceduresoutlined in Section 4.2. Finally, ourexperimentwas
conducted in the Forms/3 researchlanguage [11]; however, end usersmaydebugdifferentlyinadifferentlanguage. Allofthese externalvalidityconcernscanbe addressedonlythrough repeated
studies, using different spreadsheets, faults, and languages.
5.
RESULTS
5.1
RQ1:
Information
Base
Toinvestigate the different information bases' impacton effec-tivenessindependent of the mapping factor, we compared the
infor-mation bases' effectivenessthree times, once under each mapping. Thecomparisons were done at each feedback point described in Section 4.4.
Asastatistical vehicle for our analyses, we state the following (null)hypotheses:
Hi: There is nodifference in effectiveness among the three infor-mation bases with the M-TC mapping.
H2: There is no difference in effectiveness among the three infor-mation bases with the M-BL mapping.
H3: There isnodifferenceineffectiveness among the three infor-mation bases with the M-NC mapping.
Tables
l(a)-l(c)
show the results. We used the Friedman test [29] tostatistically analyze the data. This test is an alternative to therepeatedmeasuresANOVA when the assumption of normalityorequalityisnot met. (We didnot runFriedmantests onthe Sec-ondX-mark data due to the small samplesizes.) Table1(a)shows nosignificantdifferences ininformationbase effectiveness at the 0.05 level under use of the M-TC mapping, so HI cannot be
re-jected. However, Table l(b)showsmarginalsignificance(0.10) at the First X-mark for the Payroll task and 0.01 significance by the Last Test. Differencesare even morepronouncedin Table1(c). Therefore,wereject H2 and H3.
5.2
RQ2: Mapping
How importantis mapping aloneto effectiveness? Table 1 is
suggestiveinthisregard. Tostatisticallyconsider whether this fac-torhadasignificantimpactoneffectiveness, we used the Friedman testtocomparethemappings' effectiveness under each information base. Thehypotheses in this case were:
H4: Thereis no difference ineffectiveness among the three
map-pingswith theI-TCinformationbase.
H5: There isnodifference ineffectivenessamongthe three
map-pingswiththeI-BLinformationbase.
H6: Thereisnodifference ineffectivenessamongthe three
map-pingswith theI-NCinformationbase.
AsTables
2(a)-2(c)
show, thereweresignificant differences in effectiveness among the differentmappings. The differences were almostalways significantatthe 0.05 level, andoftensignificant at the 0.01 level.Clearly,H4,H5,and H6 must all be rejected.FirstX-mark First X-mark FistX-mark
| I-TC I-BL I-NC I-TC I-BL I-NC I-TC I-BL I-NC
Gradebk(n=18) 0.39 0.26 0.39 Gradebk(n=18) 0.83 0.86 0.94 Gradebk(n=18) 1.14 1.39 1.50
(p=0.8948) (0.50) (0.62) (0.50) (p=0.7165) (0.84) (1.00) (0.92) (p=0.0923) (1.32) (1.37) (139) Payroll(n=13) 0.00 -0.17 0.04 Payroll(n=13) 0.29 0.35 OA9 Payroll(n=13) 0.69 0.54 0.93 (p=0.1211) (0.00) (0.40) (0.08) (p=0.1000) (0.42) (0.33) (OAO) (p=0.0695) (0.78) (0.65) (080)
Second X-mark SecondX-mark SecondX-mark
I-TC I-BL [ I-NC | I-TC I-BL I-NC 1 I-TC I-BL I-NC
Gradebk(n=3) 0.00 0.16 0.00 Gradebk(n=3) 0.33 0.50 050 Gradebk(n=3) 0.50 0.83 1.00
(p=n/a) (1.00) (0.76) (1.00) (p=n/a) (2.08) (1.80) (1.80) (p=n/a) (2.78) (2.57) (2.65)
Payroll(n=5) O.1S 0.01 0.18 Payroll(n=5) 0.37 0.36 0.56 Payroll(n=5) 0.69 0.54 0.94
(p=n/a) (0.46) (0.12) (0.49) (p=n/a) (0.95) (0.60) (083) (p=n/a) (1.17) (1.05) (1.22)
Last ast Tl LastTest Last Test
I-TC I-BL | I-NC | _|_ |_I-TC I-BL I-NC | _|_ |_I-TC I-BL I-NC
Gradebk(n=18) -0.06 0.00 1 -0.04 Gradebk(n =18) 0.26 | 0.33 j Gradebk(n=18)T 0.27 0.76 0.79
(p=0.4389) _ (0.54) (0.49) '(0.51) (p=0.4464) (1.12) (1.06) (1.03) (p=0.0022) (1.52) (1.48) (1.61) Payroll (n=13) 0.13 -0.12 0.21 Payroll(n-=13) 0.30 0.60 0.77 Payroll(n=13) 0.65 0.83 1.27
(p=0.0608) (0.28) (0.48)j (0.50) (p=0.0128) (0.60) (0.53) (0.6) (p=0.0199) (0.86) (0.88) (0.95)
(a) Informationbases withM-TC (b) Information bases withM-BL (c) Information bases withM-NC
Table 1: Isolating the information base factor.Themean(standard
deviation)
effectivenesscomparing
the threeinformation baseswiththe samemappingareshown.The information base with the greatest averageeffectivenessis shown in bold. The
"'p"
denotes p-valuesof theFriedmantests,and "n" denotesthe number ofsubjectsmeasuredateachpoint.FirstX-mark M-TC M-BL M-NC Gradebk(n = 18) 0.39 0.83 1.15 (p=0.0031) (0.50) (0.84) (1.32) Payroll(n=13) 0.00 0.29 0.69 (p=0.0060) (0.00) j(0.42) (0.78) SecondX-mark | M-TC M-BL M-NC Gradebk(n=3) 0.00 1 0.33 0.50 (p=n/a) (1.00) (2.08) (2.78) Payroll(n=5) 0.15 0.37 0.69 (p=n/a) (0.46) (0.95) (1.17) Last Test | M-TC M-BL M-NC Gradebk(n=18) -0.06 0.26 0.27 (p=0.1180) (0.54) (1.12) (1.52) Payroll(n=13) 0.13 0.30 0.65 (p=0.1220) (0.28) (0.60) (0.86) First X-mark _ M-TC M-BL M-NC Gradebk(n=18) 0.26 0.86 1.39 (p=0.0004) (0.62) (1.00) (137) Payroll(n= 13) -0.17 0.35 0.54 (p=0.0016) (0.40) (0.33) (0.65) Second X-mark _ T M-TC M-BL T M-NC Gradebk(n=3) 0.16 0.50 0.83 (p=n/a) (0.76) (1.80) (2.57) Payroll (n=5) 0.01 0.36 0.54 (p=n/a) (0.12) (0.60) (1.05) Last Test T M-TC M-BL M-NC Gradebk(n=18) 0.00 0.33 T 0.76 (p=0.0424) (0.49) (1.06) (1.48) Payroll(n=13) -0.12 0.60 T 0.83 (p=0.0001) (0.48) (0.53) (0.88) First X-mark M-TC M-BL M-NC Gradebk(n=18) 0.39 0.94 1.50 (p=0.0001) (0.50) (0.92) (1.39) Payroll(n= 13) 0.04 0.49 0.93 (p=0.0005) (0.08) (0.40) (0.80) Second X-mark M-TC M-BL M-NC Gradebk(n=3) 0.00 0.50 | 00 (p=n/a) (1.00) (1.80) (2.65) Payroll(n=5) 0.18 0.56 0.94 (p=n/a) (0.49) (0.83) (1.22) Last Test M-TC M-BL M-NC Gradebk(n=18) -0.04 0.38 0.79 (p=0.0045) (0.51) (1.03) (1.61) Payroll (n=13) 0.21 0.77 1.27 (p=0.0036) (0.50) (0.66) (0.95)
(a)Mappings withI-TC (b) Mappings with I -BL (c)Mappings with I-NC Table2:Isolating the mapping factor.
5.3 RQ3:
Inaccurate
Information
As ourfirst step, to investigate thefrequency of mistakes, we
counted the number of incorrect testing decisions made in each end-usertestsuite. In thecontextofourenvironment, this is either
aWYSIWYT checkmark
(V)
signifyingacorrect value and placed inacellthat really hasanincorrectvalue,or anX-marksignifyinganincorrect value (afailure)andplacedinacell thatreallyhas a correctvalue. In theGradebooktask, 8.99% of the checkmarks and 5.95% of the X-markswereincorrect. This trend continued in Payroll, where20.62% of the checkmarks and 3.33% of the X-markswereincorrect.
Given that such mistakes corrupt information bases, how did these mistakesimpact an information base's effecton effective-ness? Toinvestigate this,wemeasuredeffectiveness ateach First X-mark, Second X-mark, and Last Test that wasinthe contextofat
least one incorrecttesting decision. We isolated information bases using thesame procedureas Section 5.1. Thehypothesisin this caseis:
H7: There isnodifference in effectiveness among the information bases when inaccurate information is present.
Although we rancomparisons under all threemappings, dueto
space constraints, we show only measurements taken under the M-NC mapping, because M-NCwasthesuperior mapping in Sec-tion 5.2. (Theinformation bases under the othermappings show thesamegeneral trend.)
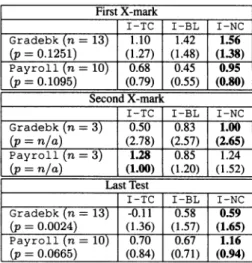
As Table 3shows, on the lasttest indebugging sessions, dif-ferences in each information base's effectivenessweremarginally
significant for Payroll, and significant (at the 0.01 level) for
Gradebook.Thus,werejectH7.
6.
DISCUSSION
The resultsregardingRQ1 showed thatinformation base often made a significant difference in effectiveness. This result is
con-sistent withother fault localization research. We also found that
theinformationbases' differencesineffectivenesswere most pro-nouncedat theendofdebugging sessions, mostlikelyduetothe
increasedtestinginformation available, allowingthe techniquesa
greater opportunity to differentiate themselves from each other. Thateffectiveness, however, didnotalways improve as debugging
sessionsprogressed-in the caseof Gradebook,all nine
combi-nations of information base andmapping became worse. Thismay
relate to the mistakes the users made in their testing, a point we will return toshortly.
Recall thatonegoal of this study was to provide empirical data
onthreeparticular information bases and mappings. Although all ofourinformation basesgenerally performed well,asurprise was the performance of I-NC. One reason this is surprising is that
I-NCis the information base least like those employed in many tra-ditionaltechniques, which tendto usecountsof failed and passed tests(asdoes I-TC)ordicing-like approaches (as does I-BL). A second reason is that I-NC is the leastcomputationally expensive of theinformation baseswecompared.
TurningtoRQ2, the role of the mapping factor was quite pro-nounced. Whilewefoundtwosignificant differences at the 0.05 level andonedifferenceatthe 0.01 level in RQ1, our investigation ofRQ2 yieldedonesignificant differenceatthe0.05 level, and nine differencesatthe0.01 level. These significant differences occurred despite only small distinctions among the three mappings (i.e., the numberof fault likelihoodvalues, and the "initial" value).
This resulthastwoimplications. First, great care should be ex-ercised inselecting mappingsfor fault localizationtechniques. To
ourknowledge,nopreviouswork hasprovided empirical evidence
tosupportthisfinding. Second, because both factors are important,
evaluatingeach factorseparately isimportant in ordertoobtain
ac-First X-mark _
I
I-TC T I-BL I-NCGradebk(n= 13) 1.10 T 1.42 1.56 (p=0.1251) (1.27) (1.48) (1.38)
Payroll(n=10) 0.68 0.45 0.95
(p=0.1095) (0.79) 1 (0.55) (0.80) Second X-mark
|I-TC I-BLI-NC
Gradebk(n= 3) 0.50 T 0.83 1.00
(p
=n/a)
(2.78) (2.57) (2.65)Payroll n=3) 1.28 0.85 1.24
(p
=n/a)
(1.00) |(1.20) (1.52)LastTest
|I-TC I-BL I-NC Gradebk(n= 13) -0.11 T 0.58 0.59
(p
=0.0024)
(1.36) (1.57) (1.65)Payroll(n=10) 0.70 T 0.67 1.16 (p=0.0665) (0.84) (0.71) (0.94)
Table 3:Isolatingtheinformation bases with M-NC in the
curate informationregarding a technique. Otherwise, in attempt-ing to improve atechnique's ability to pinpoint faults, researchers could actuallyweaken their technique's effectiveness by manipu-lating a factor that was already working well and overlooking the realculprit.
One resultfrom RQ3 was that the end-user test suites contained manymistakes, corroborating previous findings [27]. The effects of these mistakeswerefar-reaching too-although theynumbered
just under 25% of the tests, they affected 74% of the debugging ses-sions. This result underlines the seriousness with which thisissue shouldberegarded, especially since it runs contrary to a common assumption in prior research: that all testing has beenreliable.
7. RELATED WORK
Mostfault localization research has been basedonprogram slic-ing-a surveyof which is provided by Tip [30]-and dicing [17]
techniques. Our fault localization techniques draw from informa-tion gleaned via slicing, and makeuseof that informationusing heuristics inspired by dicing.
There has beenagreat dealof workonfault localization strate-giesfor professional programmers (e.g., [2, 10, 13, 15, 17, 23, 31]). Forexample, Agrawal et al. [2] present a technique,implemented
as
Xslice,
for locating faults using executiontracesfromtests.This technique is basedondisplaying dices of the program relativeto onefailingtestanda setof passingtests.Jones etal.[15] describeasimilarapproach implementedas TARANTULA. Unlike
Xslice,
TARANTULA usesinformation from all passing andfailing tests, coloring statementsbasedonthe likelihood that eachstatementis faulty accordingtoits ratio offailingtopassing tests. Usingafaulty
"run" and alarger number of correct runs, Renieris and Reiss's technique [23] compares the faultyrunwith the correctrunthat
mostresemblesit, and reports "suspicious" areasof the program. Two ways in whichourapproach differs from thesearethat our
methods(1)aretargetedatend users, and(2)areinteractive and in-crementalatthegranularity of revising fault likelihood estimations in realtime after eachsingle program edit.
PanandSpafford [19] presentafamily of 20 fault localization heuristics basedonprogramstatementsexercised by passing and
failingtests, threeof whichdirectlyrelate tothemappingsofour
techniques.
Alittle work aimed specifically at aiding end users withfault localization isemerging. For example, Ayalew and Mittermeir[6]
presentamethodof "faulttracing" for spreadsheets thatuses "in-tervaltesting" andslicing.Woodstein[32]isawebinterface agent
thatassistse-commercedebugging. KoandMyers [16] presenta
typeof fault localization via theWhyline,an"interrogative
debug-ging" technique. Our approach differs from the first strategy by
allowingusers tointeractively improve feedback by providingthe systemwith additional information, and from allthese strategies throughtheincorporationofarobustness feature[26, 27].
There is otherwork thatcanhelp endusersfind faults. S2 [28]
providesavisual auditing feature in Excel 7.0. Work isemerging
to automatically detect certain kinds oferrors, such aserrors in spreadsheet units [1,5]and types[3]. There has also been workto
help endusersdetectfailures,suchasstatistical outlierfinding [18]
andanomalydetection[22]. Finally, the assertionsapproach[33]
inForms/3automatically detects failuresinspreadsheet cells, and has been shownempiricallytohelpend users.
8.
CONCLUSIONS
Despitethegrowingnumberof end-user programmers,todate,
relatively little research has sought to address the dependability
is-suesthat arise in end-user software. We areworking on ways to
bringsoftwareengineering methodologiestobear upon this
prob-lem, focusinginthis paperonfault localization for end-user pro-grammers.
Inthis paperwehaveconsidered two factors that make up fault localizationtechniques-information baseand mapping-and
investigatedtheirimpactoneffectiveness. Theworkmakesfour primary contributions.
First,wedescribetwofactors that affect fault localization tech-niques, and provide empirical data indicating that each factor
sig-nificantly impactstheeffectiveness oftechniques. Two immediate
implications aretheneed to separately (1) design and (2)
evalu-ateeach factor. While it maymake intuitivesensethat each factor wouldplay arole intechnique effectiveness, todate, no studies haveexplicitlyteasedthe twofactors apart andempirically
con-firmedthat each indeed does haveasignificantrole ineffectiveness. Second, we providedataonthreeparticularinformation bases and threemappingsfor fault localizationtechniques,whichserves toaddress the lack ofempiricaldataconcemingfault localization support for endusers. Indoing so, we found that the
inexpen-sive,non-traditionalI-NCinformation baseperformedparticularly
well. Thissurprisingresult makes I-NCespecially advantageous inend-userprogramming given the importance of responsiveness inthesehighlyinteractive environments.
Third, weshowwhytraditionalmeasuresforfault localization
effectiveness,whicharetakenatthepointsof maximal system
rea-soning potential, areunsuitable inevaluatingeffectiveness in in-teractiveenvironments, andwe presenta setof measures that is instead takenat userfeedbackpoints. This type ofmeasurementis critical whenmeasuringinteractivedebugging devices,whichare commonin end-userprogramming environments,to ensurethat im-portantfeedback isnotomitted.
Fourth,ourresultscorroborate thegrowing body of evidence that endusersmakeanalarmingnumberof mistakes whenperforming
interactivetestinganddebugging tasks;inourexperiment,74%of thedebuggingsessionswereperformedinthecontextofatleastone
incorrecttestingdecision. Such evidence suggests that somefault
localizationtechniques, whichassumethat alltesting information iscorrect,maynotbesuitable for endusers.
Allfour of theabovefindingsrun countertomuchof the fault localization research aimedatprofessionalprogrammers. Infact,
ourresultsindicate thatanumberoftraditionalassumptionsin that
priorworkare notappropriatefor fault localization in end-user
soft-wareenvironments.
9.
ACKNOWLEDGMENTS
We thankthe participants ofourexperiment. This workwas
supportedin partbytheEUSES Consortium via NSF grant ITR-0325273.
10. REFERENCES
[1] R.Abraham and M.Erwig.Headerand unitinference for
spreadsheets
through
spatial analyses.InProceedingsoftheIEEEInternationalSymposiumonVisualLanguagesand
Human-CentricComputing,pages 165-172,Rome, Italy,
September2004.
[2] H.Agrawal,J.Horgan,S.London,andW.Wong.Fault localizationusingexecution slicesanddataflowtests.In
Proceedings oftheSixthIEEEInternationalSymposiumon
Software Reliability Engineering,pages143-151, Toulouse,
[3] Y Ahmad, T.Antoniu, S. Goldwater, andS. Krishnamurthi. A type systemfor statically detecting spreadsheet errors. In Proceedings ofthe18thIEEEInternationalConference on AutomatedSoftware Engineering, pages174-183,Montreal, Quebec,Canada, October2003.
[4] C. Allwood. Error detection processes in statistical problem
solving.CognitiveScience,8(4):413-437,1984.
[5] T.Antoniu, P.Steckler, S. Krishnamurthi, E.Neuwirth, and M.Felleisen.Validating the unit correctness ofspreadsheet programs. InProceedings ofthe26thInternational ConferenceonSoftware Engineering, pages439-448,
Edinburgh,Scotland, May 2004.
[6] Y.Ayalew and R. Mittermeir.Spreadsheet debugging. In Proceedings ofthe European Spreadsheet Risks Interest Group,Dublin,Ireland,July 2003.
[7] N.Belkin.Helping people find what they don't know. Communicationsofthe ACM,41(8):58-61,August 2000.
[8] B.Boehm, C. Abts,A.Brown,and S. Chulani.SoftwareCost
EstimationwithCOCOMO11.Prentice HallPTR,Upper SaddleRiver,NewJersey, USA,2000.
[9] B. Boehm and V. Basili. Software defect reduction Top 10 list.Computer,34(l):135-137,January2001.
[10] P. Bunusand P. Fritzson. Semi-automatic fault localization and behavior verification forphysicalsystemsimulation models. InProceedings ofthe
18th
IEEE International ConferenceonAutomatedSoftware Engineering,pages 253-258, Montreal,Quebec, Canada,October 2003. [11] M. Burnett, J. Atwood, R.Djang,H.Gottfried,J.Reichwein,and S.Yang.Forms/3: Afirst-order visuallanguageto
explore the boundaries of thespreadsheetparadigm.Journal
ofFunctionalProgramming,11(2):155-206,March2001.
[12] C.Corritore,B.Kracher, and S. Wiedenbeck. Trust in the online environment. In HCIInternational,volume1,pages
1548-1552,NewOrleans, Louisiana,USA,August 2001.
[13] R.DeMillo,H.Pan,and E.Spafford.Criticalslicingfor software fault localization. InProceedingsofthe
InternationalSymposiumon
Software
Testing andAnalysis, pages121-134,SanDiego, California, USA, January1996.[14] D.Hilzenrath.Findingerrors aplus, Fannie says; mortgage giant triestosoften effect of$1billion in mistakes. The
Washington Post,October31,2003.
[15] J.Jones, M.Harrold,and J.Stasko.Visualizationoftest
informationtoassist faultlocalization. InProceedings ofthe
24thInternationalConferenceonSoftware Engineering,
pages467-477,Orlando, Florida, USA, May 2002.
[16] A. Ko and B.Myers. DesigningtheWhyline:Adebugging
interface forasking questionsabout programfailures. In
Proceedingsofthe ACMConferenceonHuman Factorsin
Computing Systems,pages 151-158,Vienna, Austria, April
2004.
[17] J.Lyleand M. Weiser. Automatic programbuglocationby programslicing. In Proceedings ofthe
2nd
International ConferenceonComputersandApplications,pages877-883, 1987.[18] R.Millerand B.Myers.Outlierfinding: Focusinguser
attentiononpossibleerrors.InProceedingsofthe ACM SymposiumonUserInterfaceSoftware and Technology, pages81-90,Orlando, Florida, USA,November 2001.
[19] H. Pan and E.Spafford. Toward automatic localization of software faults. In Proceedings ofthe 10th Pacific Northwest Software Quality Conference, October 1992.
[20] R. Panko. Finding spreadsheet errors: Most spreadsheet errorshavedesign flaws that may leadtolong-term miscalculation.Information Week, page 100, May 1995. [21] R. Panko. What we know aboutspreadsheet errors. Journal
onEnd User Computing, pages 15-21,Spring 1998. [22] 0. Raz, P. Koopman, and M. Shaw. Semantic anomaly
detection ononline data sources. In Proceedings ofthe 24th International Conference on Software Engineering, pages 302-312, Orlando, Florida, USA, May 2002.
[23] M. Renieris and S. Reiss. Fault localization with nearest neighbor queries. In Proceedings ofthe18thIEEE International Conference on Automated Software Engineering, pages30-39, Montreal, Quebec, Canada, October 2003.
[24] G. Robertson. Officials red-faced by$24mgaffe: Error in
contractbid hits bottom line ofTransAltaCorp. Ottawa Citizen, June 5, 2003.
[25] G. Rothermel, M.Burnett,L.Li, C.Dupuis, and A. Sheretov. Amethodology for testing spreadsheets. ACMTransactions on
Software Engineering
andMethodology, 10(1): 110-147,January2001.
[26] J. Ruthruff, E.Creswick,M.Burnett, C.Cook, S.Prabhakararao,M.Fisher II, and M. Main. End-user software visualizations for fault localization. In Proceedings ofthe ACM SymposiumonSoftwareVisualization, pages 123-132, SanDiego, Califomia,USA, June 2003. [27] J. Ruthruff, S. Prabhakararao, J. Reichwein, C. Cook,
E.Creswick, and M. Burnett. Interactive, visual fault localization support for end-user programmers.Journal of Visual Languages and Computing, 2005 (to appear). [28] J.Sajaniemi. Modeling spreadsheet audit: A rigorous
approachtoautomaticvisualization. JournalonVisual Languagesand Computing, 11(1):49-82,February 2000. [29] S. Siegel andN.Castellan Jr. Non-parametric Statisticsfor
the Behavioral Sciences. McGrawHill,Boston,
Massachusetts,USA, 1998.
[30] F.Tip.A surveyof programslicing techniques.Journalon
ProgrammingLanguages,3(3):121-189, 1995. [31] J.Voas.Softwaretestability measurement for assertion
placementandfault localization. InProceedings ofthe InternationalWorkshoponAutomated andAlgorithmic Debugging,pages 133-144,1995.
[32] E.Wagner and H. Lieberman.Supportinguserhypothesesin
problem diagnosisonthe web andelsewhere. InProceedings
ofthe InternationalConferenceonIntelligent User
Interfaces,pages30-37,Funchal, Madeira Island, January 2004.
[33] A.Wilson,M.Burnett,L.Beckwith,0.Granatir, L.Casburn,C. Cook, M. Durham, and G. Rothermel.
Harnessing curiositytoincreasecorrectness in end-user programming. In Proceedings ofthe ACM Conference on
Human Factors inComputing Systems, pages305-312, Fort Lauderdale,Florida,USA, April 2003.
[34] C.Wohlin,P.Runeson,M.Host,B.Regnell, andA.Wesslen. ExperimentationinSoftwareEngineering.Kluwer Academic Publishers, Boston, Massachusetts, USA, 2000.