Aberystwyth University
Fuzzy Rough Sets for Self-Labelling: an Exploratory Analysis
Vluymans, Sarah; MacParthaláin, Neil; Cornelis, Chris; Saeys, YvanPublished in:
Fuzzy Rough Sets for Self-Labelling: an Exploratory Analysis
Publication date: 2016
Citation for published version (APA):
Vluymans, S., MacParthaláin, N., Cornelis, C., & Saeys, Y. (2016). Fuzzy Rough Sets for Self-Labelling: an Exploratory Analysis. In Fuzzy Rough Sets for Self-Labelling: an Exploratory Analysis
General rights
Copyright and moral rights for the publications made accessible in the Aberystwyth Research Portal (the Institutional Repository) are retained by the authors and/or other copyright owners and it is a condition of accessing publications that users recognise and abide by the legal requirements associated with these rights.
• Users may download and print one copy of any publication from the Aberystwyth Research Portal for the purpose of private study or research.
• You may not further distribute the material or use it for any profit-making activity or commercial gain • You may freely distribute the URL identifying the publication in the Aberystwyth Research Portal
Take down policy
If you believe that this document breaches copyright please contact us providing details, and we will remove access to the work immediately and investigate your claim.
tel: +44 1970 62 2400 email: [email protected]
Fuzzy Rough Sets for Self-Labelling:
an Exploratory Analysis
Sarah Vluymans
∗†‡, Neil Mac Parthal´ain
§, Chris Cornelis
∗‡and Yvan Saeys
†¶∗Department of Applied Mathematics, Computer Science and Statistics, Ghent University, Ghent, Belgium
Email: [email protected]
†VIB Inflammation Research Center, Zwijnaarde, Belgium
‡Department of Computer Science and Artificial Intelligence, University of Granada, Granada, Spain
Email: [email protected]
§Department of Computer Science, Aberystwyth University, Aberystwyth, Ceredigion, Wales, UK
Email: [email protected]
¶Department of Respiratory Medicine, Ghent University, Ghent, Belgium
Email: [email protected]
Abstract—Semi-supervised learning incorporates aspects of both supervised and unsupervised learning. In semi-supervised classification, only some data instances have associated class labels, while others are unlabelled. One particular group of semi-supervised classification approaches are those known as self-labelling techniques, which attempt to assign class labels to the unlabelled data instances. This is achieved by using the class predictions based upon the information of the labelled part of the data. In this paper, the applicability and suitability of fuzzy rough set theory for the task of self-labelling is investigated. An important preparatory experimental study is presented that evaluates how accurately different fuzzy rough set models can predict the classes of unlabelled data instances for semi-supervised classification. The predictions are made either by considering only the labelled data instances or by involving the unlabelled data instances as well. A stability analysis of the predictions also helps to provide further insight into the characteristics of the different fuzzy rough models. Our study shows that the ordered weighted average based fuzzy rough model performs best in terms of both accuracy and stability. Our conclusions offer a solid foundation and rationale that will allow the construction of a fuzzy rough self-labelling technique. They also provide an understanding of the applicability of fuzzy rough sets for the task of semi-supervised classification in general.
I. INTRODUCTION
The area of semi-supervised learning [1] lies between the two major machine learning paradigms: supervised learning and unsupervised learning. Data instances can be represented by a number of descriptive conditional features and an associ-ated decision feature. In a classification setting, this decision is a class label, drawn from a finite set of possibilities. In contrast to supervised learning, where the class labels are available for all of the instances, and unsupervised learning, where none of the data instances have associated labels, semi-supervised classification considers datasets for which only part of the instances are labelled, whilst the remainder are not. There is wide applicability for such techniques, including natural language processing and bioinformatics, with the shared char-acteristic that the labelling of instances is costly or difficult [2]. As a result of this, large amounts of data consist of both
labelled and unlabelled instances. A popular approach in semi-supervised classification is self-training or self-labelling [3]. These methods initially attempt to predict the missing class labels for the training set. They usually implement an iterative approach, where each iteration consists of an extension of the labelled set using the most confident class predictions for unlabelled instances. The predictions are made based on the currently labelled instances. Afterwards, the enlarged labelled set is used to make predictions for unseen instances.
In this paper, focus is placed on the use of fuzzy rough set theory [4] for self-labelling in semi-supervised classification. The fuzzy rough set model is a hybridization of fuzzy sets [5] and rough sets [6]. By combining both approaches, vague (fuzzy) and incomplete (rough) information can be modelled. As a consequence, it has been, and continues to be, used in many machine learning techniques [7]. A central tenet of fuzzy rough set theory is the approximation of a concept by two fuzzy sets. In the crisp setting (rough set theory), the
lower approximation contains instances which belong to the concept with certainty, while theupper approximationconsists of instances which possibly belong to it. In fuzzy rough set theory, both the upper and lower approximation are fuzzified. Fuzzy rough sets have been used in a simple semi-supervised self-labelling method in [8], where the initial labelling step is based upon the lower approximation calcu-lations. In each iteration, when a hitherto unlabelled instance fully belongs to the lower approximation of a particular class, it receives the label of that class. This approach may be too naive, as the membership to the lower approximation is governed largely by the choice of fuzzy similarity relation, fuzzy connectives and the underlying data distribution. This will limit the successful execution of the self-labelling stage. Before an extension of this method could be considered, some important questions need to be posed, namely: how robust is the fuzzy rough lower approximation as a class prediction mechanism when considering missing class labels? and what if the upper approximation were to be used? If the self-labelling step consists of assigning an unlabelled instance
to the class for which its membership degree to the lower or upper approximation is largest, then a verification is required in order to assess the accuracy and robustness of this procedure and also how it changes when fewer labelled instances are available. It is important to note that only the initial self-labelling iteration is considered here, that is, the first prediction step for all unlabelled instances. That is why a comparison with existing self-labelling methods is not made yet, as we do not propose a complete method but rather investigate the robustness and provide an in-depth analysis of fuzzy rough sets for this task. As noted in e.g. [9], if the initial predictions in the self-labelling step are incorrect, this will have a detrimental effect on its performance, as each subsequent labelling step has the effect of reinforcing the initially incorrect labels. This initial step is therefore imperative in order to examine the robustness of the predictor used in the first labelling phase.
The lower and upper approximation operators of several fuzzy rough set models are considered in this paper as potential candidates for implementing this phase. In future work, the conclusions drawn from this investigation will provide a foun-dation for constructing a fuzzy rough self-labelling technique that is competitive with or superior to the current state-of-the-art semi-supervised classifiers. The findings presented here also provide an important insight into the use of fuzzy rough set models for the task of semi-supervised learning in general. The remainder of this paper is structured as follows. In Section II the definitions of the fuzzy rough approximation operators for different models are recalled. Their predictive ability and prediction stability are evaluated and discussed in the experimental evaluation in Section III. Finally, Section IV concludes with a discussion of future research directions.
II. FUZZY ROUGH SET MODELS
Several hybrid models of fuzzy and rough set theory have been proposed in the literature. In this section, we describe four of the most popular fuzzy rough set models, which are evaluated in our study. In general, for all included models, the lower approximation is dependent on the choice of an implicator I. This fuzzy operator is a mappingI : [0,1]2→
[0,1] that is decreasing in its first argument, increasing in its second and satisfies the boundary conditions I(0,0) =
I(0,1) = I(1,1) = 1 and I(1,0) = 0. Likewise, the upper approximations depend on a triangular norm (t-norm)
T : [0,1]2 → [0,1], a type of commutative and associative
operator that is increasing in both arguments and satisfies (∀a ∈ [0,1])(T(a,1) = a). We compare several implicators and t-norms in our experiments, using three popular options for each operator. The different alternatives for I are the Łukasiewicz implicator (IL(a, b) = min(1−a+b,1)), the Kleene-Dienes implicator (IKD(a, b) = max(1−a, b)) and the Reichenbach implicator (IR(a, b) = 1−a+a·b). The included t-norms are the Łukasiewicz t-norm (TL(a, b) = max(a+b− 1,0)), the minimum t-norm (Tm(a, b) = min(a, b)) and the product t-norm (Tp(a, b) =a·b).
A component shared among all fuzzy rough set models is their use of a fuzzy indiscernibility relation R(·,·), which
measures the extent to which two instances are similar based on their feature values. In this paper, we define this attribute similarity relation asR(x, y) =|A|1 P
a∈ARa(x, y),whereA is the set of all features. When ais numeric, we set
Ra(x, y) = 1−
|a(x)−a(y)|
range(a) . Otherwise, we define this value as
Ra(x, y) = (
1 if a(x) =a(y) 0 if a(x)6=a(y).
For the other parameters of the four models, we mostly follow the experimental study of [10], in which the authors evaluated the robustness of fuzzy rough set models against class and attribute noise. We specify all settings in the model descriptions below. With respect to notation, we useAandA
to denote the lower and upper approximations of a setAwith the chosen parameter settings. Both are fuzzy sets.
The aim of this contribution is to evaluate the predictive capacity and the stability of a selection of fuzzy rough approximation operators in a semi-supervised setting. Recall that the latter means that some (or a substantial part) of the training instances are not labelled, that is, their feature values are known, but their class label is not. We denote the labelled part of the training set by L and the unlabelled part by U
and present two possible general ways to determine the fuzzy rough approximations. The first setting coincides with the traditional way of self-labelling, in that the unlabelled training instances are completely disregarded in the calculations and only the instances in L are used. It should be clear that this setting will merely allow us to verify the influence of the size of a fully labelled training set on the predictions and stability of the fuzzy rough approximation operators. The second setting represents a first naive way to introduce the unlabelled instances in the calculations. It assumes that every instance inU belongs to its own separate class, following [11].
A. Traditional fuzzy rough sets
We consider the traditional fuzzy rough set model of [4], albeit in its more general implicator/t-norm form proposed in [12]. In the first setting, only instancesyfrom the labelled part of the training set are involved in the calculations. Since our experiments solely involve approximations of decision classes, we are guaranteed that the set A is crisp, meaning that the membership valuesA(·)are either 0 (instance not inA) or 1 (instance in A). The membership degree of an instance xto the lower approximation of a setAin this setting is given by
A(x) = min y∈L[I(R(x, y), A(y))] = min min y∈L∩A[I(R(x, y),1)], min y∈L∩co(A)[I(R(x, y),0)] = min y∈L∩co(A)[I(R(x, y),0)] = min y∈L∩co(A)[NI(R(x, y))]. (1)
This derivation uses the fact that for any implicator (∀a)(I(a,1) = 1) holds, which directly follows from the condition I(1,1) = 1 and that an implicator is decreasing in its first argument. The operator NI is the induced negator of the implicator I and is defined as (∀a)(NI(a) =I(a,0)). It can easily be derived that the three implicators in our study (IL,IKDandIR) all have the same induced negator, namely the standard negatorN ((∀a)(N(a) = 1−a)). As a result, the traditional lower approximation is independent of our choice between these three alternatives. The membership degree ofx
to the upper approximation ofAin the first setting is given as
A(x) = max y∈L[T(R(x, y), A(y))] = max max y∈L∩A[T(R(x, y),1)], = max y∈L∩co(A) [T(R(x, y),0)] = max y∈L∩A[T(R(x, y),1)] = max y∈L∩A[R(x, y)], (2) where we have used that for any t-norm (∀a)(T(a,0) = 0) holds, a consequence of the property that a t-norm is increasing in both its arguments, it is commutative and (∀a)(T(a,1) =
a). We observe that the traditional upper approximation is independent of the choice of t-norm.
Moving to the second setting, we involve the instances of
U as well. As we assume all instances inU to belong to their own separate decision class, we have(∀y∈U)(A(y) = 0). A similar derivation as above allows us to conclude that in this setting
A(x) = min y∈(L∩co(A))∪U
[NI(R(x, y))] (3)
holds. As above, this membership degree is independent of the choice of implicator in our study. Based on the derivation for the upper approximation given above, it should be clear that it coincides in both settings, since (∀y∈U)(A(y) = 0).
B. OWA-based fuzzy rough sets
This model was proposed in [13]. It is a generalization of the traditional model, replacing the strict minimum and max-imum operators by an ordered weighted average (OWA, [14]) aggregation. Given a weight vectorW, the OWA aggregation of a set of values V is given as
OWA(V) = |V|
X
i=1
(wi·vi),
wherewi is theith element of the vectorW andvi is theith largest value inV.
In the first setting of the OWA-based model, we replace the minimum and maximum in (1) and (2) by OWA aggregations and find A(x) = OWA y∈L∩co(A) [NI(R(x, y))] (4) and A(x) = OWA y∈L∩A[R(x, y)]. (5)
As for the traditional model, these membership degrees are independent of our choice of implicator and t-norm. For the second setting, we modify (3) to
A(x) = OWA y∈(L∩co(A))∪U
[NI(R(x, y))], (6)
which is also independent of the choice of implicator in this paper. The upper approximation coincides in the two settings. In the OWA aggregation, we use linearly increasing or decreasing weights, which are respectively defined as
W = 2 p(p+ 1), 4 p(p+ 1), . . . , 2(p−1) p(p+ 1), 2 p+ 1 (7) and W = 2 p+ 1, 2(p−1) p(p+ 1), . . . , 4 p(p+ 1), 2 p(p+ 1) , (8)
where p is the size of the set of values to be aggregated. These vectors are normalized versions of h1,2, . . . , p−1, pi
and hp, p−1, . . . ,2,1i and correspond to the Borda count in decision making applications [15]. We use vector (7) for the lower approximations and vector (8) for the upper approximation. It should be clear that, comparing expressions (1) and (4) for instance, this OWA-based alternative uses all values NI(R(x,·)) instead of solely the lowest one to calculate A(x). In this process, our choice of weights results in the assignment of the highest weight to the lowest value and linearly decreasing weights to the consecutively higher ones.
C. Fuzzy variable precision rough sets (FV)
This fuzzy rough set model was proposed in [16]. Since we are using crisp setsA, we can use the simplified formula for the approximations, as derived by the authors. In this case, in the first setting, the membership degrees of an instance xto the lower and upper approximations ofA are given as
A(x) = min y∈L,A(y)=0[I(R(x, y), α)] = min y∈L∩co(A)[I(R(x, y), α)] (9) and A(x) = max y∈L,A(y)=1 [T(R(x, y),N(α))] = max y∈L∩A[T(R(x, y),N(α))], (10) whereN is a negator, for which we use the standard negator. We setαto 0.15, following [10]. For the second setting, the lower approximation of a crisp setAis determined as
A(x) = min y∈L∪U,A(y)=0 [I(R(x, y), α)] = min y∈(L∩co(A))∪U [I(R(x, y), α)]. (11)
Because of the assumption (∀y ∈ U)(A(y) = 0), the upper approximation is the same as in the first setting.
D. β-precision fuzzy rough sets (BPFR)
The fourth model included in our study was introduced in [17] and is based on a β-precision quasi t-norm and quasi t-conorm [18]. In this study, as in [10], we derive these from the minimum operator. For the first setting, the lower approximation of a setA is determined as
A(x) =minβ y∈L
[I(R(x, y), A(y))] (12)
and for the second as
A(x) = minβ y∈L∪U
[I(R(x, y), A(y))], (13)
where minβis the quasi t-norm associated with the minimum, minβ(a1, . . . , an) = min(b1, . . . , bn−m),
withbi theith largest element amonga1, . . . , an and
m= max i∈ {0, . . . , n} |i≤(1−β) n X j=1 aj . (14)
In the experiments, we setβto 0.97, based on [10]. As a result of our choice of the minimum, the upper approximations of this model coincide with those in Section II-A.
III. EXPERIMENTAL STUDY
Our main contribution lies with the experimental analysis of the prediction capacity and stability of the fuzzy rough approximation operators of the models presented in Section II. The stability analysis has been included to assess the robust-ness of these operators against small changes in the training sets. These experiments allow us to answer some important questions:
1) How are the predictions, both w.r.t. accuracy and stabil-ity, of the fuzzy rough operators influenced by increasing levels of missing class labels?
2) Are there notable differences between the two settings, that is, between using onlyL or both L andU? If so, are there any benefits to including the unlabelled training instances in the predictions?
3) Can we nominate (based on the results) one particular operator as the most promising to be used for a self-labelling method?
A. Set-up
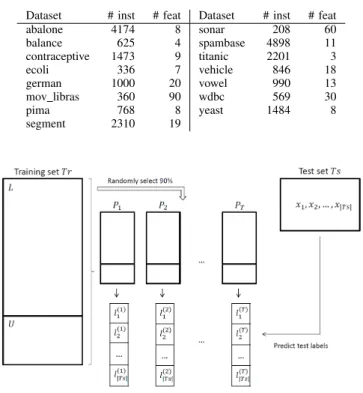
Table I lists the 15 benchmark datasets selected from the KEEL repository (www.KEEL.es) for our experimental evalu-ation. The similarity relation used for all of the models is that specified above. As noted in Section II, some approximation definitions depend on the choice of an implicator and a t-norm, and the given range of operators is included here.
The goal of this evaluation is two-fold. Firstly, it is to evaluate and compare the predictive characteristics of the different approximation operators. We use 10 fold cross-validation here, where the class labels of the instances in the test folds are predicted. This is done for different levels of
Table I
DATASETS USED IN THE EXPERIMENTAL EVALUATION
Dataset # inst # feat Dataset # inst # feat
abalone 4174 8 sonar 208 60 balance 625 4 spambase 4898 11 contraceptive 1473 9 titanic 2201 3 ecoli 336 7 vehicle 846 18 german 1000 20 vowel 990 13 mov libras 360 90 wdbc 569 30 pima 768 8 yeast 1484 8 segment 2310 19
Figure 1. Procedure for the stability calculation.
labelled and unlabelled instances in the training folds. The percentage of unlabelled training instances is set from 0% up to 90% in intervals of 10%, by removing the class labels from a randomly selected set of instances of the corresponding size. To classify a test instance, its membership degree to the lower or upper approximation of all classes is computed. When this value is largest for the true class of the test instance, the classification is considered to be correct. In every other case, the classification is incorrect. All models and approximations discussed in Section II are evaluated. These results are presented in Section III-B.
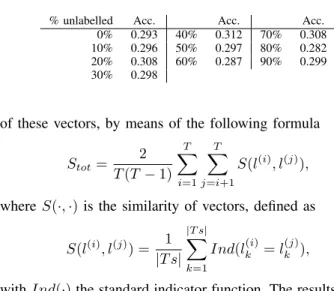
The second objective of this experimental analysis is to investigate the predictive stability of the different models for varying levels of missing class labels. The procedure described in [19] and depicted in Figure 1 is implemented for this task. For each datasetD, whereDis taken from Table I, a training (90%) and test (10%) set is constructed. These are denoted as
T r and T s respectively. For a given percentage p, the class labels of p% of the instances in T r are removed, thereby resulting in the sets L and U. From this variant of T r, a number of related, but slightly different, datasets are extracted by randomly selecting 90% of L and U. A total number of
T such datasets are constructed (P1,P2, . . . ,PT). Next, each dataset is used to predict the labels ofT s, using the lower or upper approximation of one of the fuzzy rough set models. This step yields T vectors l(1), l(2), . . . , l(T) containing the
class predictions for the test instances. The stability Stot of the model is measured by aggregating the pairwise similarity
Table II
PREDICTION ACCURACY OF A RANDOM CLASSIFIER
% unlabelled Acc. Acc. Acc.
0% 0.293 40% 0.312 70% 0.308 10% 0.296 50% 0.297 80% 0.282 20% 0.308 60% 0.287 90% 0.299 30% 0.298
of these vectors, by means of the following formula
Stot= 2 T(T−1) T X i=1 T X j=i+1 S(l(i), l(j)),
whereS(·,·)is the similarity of vectors, defined as
S(l(i), l(j)) = 1 |T s| |T s| X k=1 Ind(l(ki)=l(kj)),
withInd(·)the standard indicator function. The results of the stability analysis are discussed in Section III-C.
B. Prediction results
In this section, the prediction accuracy of the approximation operators of the four fuzzy rough set models are examined in the context of the two settings detailed previously. The results are presented in Tables III-VI. The values shown are the average accuracies of a particular operator for the 15 datasets in Table I, in a 10-fold cross-validation set-up. When the column header is an implicator, it refers to a lower approximation operator. In the case of a t-norm, it represents an upper approximation. Before considering the fuzzy rough set models, a baseline is established in the form of a random classifier, which labels unseen instances in a random fashion and yields the results presented in Table II. Most of the models evaluated below give considerably better results.
1) Traditional fuzzy rough set model: Table III presents the results for the traditional fuzzy rough set model. Recall that, in this study, the choice of implicator or t-norm is irrelevant and that the upper approximation coincides in the two settings. We observe that the accuracy of the fuzzy rough operators decreases when the number of unlabelled training instances in-creases. This is to be expected, as less information is available to make classification predictions. We also note that the results for the lower and upper approximation in the first setting are the same, showing that the two operators have the same predictive power in this case. For the lower approximation, the performance in the second setting is considerably reduced when compared to the first, as it can be seen that the average accuracy decreases rapidly when a larger number of class labels are missing. This model does not benefit from the naive inclusion of unlabelled instances. In going from (1) to (3), the instances fromU are all included in the minimum calculation without question. Nevertheless, an instancex∈Ustill belongs to some unknown class A andxshould therefore ideally, in the spirit of (1), not be included in the calculation of the lower approximation of that class. In order to more thoroughly evaluate whether instances in U can be used to improve the
Table III
PREDICTION ACCURACY OF TRADITIONAL FUZZY ROUGH SETS
Setting 1 Setting 2 % unlabelled I T I 0% 0.674 0.674 0.674 10% 0.670 0.670 0.587 20% 0.670 0.670 0.513 30% 0.668 0.668 0.442 40% 0.663 0.663 0.372 50% 0.664 0.664 0.311 60% 0.657 0.657 0.253 70% 0.643 0.643 0.185 80% 0.617 0.617 0.123 90% 0.584 0.584 0.065 Table IV
PREDICTION ACCURACY OFOWA-BASED FUZZY ROUGH SETS
Setting 1 Setting 2 % unlabelled I T I 0% 0.688 0.684 0.688 10% 0.684 0.677 0.684 20% 0.681 0.674 0.681 30% 0.674 0.671 0.676 40% 0.674 0.669 0.675 50% 0.668 0.656 0.669 60% 0.659 0.650 0.660 70% 0.651 0.645 0.650 80% 0.640 0.634 0.643 90% 0.621 0.609 0.622
predictions of the fuzzy rough operators, the second setting for this model should be modified to not simply assume that all instances belong to their own decision class. This is part of our proposed future work.
2) OWA-based fuzzy rough set model: Table IV presents the results for the OWA-based fuzzy rough set model. As for the traditional model, the operators are independent of the choice of implicator and t-norm respectively. As opposed to the above, the lower approximation is not negatively influenced by including the instances fromU in the calculations, which may be due to the averaging effect of the OWA aggregation. However, it does not clearly benefit from it either, so further effort involving more sophisticated versions of the second setting are warranted for this model as well. We also note that the accuracy attained by the OWA-based operators is higher than the traditional ones, in particular in the presence of more unlabelled instances. This supports the observations noted in [13] with respect to robustness in the presence of noise.
3) Fuzzy variable precision rough sets: Table V presents the results for the fuzzy variable precision rough set model. As opposed to the traditional and OWA-based models, the lower approximation is not independent of the choice of implicator, nor the upper approximation of the choice of t-norm.
The three implicators do not yield the same performance: the accuracy of implicators IL andIR coincides, but that of
IKD is quite a bit lower. It can not be proven that the lower approximations using IL or IR are the same, but it can be expected that the same instancesy∈L∩co(A)determine the results in (9). Indeed, it can be derived that when using IL,
Table V
PREDICTION ACCURACY OF FUZZY VARIABLE PRECISION ROUGH SETS
Setting 1 IL TL % unlabelled IKD IR Tp Tm 0% 0.100 0.674 0.673 0.100 10% 0.102 0.670 0.671 0.102 20% 0.102 0.670 0.672 0.103 30% 0.105 0.668 0.666 0.106 40% 0.107 0.663 0.665 0.107 50% 0.108 0.664 0.665 0.107 60% 0.115 0.657 0.649 0.112 70% 0.121 0.643 0.642 0.121 80% 0.127 0.618 0.617 0.130 90% 0.157 0.584 0.582 0.154 Setting 2 0% 0.100 0.674 0.673 0.100 10% 0.063 0.587 0.671 0.102 20% 0.050 0.513 0.672 0.103 30% 0.041 0.442 0.666 0.106 40% 0.033 0.372 0.665 0.107 50% 0.030 0.311 0.655 0.107 60% 0.026 0.253 0.649 0.112 70% 0.016 0.185 0.642 0.121 80% 0.010 0.123 0.617 0.130 90% 0.007 0.065 0.582 0.154 expression (9) reduces to A(x) = 1 +α− max y∈L∩co(A) R(x, y) if (∃y)(R(x, y)> α) 1 if (∀y)(R(x, y)≤α) and for IR to A(x) = 1−(1−α)· max y∈L∩co(A) R(x, y).
In both cases, the result is based on the most similar instance
y∈L∩co(A). For the third implicatorIKD we find
A(x) = (
1−max
y∈S R(x, y) ifS6=∅
α otherwise.
whereS ={y∈L∩co(A)kR(x, y)<1−α}. In this case, due to the definition of S, it is not the most similar instance to x that determines the result and we can expect the final performance to be different from that of the versions with
IL and IR. We have set α to 0.15. For lower values, the differences between IL or IR on the one hand and IKD on the other may be smaller. Analogous conclusions hold for (11). We observe that the lower approximation has the best performance in the first setting. Going from (9) to (11), the minimum is determined over a far larger set of values. The values themselves solely depend on the feature similarity rela-tionR(·,·), so the inclusion of instances inU can substantially alter this set and thereby the minimum.
For the upper approximation (as noted in Section II-C), there is no difference between the two settings. The two t-norms
TL and Tp yield equal performance, which is close to that of the lower approximation with implicators IL and IR in the first setting. That of the third alternative Tm is somewhat lower and comparable to the first setting lower approximation
Table VI
PREDICTION ACCURACY OFβ-PRECISION FUZZY ROUGH SETS
Setting 1 Setting 2 IKD IKD IL IL % unlabelled IR IR 0% 0.660 0.660 10% 0.657 0.651 20% 0.658 0.639 30% 0.652 0.614 40% 0.643 0.583 50% 0.644 0.558 60% 0.629 0.519 70% 0.623 0.485 80% 0.607 0.417 90% 0.579 0.305
withIKD. As for the lower approximation, it can be derived that the membership degree of an instance x to the upper approximation using TL and Tp largely depends on its most similar value y∈L∩A, while for Tm it is based on the set
{y∈L∩AkR(x, y)<1−α}.
4) β-precision fuzzy rough sets: Table VI presents the results for the β-precision fuzzy rough set model. This table only includes the lower approximation, as the upper approxi-mation coincides with that of the traditional model. The three implicators all yield the same results, in both settings. It can again not be proven in general that the values of the lower approximation are the same using any of these three implicators. Instead, these results are due to our choice of
β. We have set this value to 0.97. Based on the definition of the β-precision quasi t-norm recalled in Section II-D, we know that the calculation of the minimum in expressions (12) and (13) only excludes themsmallest instances, wherem is determined by (14) and forβ = 0.97simplifies to
m= max i∈ {0, . . . , n} |i≤0.03 n X j=1 aj .
We can expect the right-hand side of the inequality to be low. In fact, since theaj’s are implication values, we know that it is bounded by0.03·n, withn=|L|for (12) andn=|L∪U|
for (13). As a result,m can be expected to be small as well and only a few implication values will be excluded in (12) and (13). As recalled in the derivations of (1) and (3), the lowest implication values are those for which y∈L∩co(A)in (12) and y ∈ (L∩co(A))∪U in (13). For such instances y, as noted above, we know that the implication values coincide. The low value ofmmakes it highly likely for such a value to be selected by the minimum, which is why the results of the three implicators coincide for our choice ofβ.
The performance of the lower approximation is better in the first setting than in the second, which is explained in the same way as the analogous conclusion for the traditional fuzzy rough set model. We do note that although the results for the first setting are close together, the decrease in performance in the second is not as great for theβ-precision fuzzy rough set model as it was for the traditional version. This may be due to
the intrinsic exclusion of instances in U that actually belong to the class from which the lower approximation is calculated in (13). As we discussed in Section III-B1, the inclusion of all instances of U is a shortcoming of the second setting for the traditional lower approximation.
C. Stability analysis
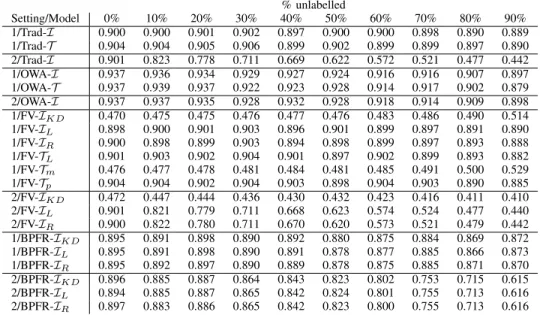
The second part of our experimental study evaluates the stability of the predictions by the different operators. The procedure for these calculations is described above. The results are presented in Table VII. Each value in this table is taken as an average over the 15 datasets in Table I and 50 runs for each dataset, where each run consists of randomly selecting 90% of the training set for use in the prediction step.
For the first setting, in general, the stability degrades only slightly for increasing percentages of unlabelled instances, which implies that the confidence with which predictions are made remains steady even when less information is available. The use of the second setting often leads to a larger drop in stability when the portion of unlabelled instances increases. This is noticeable for operators that also demonstrated a decrease in accuracy, as discussed in Section III-B. Amongst those models affected, the approximations of the β-precision fuzzy rough sets report the smallest decrease. For the OWA-based model, the stability of the first and second settings are comparable, as were their accuracy values. For all models, the best performing versions of the lower and upper approxima-tions yield comparable stability values.
The overall highest stability is found for the OWA-based fuzzy rough set model, which improves on the stability of the traditional model. The lower approximation of the fuzzy variable precision rough set model attains its lowest stability using IKD. The stability of the remaining two implicators
IL and IR is considerably better and there are only small differences between these two. The same conclusion was drawn for the prediction performance analysis. Similarly, for the upper approximation, the stability of the version using
Tm is noticeably lower than that of those which use TL and
Tp and it has already been observed that the accuracy of the approximation with this t-norm is lower as well. Finally, the lower approximation of theβ-precision fuzzy rough set model has a comparable stability for the three implicators.
D. Summary
Given the above investigation, a clearer perspective is now available in terms of those questions posed in the introduction of the paper and the beginning of this section.
1) How are the predictions, both w.r.t. accuracy and stabil-ity, of the fuzzy rough operators influenced by increasing levels of missing class labels?
Answer: when considering the best setting for each model, it is observed that the influence of the number of missing class labels is small, particularly when consid-ering the stability of the predictions. Small decreases in accuracy are reported when the percentage of unlabelled
instances increases, but this is to be expected and acceptable, as less information is available.
2) Are there notable differences between the two settings, that is, between using only L or bothL and U? If so, are there any benefits to including the unlabelled training instances in the predictions?
Answer: the second setting mostly provided poorer accuracy of results than the first. The exception to this was the OWA-based model where the results of the two settings were comparable. In general, the conclusion is that there is currently no clear benefit to allowing the unlabelled instances to participate in the initial predic-tion of a self-labelling method. However, some caupredic-tion should be taken when making this statement: only a naive approach in [11] has been tested which allows the involvement of unlabelled instances. Alternatives, that do not assume that every unlabelled instance belongs to its own individual class, may yield better prediction results (see discussion in conclusion section).
3) Can we nominate (based on the results) one particular operator as the most promising to be used for a self-labelling method?
Answer:overall, the OWA-based fuzzy rough set model yields the best performance using the lower approxima-tion. This operator also demonstrated the highest levels of stability among the evaluated set.
IV. CONCLUSION
Self-labelling is a popular approach in semi-supervised classi-fication, where only part of the training dataset is labelled. It is an iterative procedure which assigns labels to the unlabelled instances in the training set using a model built upon the la-belled part of the data. Fuzzy rough set theory, a mathematical tool used in machine learning, was applied for a simple self-labelling method in [8]. In order to extend this method and to make it competitive with state-of-the-art semi-supervised classifiers, some important questions were firstly considered. These questions have been given careful treatment here.
A substantial experimental analysis of both the predictive ability and prediction stability of the lower and upper ap-proximation operators of four fuzzy rough set models has been carried out. This helps to verify how the predictions of these operators are influenced by increasing percentages of missing labels. We evaluated two different settings; one where only labelled instances are used in the predictions and a second where the unlabelled instances are also employed. The experimental evaluation shows that the first setting is generally preferred, although this may be due to implementing an approach for the second setting which is perhaps too naive. As future work, it would be interesting to verify whether more advanced heuristics may improve the performance of the sec-ond setting. One possible area of exploration revolves around the idea of allowing unlabelled instances to partially contribute to the construction of the fuzzy rough approximations.
Amongst the fuzzy rough set models examined here, the OWA-based model seemed to offer the best performance,
Table VII
RESULTS OF THE STABILITY ANALYSIS
% unlabelled Setting/Model 0% 10% 20% 30% 40% 50% 60% 70% 80% 90% 1/Trad-I 0.900 0.900 0.901 0.902 0.897 0.900 0.900 0.898 0.890 0.889 1/Trad-T 0.904 0.904 0.905 0.906 0.899 0.902 0.899 0.899 0.897 0.890 2/Trad-I 0.901 0.823 0.778 0.711 0.669 0.622 0.572 0.521 0.477 0.442 1/OWA-I 0.937 0.936 0.934 0.929 0.927 0.924 0.916 0.916 0.907 0.897 1/OWA-T 0.937 0.939 0.937 0.922 0.923 0.928 0.914 0.917 0.902 0.879 2/OWA-I 0.937 0.937 0.935 0.928 0.932 0.928 0.918 0.914 0.909 0.898 1/FV-IKD 0.470 0.475 0.475 0.476 0.477 0.476 0.483 0.486 0.490 0.514 1/FV-IL 0.898 0.900 0.901 0.903 0.896 0.901 0.899 0.897 0.891 0.890 1/FV-IR 0.900 0.898 0.899 0.903 0.894 0.898 0.899 0.897 0.893 0.888 1/FV-TL 0.901 0.903 0.902 0.904 0.901 0.897 0.902 0.899 0.893 0.882 1/FV-Tm 0.476 0.477 0.478 0.481 0.484 0.481 0.485 0.491 0.500 0.529 1/FV-Tp 0.904 0.904 0.902 0.904 0.903 0.898 0.904 0.903 0.890 0.885 2/FV-IKD 0.472 0.447 0.444 0.436 0.430 0.432 0.423 0.416 0.411 0.410 2/FV-IL 0.901 0.821 0.779 0.711 0.668 0.623 0.574 0.524 0.477 0.440 2/FV-IR 0.900 0.822 0.780 0.711 0.670 0.620 0.573 0.521 0.479 0.442 1/BPFR-IKD 0.895 0.891 0.898 0.890 0.892 0.880 0.875 0.884 0.869 0.872 1/BPFR-IL 0.895 0.891 0.898 0.890 0.891 0.878 0.877 0.885 0.866 0.873 1/BPFR-IR 0.895 0.892 0.897 0.890 0.889 0.878 0.875 0.885 0.871 0.870 2/BPFR-IKD 0.896 0.885 0.887 0.864 0.843 0.823 0.802 0.753 0.715 0.615 2/BPFR-IL 0.894 0.885 0.887 0.865 0.842 0.824 0.801 0.755 0.713 0.616 2/BPFR-IR 0.897 0.883 0.886 0.865 0.842 0.823 0.800 0.755 0.713 0.616
specifically when using its associated lower approximation operator. It exhibited both the highest prediction accuracy and most stable results. Further tuning of this operator, for instance by using different aggregation weights or by using an intelligent combination of the lower and upper approximations, may further enhance its performance.
The integration of this model into a potential self-labelling method would form the next step in developing fuzzy rough set models as a basis for semi-supervised learning. A related aspect is the decision regarding when a prediction for an unlabelled instance can be considered sufficiently confident. This is an important factor as it affects the overall labelling of the data and can help to determine if an unlabelled instance should be assigned a particular label immediately or whether it should be postponed until a later iteration.
ACKNOWLEDGEMENT
Sarah Vluymans is supported by the Special Research Fund (BOF) of Ghent University. Chris Cornelis was partially supported by the Spanish Ministry of Science and Technol-ogy under the project TIN2014-57251-P and the Andalusian Research Plans P11-TIC-7765, P10-TIC-6858 and P12-TIC-2958.
REFERENCES
[1] O. Chapelle, B. Sch¨olkopf, A. Zien et al., Semi-supervised learning. MIT press Cambridge, 2006.
[2] X. Zhu and A. Goldberg, Introduction to Semi-Supervised Learning. Morgan & Claypool Publishers, 2009.
[3] I. Triguero, S. Garc´ıa, and F. Herrera, “Self-labeled techniques for semi-supervised learning: taxonomy, software and empirical study,” Knowledge and Information Systems, vol. 42, no. 2, pp. 245–284, 2013. [4] D. Dubois and H. Prade, “Rough fuzzy sets and fuzzy rough sets,” International Journal of General System, vol. 17, no. 2-3, pp. 191–209, 1990.
[5] L. Zadeh, “Fuzzy sets,”Information and control, vol. 8, no. 3, pp. 338– 353, 1965.
[6] Z. Pawlak, “Rough sets,”International Journal of Computer & Infor-mation Sciences, vol. 11, no. 5, pp. 341–356, 1982.
[7] S. Vluymans, L. D’eer, Y. Saeys, and C. Cornelis, “Applications of fuzzy rough set theory in machine learning: a survey,” Fundamenta Informaticae, vol. 142, no. 1-4, pp. 53–86, 2015.
[8] N. Mac Parthal´ain and R. Jensen, “Fuzzy-rough set based semi-supervised learning,” in Proceedings of the 2011 IEEE International Conference on Fuzzy Systems (FUZZ-IEEE). IEEE, pp. 2465–2472, 2011.
[9] I. Triguero, J. S´aez, J. Luengo, S. Garc´ıa, and F. Herrera, “On the characterization of noise filters for self-training semi-supervised in nearest neighbor classification,”Neurocomputing, vol. 132, pp. 30–41, 2014.
[10] L. D’eer, N. Verbiest, C. Cornelis, and L. Godo, “A comprehensive study of implicator–conjunctor-based and noise-tolerant fuzzy rough sets: Definitions, properties and robustness analysis,” Fuzzy Sets and Systems, vol. 275, pp. 1–38, 2015.
[11] R. Jensen, S. Vluymans, N. Mac Parthal´ain, C. Cornelis, and Y. Saeys, “Semi-supervised fuzzy-rough feature selection,” inProceedings of 15th International Conference on Rough Sets, Fuzzy Sets, Data Mining and Granular Computing (RSFDGrC2015), pp. 174–184, 2015.
[12] A. Radzikowska and E. Kerre, “A comparative study of fuzzy rough sets,”Fuzzy sets and systems, vol. 126, no. 2, pp. 137–155, 2002. [13] C. Cornelis, N. Verbiest, and R. Jensen, “Ordered weighted average
based fuzzy rough sets,” in Rough Set and Knowledge Technology. Springer, pp. 78–85, 2010.
[14] R. Yager, “On ordered weighted averaging aggregation operators in multicriteria decisionmaking,”IEEE Transactions on Systems, Man and Cybernetics, vol. 18, no. 1, pp. 183–190, 1988.
[15] M. Lamata and E. P´erez, “Obtaining OWA operators starting from a linear order and preference quantifiers,” International Journal of Intelligent Systems, vol. 27, no. 3, pp. 242–258, 2012.
[16] S. Zhao, E. Tsang, and D. Chen, “The model of fuzzy variable precision rough sets,” IEEE Transactions on Fuzzy Systems, vol. 17, no. 2, pp. 451–467, 2009.
[17] Q. Hu, L. Zhang, S. An, D. Zhang, and D. Yu, “On robust fuzzy rough set models,”IEEE Transactions on Fuzzy Systems, vol. 20, no. 4, pp. 636–651, 2012.
[18] J. Fern´andez Salido and S. Murakami, “Onβ-precision aggregation,” Fuzzy sets and systems, vol. 139, no. 3, pp. 547–558, 2003.
[19] Y. Saeys, T. Abeel, and Y. Van de Peer, “Robust feature selection using ensemble feature selection techniques,” inMachine learning and knowledge discovery in databases. Springer, pp. 313–325, 2008.