Appendices
A.
Data Selection For Empirical Analysis
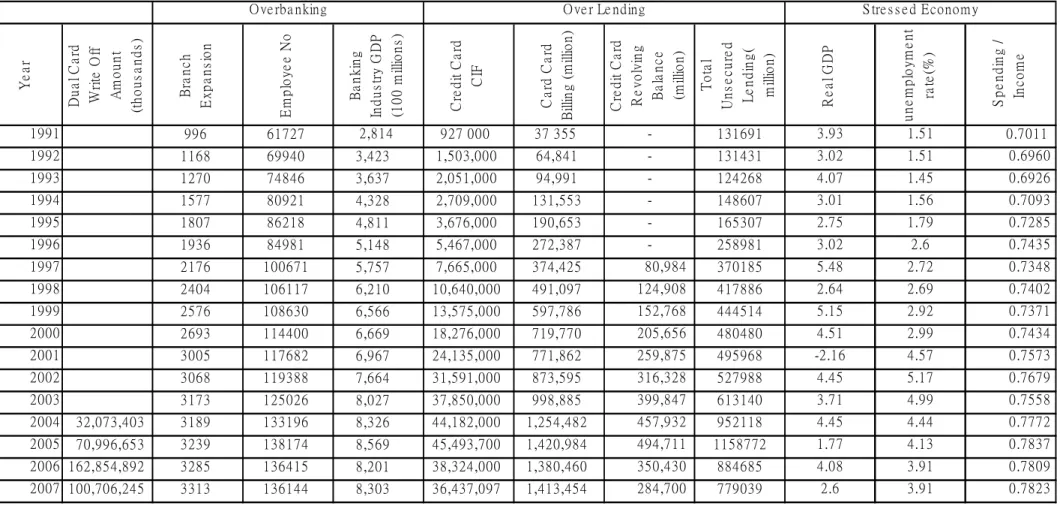
Table A-1
Data Sets from Period 1991 to 2007
Y
ear
D
u
al
C
ar
d
Wr
ite
O
ff
A
m
ount
(t
hous
a
nds
)
Br
a
n
c
h
Ex
pa
n
s
ion
E
m
pl
oy
e
e
N
o
Ba
n
k
in
g
Indu
s
tr
y
G
D
P
(1
0
0
m
illio
n
s
)
C
red
it
C
ar
d
CI
F
Ca
rd
Ca
rd
B
illin
g
(
m
illio
n
)
C
red
it
C
ar
d
Re
v
o
lv
in
g
Ba
la
n
c
e
(m
illio
n
)
To
ta
l
Un
s
e
c
u
re
d
L
e
n
di
ng(
m
illio
n
)
R
eal
G
D
P
une
m
pl
oy
m
e
nt
ra
te
(%
)
S
pe
ndi
ng
/
In
c
o
m
e
1991
996
61727
2,814
927 000
37 355
-
131691
3.93
1.51
0.7011
1992
1168
69940
3,423
1,503,000
64,841
-
131431
3.02
1.51
0.6960
1993
1270
74846
3,637
2,051,000
94,991
-
124268
4.07
1.45
0.6926
1994
1577
80921
4,328
2,709,000
131,553
-
148607
3.01
1.56
0.7093
1995
1807
86218
4,811
3,676,000
190,653
-
165307
2.75
1.79
0.7285
1996
1936
84981
5,148
5,467,000
272,387
-
258981
3.02
2.6
0.7435
1997
2176
100671
5,757
7,665,000
374,425
80,984
370185
5.48
2.72
0.7348
1998
2404
106117
6,210
10,640,000
491,097
124,908
417886
2.64
2.69
0.7402
1999
2576
108630
6,566
13,575,000
597,786
152,768
444514
5.15
2.92
0.7371
2000
2693
114400
6,669
18,276,000
719,770
205,656
480480
4.51
2.99
0.7434
2001
3005
117682
6,967
24,135,000
771,862
259,875
495968
-2.16
4.57
0.7573
2002
3068
119388
7,664
31,591,000
873,595
316,328
527988
4.45
5.17
0.7679
2003
3173
125026
8,027
37,850,000
998,885
399,847
613140
3.71
4.99
0.7558
2004
32,073,403
3189
133196
8,326
44,182,000
1,254,482
457,932
952118
4.45
4.44
0.7772
2005
70,996,653
3239
138174
8,569
45,493,700
1,420,984
494,711
1158772
1.77
4.13
0.7837
2006 162,854,892
3285
136415
8,201
38,324,000
1,380,460
350,430
884685
4.08
3.91
0.7809
2007 100,706,245
3313
136144
8,303
36,437,097
1,413,454
284,700
779039
2.6
3.91
0.7823
O ve rba nking
O ve r Le nding
S tre s s e d Economy
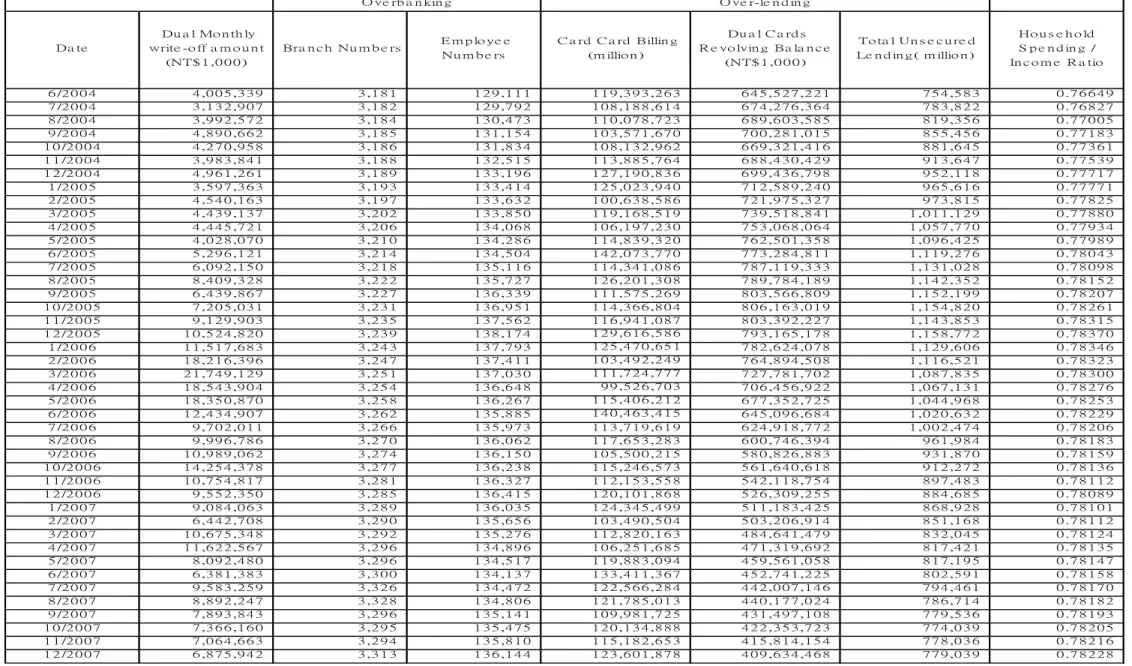
Table A-2
Data Sets from June 2004 to December 2007
Da te Du a l Mo n th ly write -o ff a m o u n t (NT$ 1 ,0 0 0 ) Bra n c h Nu m b e rs E m p lo ye e Nu m b e rs C a rd C a rd Billin g (m illio n ) Du a l C a rd s R e vo lvin g Ba la n c e (NT$ 1 ,0 0 0 ) To ta l Un s e c u re d Le n d in g ( m illio n ) Ho u s e h o ld S p e n d in g / In c o m e R a tio 6 /2 0 0 4 4 ,0 0 5 ,3 3 9 3 ,1 8 1 1 2 9 ,1 1 1 1 1 9 ,3 9 3 ,2 6 3 6 4 5 ,5 2 7 ,2 2 1 7 5 4 ,5 8 3 0 .7 6 6 4 9 7 /2 0 0 4 3 ,1 3 2 ,9 0 7 3 ,1 8 2 1 2 9 ,7 9 2 1 0 8 ,1 8 8 ,6 1 4 6 7 4 ,2 7 6 ,3 6 4 7 8 3 ,8 2 2 0 .7 6 8 2 7 8 /2 0 0 4 3 ,9 9 2 ,5 7 2 3 ,1 8 4 1 3 0 ,4 7 3 1 1 0 ,0 7 8 ,7 2 3 6 8 9 ,6 0 3 ,5 8 5 8 1 9 ,3 5 6 0 .7 7 0 0 5 9 /2 0 0 4 4 ,8 9 0 ,6 6 2 3 ,1 8 5 1 3 1 ,1 5 4 1 0 3 ,5 7 1 ,6 7 0 7 0 0 ,2 8 1 ,0 1 5 8 5 5 ,4 5 6 0 .7 7 1 8 3 1 0 /2 0 0 4 4 ,2 7 0 ,9 5 8 3 ,1 8 6 1 3 1 ,8 3 4 1 0 8 ,1 3 2 ,9 6 2 6 6 9 ,3 2 1 ,4 1 6 8 8 1 ,6 4 5 0 .7 7 3 6 1 1 1 /2 0 0 4 3 ,9 8 3 ,8 4 1 3 ,1 8 8 1 3 2 ,5 1 5 1 1 3 ,8 8 5 ,7 6 4 6 8 8 ,4 3 0 ,4 2 9 9 1 3 ,6 4 7 0 .7 7 5 3 9 1 2 /2 0 0 4 4 ,9 6 1 ,2 6 1 3 ,1 8 9 1 3 3 ,1 9 6 1 2 7 ,1 9 0 ,8 3 6 6 9 9 ,4 3 6 ,7 9 8 9 5 2 ,1 1 8 0 .7 7 7 1 7 1 /2 0 0 5 3 ,5 9 7 ,3 6 3 3 ,1 9 3 1 3 3 ,4 1 4 1 2 5 ,0 2 3 ,9 4 0 7 1 2 ,5 8 9 ,2 4 0 9 6 5 ,6 1 6 0 .7 7 7 7 1 2 /2 0 0 5 4 ,5 4 0 ,1 6 3 3 ,1 9 7 1 3 3 ,6 3 2 1 0 0 ,6 3 8 ,5 8 6 7 2 1 ,9 7 5 ,3 2 7 9 7 3 ,8 1 5 0 .7 7 8 2 5 3 /2 0 0 5 4 ,4 3 9 ,1 3 7 3 ,2 0 2 1 3 3 ,8 5 0 1 1 9 ,1 6 8 ,5 1 9 7 3 9 ,5 1 8 ,8 4 1 1 ,0 1 1 ,1 2 9 0 .7 7 8 8 0 4 /2 0 0 5 4 ,4 4 5 ,7 2 1 3 ,2 0 6 1 3 4 ,0 6 8 1 0 6 ,1 9 7 ,2 3 0 7 5 3 ,0 6 8 ,0 6 4 1 ,0 5 7 ,7 7 0 0 .7 7 9 3 4 5 /2 0 0 5 4 ,0 2 8 ,0 7 0 3 ,2 1 0 1 3 4 ,2 8 6 1 1 4 ,8 3 9 ,3 2 0 7 6 2 ,5 0 1 ,3 5 8 1 ,0 9 6 ,4 2 5 0 .7 7 9 8 9 6 /2 0 0 5 5 ,2 9 6 ,1 2 1 3 ,2 1 4 1 3 4 ,5 0 4 1 4 2 ,0 7 3 ,7 7 0 7 7 3 ,2 8 4 ,8 1 1 1 ,1 1 9 ,2 7 6 0 .7 8 0 4 3 7 /2 0 0 5 6 ,0 9 2 ,1 5 0 3 ,2 1 8 1 3 5 ,1 1 6 1 1 4 ,3 4 1 ,0 8 6 7 8 7 ,1 1 9 ,3 3 3 1 ,1 3 1 ,0 2 8 0 .7 8 0 9 8 8 /2 0 0 5 8 ,4 0 9 ,3 2 8 3 ,2 2 2 1 3 5 ,7 2 7 1 2 6 ,2 0 1 ,3 0 8 7 8 9 ,7 8 4 ,1 8 9 1 ,1 4 2 ,3 5 2 0 .7 8 1 5 2 9 /2 0 0 5 6 ,4 3 9 ,8 6 7 3 ,2 2 7 1 3 6 ,3 3 9 1 1 1 ,5 7 5 ,2 6 9 8 0 3 ,5 6 6 ,8 0 9 1 ,1 5 2 ,1 9 9 0 .7 8 2 0 7 1 0 /2 0 0 5 7 ,2 0 5 ,0 3 1 3 ,2 3 1 1 3 6 ,9 5 1 1 1 4 ,3 6 6 ,8 0 4 8 0 6 ,1 6 3 ,0 1 9 1 ,1 5 4 ,8 2 0 0 .7 8 2 6 1 1 1 /2 0 0 5 9 ,1 2 9 ,9 0 3 3 ,2 3 5 1 3 7 ,5 6 2 1 1 6 ,9 4 1 ,0 8 7 8 0 3 ,3 9 2 ,2 2 7 1 ,1 4 3 ,8 5 3 0 .7 8 3 1 5 1 2 /2 0 0 5 1 0 ,5 2 4 ,8 2 0 3 ,2 3 9 1 3 8 ,1 7 4 1 2 9 ,6 1 6 ,5 8 6 7 9 3 ,1 6 5 ,1 7 8 1 ,1 5 8 ,7 7 2 0 .7 8 3 7 0 1 /2 0 0 6 1 1 ,5 1 7 ,6 8 3 3 ,2 4 3 1 3 7 ,7 9 3 1 2 5 ,4 7 0 ,6 5 1 7 8 2 ,6 2 4 ,0 7 8 1 ,1 2 9 ,6 0 6 0 .7 8 3 4 6 2 /2 0 0 6 1 8 ,2 1 6 ,3 9 6 3 ,2 4 7 1 3 7 ,4 1 1 1 0 3 ,4 9 2 ,2 4 9 7 6 4 ,8 9 4 ,5 0 8 1 ,1 1 6 ,5 2 1 0 .7 8 3 2 3 3 /2 0 0 6 2 1 ,7 4 9 ,1 2 9 3 ,2 5 1 1 3 7 ,0 3 0 1 1 1 ,7 2 4 ,7 7 7 7 2 7 ,7 8 1 ,7 0 2 1 ,0 8 7 ,8 3 5 0 .7 8 3 0 0 4 /2 0 0 6 1 8 ,5 4 3 ,9 0 4 3 ,2 5 4 1 3 6 ,6 4 8 9 9 ,5 2 6 ,7 0 3 7 0 6 ,4 5 6 ,9 2 2 1 ,0 6 7 ,1 3 1 0 .7 8 2 7 6 5 /2 0 0 6 1 8 ,3 5 0 ,8 7 0 3 ,2 5 8 1 3 6 ,2 6 7 1 1 5 ,4 0 6 ,2 1 2 6 7 7 ,3 5 2 ,7 2 5 1 ,0 4 4 ,9 6 8 0 .7 8 2 5 3 6 /2 0 0 6 1 2 ,4 3 4 ,9 0 7 3 ,2 6 2 1 3 5 ,8 8 5 1 4 0 ,4 6 3 ,4 1 5 6 4 5 ,0 9 6 ,6 8 4 1 ,0 2 0 ,6 3 2 0 .7 8 2 2 9 7 /2 0 0 6 9 ,7 0 2 ,0 1 1 3 ,2 6 6 1 3 5 ,9 7 3 1 1 3 ,7 1 9 ,6 1 9 6 2 4 ,9 1 8 ,7 7 2 1 ,0 0 2 ,4 7 4 0 .7 8 2 0 6 8 /2 0 0 6 9 ,9 9 6 ,7 8 6 3 ,2 7 0 1 3 6 ,0 6 2 1 1 7 ,6 5 3 ,2 8 3 6 0 0 ,7 4 6 ,3 9 4 9 6 1 ,9 8 4 0 .7 8 1 8 3 9 /2 0 0 6 1 0 ,9 8 9 ,0 6 2 3 ,2 7 4 1 3 6 ,1 5 0 1 0 5 ,5 0 0 ,2 1 5 5 8 0 ,8 2 6 ,8 8 3 9 3 1 ,8 7 0 0 .7 8 1 5 9 1 0 /2 0 0 6 1 4 ,2 5 4 ,3 7 8 3 ,2 7 7 1 3 6 ,2 3 8 1 1 5 ,2 4 6 ,5 7 3 5 6 1 ,6 4 0 ,6 1 8 9 1 2 ,2 7 2 0 .7 8 1 3 6 1 1 /2 0 0 6 1 0 ,7 5 4 ,8 1 7 3 ,2 8 1 1 3 6 ,3 2 7 1 1 2 ,1 5 3 ,5 5 8 5 4 2 ,1 1 8 ,7 5 4 8 9 7 ,4 8 3 0 .7 8 1 1 2 1 2 /2 0 0 6 9 ,5 5 2 ,3 5 0 3 ,2 8 5 1 3 6 ,4 1 5 1 2 0 ,1 0 1 ,8 6 8 5 2 6 ,3 0 9 ,2 5 5 8 8 4 ,6 8 5 0 .7 8 0 8 9 1 /2 0 0 7 9 ,0 8 4 ,0 6 3 3 ,2 8 9 1 3 6 ,0 3 5 1 2 4 ,3 4 5 ,4 9 9 5 1 1 ,1 8 3 ,4 2 5 8 6 8 ,9 2 8 0 .7 8 1 0 1 2 /2 0 0 7 6 ,4 4 2 ,7 0 8 3 ,2 9 0 1 3 5 ,6 5 6 1 0 3 ,4 9 0 ,5 0 4 5 0 3 ,2 0 6 ,9 1 4 8 5 1 ,1 6 8 0 .7 8 1 1 2 3 /2 0 0 7 1 0 ,6 7 5 ,3 4 8 3 ,2 9 2 1 3 5 ,2 7 6 1 1 2 ,8 2 0 ,1 6 3 4 8 4 ,6 4 1 ,4 7 9 8 3 2 ,0 4 5 0 .7 8 1 2 4 4 /2 0 0 7 1 1 ,6 2 2 ,5 6 7 3 ,2 9 6 1 3 4 ,8 9 6 1 0 6 ,2 5 1 ,6 8 5 4 7 1 ,3 1 9 ,6 9 2 8 1 7 ,4 2 1 0 .7 8 1 3 5 5 /2 0 0 7 8 ,0 9 2 ,4 8 0 3 ,2 9 6 1 3 4 ,5 1 7 1 1 9 ,8 8 3 ,0 9 4 4 5 9 ,5 6 1 ,0 5 8 8 1 7 ,1 9 5 0 .7 8 1 4 7 6 /2 0 0 7 6 ,3 8 1 ,3 8 3 3 ,3 0 0 1 3 4 ,1 3 7 1 3 3 ,4 1 1 ,3 6 7 4 5 2 ,7 4 1 ,2 2 5 8 0 2 ,5 9 1 0 .7 8 1 5 8 7 /2 0 0 7 9 ,5 8 3 ,2 5 9 3 ,3 2 6 1 3 4 ,4 7 2 1 2 2 ,5 6 6 ,2 8 4 4 4 2 ,0 0 7 ,1 4 6 7 9 4 ,4 6 1 0 .7 8 1 7 0 8 /2 0 0 7 8 ,8 9 2 ,2 4 7 3 ,3 2 8 1 3 4 ,8 0 6 1 2 1 ,7 8 5 ,0 1 3 4 4 0 ,1 7 7 ,0 2 4 7 8 6 ,7 1 4 0 .7 8 1 8 2 9 /2 0 0 7 7 ,8 9 3 ,8 4 3 3 ,2 9 6 1 3 5 ,1 4 1 1 0 9 ,9 8 1 ,7 2 5 4 3 1 ,4 9 7 ,1 0 8 7 7 9 ,5 3 6 0 .7 8 1 9 3 1 0 /2 0 0 7 7 ,3 6 6 ,1 6 0 3 ,2 9 5 1 3 5 ,4 7 5 1 2 0 ,1 3 4 ,8 8 8 4 2 2 ,3 5 3 ,7 2 3 7 7 4 ,0 3 9 0 .7 8 2 0 5 O ve rb a n kin g O ve r-le n d in gB.
National Credit Card Center
By 1980, the Ministry of Finance authorized a banking committee (Taiwan Bank, First
Commercial Bank, ICBC, Taiwan Middle and Small Enterprise, Cathay Trust, and China
Trust Investment) to form a separate committee to study the feasibility of developing plastic
payment in Taiwan.
Soon, in 1983, the National Union Card Center was setup to issue Union Card for
domestic transactions when the New Taiwan Dollar was not one of the international clearing
currencies, and in the following year, the center was renamed as National Credit Card
(NCC), and renamed again in 1988 as National Credit Card Center (NCCC), with setup of
over 200,000 merchant acceptance and 25 alliance banks to issue cards. By 1989, VISA
NT dollar card was introduced, and MasterCard NT dollar card came in the following year.
20
Before the NCCC was set up, the key players were mostly foreign banks, which
included Citibank, Bank of American, and American Express. Credit card was not a
popular payment media,
With support from VISA and the bank committee, NCCC was set up to process
domestic clearing and settlement and to support the electronic transaction exchange from
merchant acquiring bank to issuing bank, and at that time, new Taiwanese dollar was not an
international clearing currency, and international organization such as VISA or MasterCard
did not support NTD clearing and settlement.
The fee that NCCC charges includes the setup fee or joining fee, and a 50 basis charge
on the transaction amount to the acquiring bank and issuing bank. The revenues from the
fees are used to support to the operation of the NCCC, expansion of the merchant network,
network, system infrastructure, and development of future payment products.
20
C.
Join Credit Information Center
Joint Credit Information Center (JCIC) was established in 1975 under the Bankers
Association of Taipei, and is responsible for collecting, processing, and exchanging credit
data among financial institutions. In the 17 years of operation, JCIC keeps expanding its
business. As a result, the Bankers Association of Taipei decided in 1992 to donate all the
operating surplus of JCIC to establish the non-profit “Foundation of Joint Credit
Information Center”. The new JCIC continues to serve member institutions by providing
accurate and quality credit information on a user pay basis.
21
D.
Financial Supervisory Commission
In order to promote consolidated financial supervision, the Legislative Yuan passed the
Act of Governing the Establishment and Organization of the Financial Supervisory
Commission of the Executive Yuan on July 10, 2003. A new agency, named the Financial
Supervisory Commission (FSC), was set up on July 1 2004 to consolidate the supervision of
banking, securities and insurance industries under one roof, as well as to integrate the tasks
of examining these industries.
22
21
http://www.jcic.org.tw/history_eng.htm
22
E.
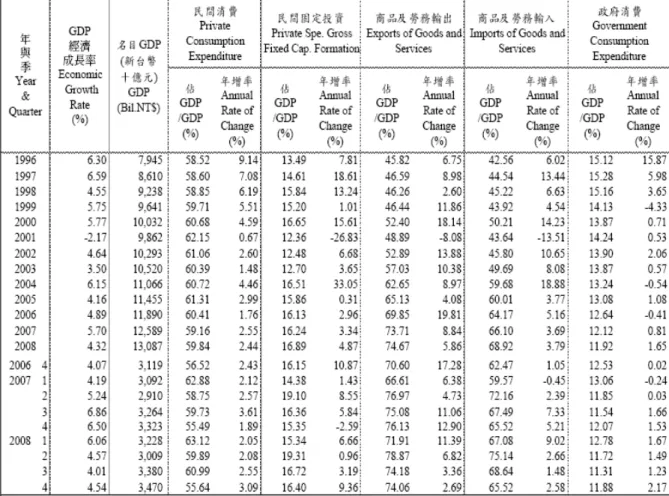
GDP Detail Break Down
This chapter provides the break down of the GDP from 1996 to April 2008. One of
the main reasons for the negative GDP for 2001 was lack of domestic and foreign
investment activity.
Table A-3
GDP Detail Break Down
F.
Financial Performance of ChinaTrust FHC and Taishin FHC
From the examination of 13 FHCs’ banking income statements, given there is one FSC
does not have a bank as its subsidiary, the top 3 banks that have huge reduction in the interest
income, for the fiscal year of 2005 and 2007, are Taishin Bank (45% reduction), ChinaTrust
(43% reduction), and Sinopac (41% reduction).
23
Furthermore, data also shows there is a
shift from consumer finance as major source of income to other businesses. Since Taishin
and ChinaTrust are the 2 largest credit card issuers, and have the greatest reduction of
interest income, this chapter takes a closer examination of the 2 FHCs, Taishin FHC and
China Trust FHC.
According to Taishin FHC’s annual reports, Taishin FHC has suffered loss since 2005.
Troubled financial performance is mainly due to their business weight on credit cards and
cash cards. Taishin is the largest cash card issuer and the 2
nd
largest credit card issuer in
2005.
Table A-4
Taishin Financial Holding Co Ltd: Operational Indicators
Unit: millions
2004 2005
2006
Net Operating Revenue
NT$59.1
NT$85.3
n/a
Net profit
NT$11.3
(NT$1.2)
(NT$8.0)
Number of employees
10289
10752
9515
Source: Taishin Bank’s Annual Report
In terms of sales revenue contribution in the banking business, dual card, credit card
combined with cash card, accounted for 42% in 2004, 50% in 2005, but has reduced to 43%
in 2006. The credit card share has decreased from 27% of the net sales revenue in 2005 to
21% in 2006, and its corporate business then showed a sign of increase as a result.
23
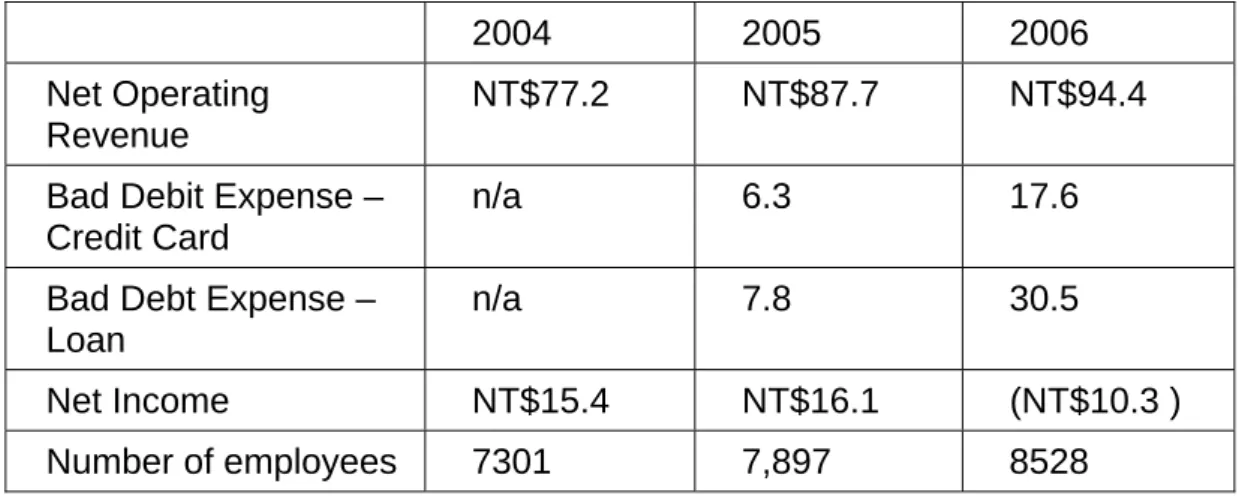
In terms of financial performance of China Trust FHC, she has suffered a loss in 2006,
including bad debt expense of 17.6 million in 2006 and only 6.3 million in 2005. The credit
card revenue only accounted for 26% of the business in 2004, and has increased to 31% in
2005.
Table A-5
Chinatrust Financial Holding Co Ltd: Operational Indicators
Unit: millions
2004
2005
2006
Net Operating
Revenue
NT$77.2 NT$87.7 NT$94.4
Bad Debit Expense –
Credit Card
n/a 6.3 17.6
Bad Debt Expense –
Loan
n/a 7.8 30.5
Net Income
NT$15.4
NT$16.1
(NT$10.3 )
Number of employees
7301
7,897
8528
G.
Domestic Banks’ Abridged Income Statement, Consolidated by FSC
Table A-6
Fubon Bank’s Abridged Income Statement
Unit: Million NTD
Tota l
Inte re s t
Income
S e rvice
Income
Ga in of
Fina ncia l
As s e t
a nd
Lia bilitie s
Othe rs
Tota l
Inte re s t
Expe ns e
S e rvice
Expe ns e
Ga in of
Fina ncia l
As s e t
a nd
Lia bilitie s
P e rs onne
l
Expe ns e
Othe rs
2005
Fubon Ba nk
50,796
34,925
9,227
4,044
-
2,600
44,017
19,398
3,997
4,744
15,879
3,643
1 0,422
2006
Fubon Ba nk
82,271
41,567
10,047
3,799
26,857
83,003
23,293
4,340
3,239
5,209
46,922
5 58
-173
2007
Fubon Ba nk
86,640
37,040
9,488
37,024
3,088
82,410
19,859
2,243
36,424
5,753
18,130
-
4,231
Othe r
Ga ins or
Los e s
Income
Be fore
Income
Ta x
Ye a r
Na me
Re ve nue
Expe ns e
Table A-7
Hua Nan Bank’s Abridged Income Statement
Unit: Million NTD
Tota l
Inte re s t
Income
S e rvice
Income
Ga in of
Fina ncia l
As s e t
a nd
Lia bilitie s
Othe rs
Tota l
Inte re s t
Expe ns e
S e rvice
Expe ns e
Ga in of
Fina ncia l
As s e t
a nd
Lia bilitie s
P e rs onne
l
Expe ns e
Othe rs
2005
Hua Na n Ba nk
53,361
37,900
4,337
3,742
-
7,382
43,398
20,605
879
8,678
13,235
1,991
11,954
2006
Hua Na n Ba nk
72,544
50,161
4,823
10,247
7,314
62,511
27,349
1,072
8,479
8,812
16,800
1,173
11,205
2007
Hua Na n Ba nk
78,068
55,970
6,654
9,529
5,916
66,055
30,717
1,344
9,578
9,078
15,339
-
12,013
Othe r
Ga ins or
Los e s
Income
Be fore
Income
Ta x
Ye a r
Na me
Re ve nue
Expe ns e
Table A-8
China Development Bank’s Abridged Income Statement
Unit: Million NTD
Tota l
Inte re s t
Income
S e rvice
Income
Ga in of
Fina ncia l
As s e t
a nd
Lia bilitie s
Othe rs
Tota l
Inte re s t
Expe ns e
S e rvice
Expe ns e
Ga in of
Fina ncia l
As s e t
a nd
Lia bilitie s
P e rs onne
l
Expe ns e
Othe rs
2005
China De ve lopme nt Ba nk
9,045
3,078
562
187
490
4,728
4,613
1,387
35
1,184
2,007
6,144
10,576
2006
China De ve lopme nt Ba nk
33,362
3,945
361
7,122
21,934
19,204
2,184
16
4,679
1,454
10,870
219
14,378
2007
China De ve lopme nt Ba nk
45,791
5,904
314
15,453
24,119
32,957
3,459
91
15,673
1,432
12,303
-
12,833
Othe r
Ga ins or
Los e s
Income
Be fore
Income
Ta x
Ye a r
Na me
Re ve nue
Expe ns e
Table A-9
Cathay Bank’s Abridged Income Statement
Unit: Million NTD
Tota l
Inte re s t
Income
S e rvice
Income
Ga in of
Fina ncia l
As s e t
a nd
Lia bilitie s
Othe rs
Tota l
Inte re s t
Expe ns e
S e rvice
Expe ns e
Ga in of
Fina ncia l
As s e t
a nd
Lia bilitie s
P e rs onne
l
Expe ns e
Othe rs
2005
Ca tha y Ba nk
53,976
39,768
6,835
933
-
6,440
48,529
12,929
1,378
4,735
29,485
-335
5,11 2
2006
Ca tha y Ba nk
70,608
40,867
5,694
7,536
16,511
77,030
17,009
1,168
8,276
4,516
46,061
58 7
-5,835
2007
Ca tha y Ba nk
79,251
40,285
6,434
28,874
3,658
71,125
19,121
1,302
29,333
6,485
14,885
-
8,126
Othe r
Ga ins or
Los e s
Income
Be fore
Income
Ta x
Ye a r
Na me
Re ve nue
Expe ns e
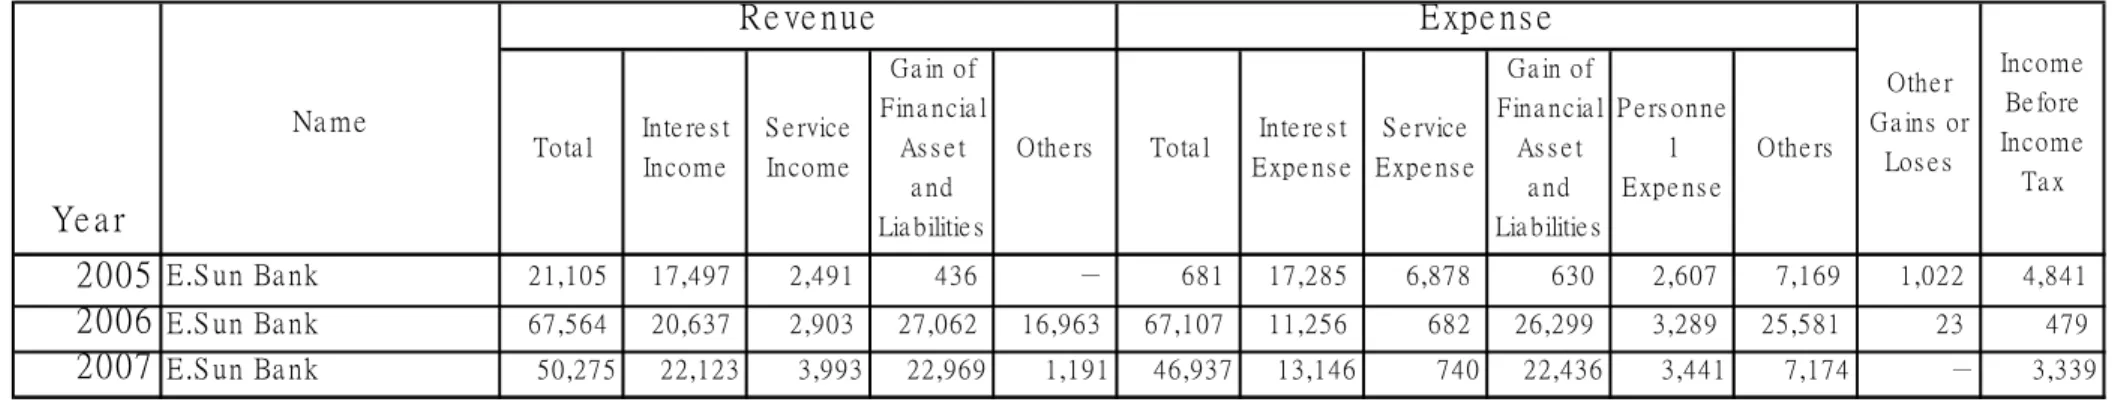
Table A-10
E. SUN Bank’s Abridged Income Statement
Unit: Million NTD
Tota l
Inte re s t
Income
S e rvice
Income
Ga in of
Fina ncia l
As s e t
a nd
Lia bilitie s
Othe rs
Tota l
Inte re s t
Expe ns e
S e rvice
Expe ns e
Ga in of
Fina ncia l
As s e t
a nd
Lia bilitie s
P e rs onne
l
Expe ns e
Othe rs
2005
E.S un Ba nk
21,105
17,497
2,491
436
-
681
17,285
6,878
630
2,607
7,169
1,022
4,841
2006
E.S un Ba nk
67,564
20,637
2,903
27,062
16,963
67,107
11,256
682
26,299
3,289
25,581
23
479
2007
E.S un Ba nk
50,275
22,123
3,993
22,969
1,191
46,937
13,146
740
22,436
3,441
7,174
-
3,339
Othe r
Ga ins or
Los e s
Income
Be fore
Income
Ta x
Ye a r
Na me
Re ve nue
Expe ns e
Table A-11
Mega Bank’s Abridged Income Statement
Unit: Million NTD
Tota l
Inte re s t
Income
S e rvice
Income
Ga in of
Fina ncia l
As s e t
a nd
Lia bilitie s
Othe rs
Tota l
Inte re s t
Expe ns e
S e rvice
Expe ns e
Ga in of
Fina ncia l
As s e t
a nd
Lia bilitie s
P e rs onne
l
Expe ns e
Othe rs
2005
Me ga Ba nk
15,795
11,879
2,357
1,014
-47
592
12,916
4,530
226
2,903
5,257
181
3,060
2006
Me ga Ba nk
81,053
57,029
6,095
5,010
12,919
66,235
37,284
835
782
9,235
18,099
715
15,533
2007
Me ga Ba nk
83,812
61,396
7,030
5,696
9,690
66,469
38,970
777
2,061
8,718
15,943
-
17,342
Othe r
Ga ins or
Los e s
Income
Be fore
Income
Ta x
Ye a r
Na me
Re ve nue
Expe ns e
Table A-12
Yuanta Bank’s Abridged Income Statement
Unit: Million NTD
Tota l
Inte re s t
Income
S e rvice
Income
Ga in of
Fina ncia l
As s e t
a nd
Lia bilitie s
Othe rs
Tota l
Inte re s t
Expe ns e
S e rvice
Expe ns e
Ga in of
Fina ncia l
As s e t
a nd
Lia bilitie s
P e rs onne
l
Expe ns e
Othe rs
2005
Yua nta Ba nk
11,784
9,969
1,764
-142
6
187
11,991
4,132
523
2,110
5,226
312
105
2006
Yua nta Ba nk
17,363
10,883
1,346
2,111
3,023
22,848
5,035
354
1,834
2,555
13,070
11
-5,4 74
2007
Yua nta Ba nk
20,401
11,140
1,404
5,491
2,366
22,845
5,522
350
5,670
2,789
8,512
-
-2,443
Othe r
Ga ins or
Los e s
Income
Be fore
Income
Ta x
Ye a r
Na me
Re ve nue
Expe ns e
Table A-13
Taishin Bank’s Abridged Income Statement
Unit: Million NTD
Tota l
Inte re s t
Income
S e rvice
Income
Ga in of
Fina ncia l
As s e t
a nd
Lia bilitie s
Othe rs
Tota l
Inte re s t
Expe ns e
S e rvice
Expe ns e
Ga in of
Fina ncia l
As s e t
a nd
Lia bilitie s
P e rs onne
l
Expe ns e
Othe rs
2005
Ta is hin Ba nk
62,343
48,279
9,232
1,146
741
2,946
49,952
11,687
5,127
7,229
25,910
751
13 ,142
2006
Ta is hin Ba nk
106,011
38,828
7,568
15,354
44,261
126,737
14,257
2,124
13,019
7,267
90,0 71
155
-20,571
2007
Ta is hin Ba nk
101,394
32,537
8,427
35,237
25,192
98,356
16,038
1,864
33,287
7,077
40,09 1
-
3,038
Othe r
Ga ins or
Los e s
Income
Be fore
Income
Ta x
Ye a r
Na me
Re ve nue
Expe ns e
Table A-14
Shin Kong Bank’s Abridged Income Statement
Unit: Million NTD
Tota l
Inte re s t
Income
S e rvice
Income
Ga in of
Fina ncia l
As s e t
a nd
Lia bilitie s
Othe rs
Tota l
Inte re s t
Expe ns e
S e rvice
Expe ns e
Ga in of
Fina ncia l
As s e t
a nd
Lia bilitie s
P e rs onne
l
Expe ns e
Othe rs
2005
S hin Kong Ba nk
15,491
12,846
2,077
16
-176
728
16,392
4,021
577
2,821
8,973
568
-333
2006
S hin Kong Ba nk
16,666
11,728
1,596
780
2,562
24,436
4,592
448
308
2,684
16,404
17
-7,754
2007
S hin Kong Ba nk
21,010
12,266
2,228
135
6,381
19,548
5,803
486
528
2,774
9,957
-
1 ,462
Othe r
Ga ins or
Los e s
Income
Be fore
Income
Ta x
Ye a r
Na me
Re ve nue
Expe ns e
Table A-15
SinoPac Bank’s Abridged Income Statement
Unit: Million NTD
Tota l
Inte re s t
Income
S e rvice
Income
Ga in of
Fina ncia l
As s e t
a nd
Lia bilitie s
Othe rs
Tota l
Inte re s t
Expe ns e
S e rvice
Expe ns e
Ga in of
Fina ncia l
As s e t
a nd
Lia bilitie s
P e rs onne
l
Expe ns e
Othe rs
2005
S inopa c Ba nk
18,826
15,855
2,026
1,045
95
-194
16,386
10,133
201
2,905
3,147
139
2,579
2006
S inopa c Ba nk
63,954
24,289
2,112
12,928
24,624
61,679
16,162
271
12,385
3,542
29,320
23 2
2,506
2007
S inopa c Ba nk
97,443
41,979
4,744
21,479
29,241
97,484
28,618
579
24,074
6,063
38,149
-
-41
Othe r
Ga ins or
Los e s
Income
Be fore
Income
Ta x
Ye a r
Na me
Re ve nue
Expe ns e
Table A-16
Chinatrust Bank’s Abridged Income Statement
Unit: Million NTD
Tota l
Inte re s t
Income
S e rvice
Income
Ga in of
Fina ncia l
As s e t
a nd
Lia bilitie s
Othe rs
Tota l
Inte re s t
Expe ns e
S e rvice
Expe ns e
Ga in of
Fina ncia l
As s e t
a nd
Lia bilitie s
P e rs onne
l
Expe ns e
Othe rs
2005
China Trus t Ba nk
80,472
53,545
18,620
2,326
-
5,981
62,847
17,292
536
12,459
32,561
-1,002
16,623
2006
China Trus t Ba nk
165,359
54,868
18,782
68,991
22,718
183,161
24,018
628
65,072
12,160
81,2 84
-39
-17,841
2007
China Trus t Ba nk
209,396
49,632
24,661
114,146
20,957
196,139
26,435
1,015
111,717
12,143
44,829
-
13,256
Othe r
Ga ins or
Los e s
Income
Be fore
Income
Ta x
Ye a r
Na me
Re ve nue
Expe ns e
Table A-17
First Bank’s Abridged Income Statement
Unit: Million NTD
Tota l
Inte re s t
Income
S e rvice
Income
Ga in of
Fina ncia l
As s e t
a nd
Lia bilitie s
Othe rs
Tota l
Inte re s t
Expe ns e
S e rvice
Expe ns e
Ga in of
Fina ncia l
As s e t
a nd
Lia bilitie s
P e rs onne
l
Expe ns e
Othe rs
2005
Firs t Comme rica l Ba nk
53,174
40,924
4,712
68
150
7,319
40,197
20,928
953
8,781
9,535
664
13,640
2006
Firs t Comme rica l Ba nk
70,721
46,962
5,569
10,851
7,340
57,016
26,349
1,074
9,560
8,693
11,340
56 3
14,269
2007
Firs t Comme rica l Ba nk
94,992
52,839
7,960
18,832
15,361
79,140
30,783
1,076
17,004
8,888
21,389
-
15,851
Othe r
Ga ins or
Los e s
Income
Be fore
Income
Ta x
Ye a r
Na me
Re ve nue
Expe ns e
Table A-18
Jih Sun Bank’s Abridged Income Statement
Unit: Million NTD
Tota l
Inte re s t
Income
S e rvice
Income
Ga in of
Fina ncia l
As s e t
a nd
Lia bilitie s
Othe rs
Tota l
Inte re s t
Expe ns e
S e rvice
Expe ns e
Ga in of
Fina ncia l
As s e t
a nd
Lia bilitie s
P e rs onne
l
Expe ns e
Othe rs
2005
J ih S un Ba nk
13,933
11,854
1,717
156
44
162
19,575
3,959
1,285
2,314
12,017
51
-5,590
2006
J ih S un Ba nk
22,529
10,777
1,411
2,318
8,022
36,940
4,343
1,241
2,573
1,980
26,803
63
-1 4,348
2007
J ih S un Ba nk
18,289
8,718
1,894
817
6,859
21,393
4,171
768
1,018
1,775
13,661
-
-3,104
Othe r
Ga ins or
Los e s
Income
Be fore
Income
Ta x
Ye a r
Na me
Re ve nue
Expe ns e