Sheridan College Sheridan College
SOURCE: Sheridan Scholarly Output, Research, and Creative
SOURCE: Sheridan Scholarly Output, Research, and Creative
Excellence
Excellence
Faculty of Applied Science and Technology - Exceptional Student Work, Applied Computing
Theses Exceptional Student Work
2-2019
Bench Tracker: Improving Actionable Insights in Smartwatch
Bench Tracker: Improving Actionable Insights in Smartwatch
Fitness Application by Increasing Usability Through Simplification
Fitness Application by Increasing Usability Through Simplification
Chris CampanelliSheridan College
Follow this and additional works at: https://source.sheridancollege.ca/ student_work_fast_applied_computing_theses
Part of the Health Information Technology Commons, Other Computer Sciences Commons, and the Other Medicine and Health Sciences Commons
SOURCE Citation SOURCE Citation
Campanelli, Chris, "Bench Tracker: Improving Actionable Insights in Smartwatch Fitness Application by Increasing Usability Through Simplification" (2019). Faculty of Applied Science and Technology - Exceptional Student Work, Applied Computing Theses. 2.
Bench Tracker: Improving Actionable Insights in Smartwatch Fitness Application by Increasing Usability Through Simplification
A Thesis presented to
The Faculty of Applied Science and Technology, School of Applied Computing of
Sheridan College, Institute of Technology and Advanced Learning
by
Campanelli, Chris
In partial fulfillment of requirements for the degree of
Bachelor of Applied Computer Science Mobile Computing Feb 2019
ABSTRACT
Optimizing Actionable Insights in Smartwatch Fitness Application by Increasing Usability Through Simplification
Chris Campanelli Advisor: Dr. Ed Sykes
Sheridan College, 2019
This thesis describes a smartwatch solution, called Bench Tracker for fitness monitoring using Apple Watches and Apple iPhone devices. The system involves a mobile based application that allows users to track and monitor bench press workouts in real-time to create actionable insights. By creating actionable insights on a smartwatch application, and improving the
application’s usability through simplification, users agreed they would use the fitness application created that specifically tracked bench presses. A leading fitness app was used as the comparator, and it was discovered that users were undecided if they would use this app for bench press tracking. This paper presents the relevant background of work in this area, the system
architecture that was designed and developed to support this application, the app, the analysis of how data collected from the Apple Watch provides ‘actionable insights’, and a report on the findings of real use test case scenarios.
Overall it was discovered that Bench Tracker was successful in providing a high level of actionable insight to users by having a high level usability. This was demonstrated by creating a niche fitness application (Bench Tracker) that had the core workflow and purpose to monitor users bench press. This was validated by the System Usability Scale (SUS) test which was 75.2 for Bench Tracker and in contrast a leading fitness application tested in the study 57.5 (68 is
ACKNOWLEDGEMENTS
I would like to thank my thesis advisor Dr. Ed Sykes of the Faculty of Applied Computing department at Sheridan College. He made himself readily available whenever I needed guidance or had questions regarding my thesis, and he was there to support me. In addition, it was working as a researcher for Dr. Ed Sykes in the Center for Mobile Innovation (CMI) research department at Sheridan College and taking courses taught by Dr. Ed Sykes who inspired me to want to further explore and conduct my thesis in the chosen area.
I must also express my appreciation towards my family, who have provided me with countless years of support and encouragement throughout my years of education. Without them none of this would be possible. Thank You!
TABLE OF CONTENTS
Abstract ... i
Acknowledgements ... ii
Table of Contents ... iii
Table of Figures ... v
List of Tables ... vi
Chapter One Introduction ... 1
Research Goal ... 6
Thesis Statement ... 6
Contributions ... 7
Outline ... 7
Chapter Two Literature review ... 8
Chapter Three Methodology ... 15
Research Design ... 15
Participants ... 17
Technical Application Stack ... 27
Participants Devices ... 27
Study Overview ... 27
Evaluation Method ... 28
Chapter Four Findings (Analysis and Evaluation) ... 29
Anecdotal / Qualitative Findings ... 35
Discussion ... 35
Chapter Five Conclusion ... 36
Limitations and Future Research ... 37
References ... 38
TABLE OF FIGURES
Figure 1 Smartwatch Units Shipped (Consumer Technology Association, 2018). ... Error! Bookmark not defined.
Figure 2 Percentage of Smartwatch and Activity tracker owners still wearing their device
(Ledger, 2014)... 5
Figure 3. Categories of importance by consumers before purchasing a wearable device (Fortmann, Heuten, & Boll, 2015) ... 10
Figure 4 Bench Press Exercise ... 16
Figure 5 Bench Tracker App Setup Screen ... 24
Figure 6. Bench Tracker Landscape View ... 26
LIST OF TABLES
Table 1 Gymatic SUS Results ... 29 Table 2 Bench Tracker SUS Results ... 30 Table 3. SUS Response Legend ... 30 Table 4 Summary of Each of the App tested with respect to SUS positive and negative responses ... 33
Table 5 T-test results showing p values when comparing participant responses to SUS questions. ... 34
CHAPTER ONE
INTRODUCTION
The increasing growth of smartwatches in recent years has been exponential as demonstrated by Error! Reference source not found.. Smartwatch Units Shipped (Consumer Technology Association, 2018). Many application developers and companies are trying to take advantage of this growing and emerging market by creating applications specifically for the smartwatch or by creating smartwatch applications to complement existing mobile applications (Chai-Chen & Kuo-Lun, 2018). Leading analyst predict, as these numbers continue to climb and smartwatches grow in popularity, the importance of quality and engaging applications will increase (Junk, Kim, & Choi, 2016). For example, in 2017 there were 75 million new devices shipped. Which was an exponential increase from the year before as shown in Error! Reference source not found..
It is with this substantial growth that companies will be looking to capitalize on these emerging markets. Based on early adoption of wearable applications, companies have found it hard to keep users engaged and using their wearable applications over a long period of time for various reasons (Ledger, 2014). Users, on the other hand, are finding these wearable applications not as useful as their mobile counter parts and often are opting to use the mobile application over the wearable (Lyons, 2016). In order to create high quality applications, developers will have to work around current constraints of smartwatches.
Current smartwatch purchasing trends suggest that people buy smartwatches due to a perceived value associated with a device (Kuo-Lun Hsiao, 2018). This perceived value is
the device (Kuo-Lun Hsiao, 2018). This software benefit can be attributed to the smartwatch software’s ability to do additional tasks that extend the limitations of smartphones. This is currently apparent in the area of healthcare, where smartwatches are able to collect a greater amount of health-related data points then a smartphone can currently do alone (Everett, 2015). Although, in healthcare applications, levels of retention are low because the smartwatch
applications are unable to provide actionable insights (Everett, 2015). In recent studies involving the Apple Watch applications in the Apple App Store, 62% were found to be connected to third party trackers, which buy user data (Jagmohan Chauhan, 2016). This demonstrates the intent that application developers are not looking to create actionable insights for their users but rather to increase their bottom line, by selling user information through data tracking.
Actionable insight, as defined by Techopedia, is a term that is generally associated with data analytics and big data. It describes the process in which data analysts/scientists act in reaction to the data that they process. This thesis will define actionable insight in terms of a user and mobile application. Actionable insights can be feedback or data presented to the user from an application that keeps the user engaged or wanting to continue using the application. Current research suggests that there are many reasons why companies are having difficulty developing applications that provide users with actionable insight (Everett, 2015). Due to its smaller size users have found it hard to use smartwatches to view media (Rawassizadeh, Price, & Petre, 2015). Both pictures and videos are difficult to view because of the small display size (Rawassizadeh, Price, & Petre, 2015). Although the Apple Watch 1 has the same number of pixels per inch (PPI) as an iPhone 6/6s, the screen size limits the uses ability to enjoy media at
when viewing media (Rawassizadeh, Price, & Petre, 2015). This issue also translates into using normal applications, users found that because of the reduced screen size that they had reduced functionality or accessibility to functionality in wearable applications compared to in the mobile version (Rawassizadeh, Price, & Petre, 2015). Furthermore, users who have mobile application with smartwatch integration largely opt to use the mobile version of the application as they find there are many of redundancies in the smartwatch version (Fortmann, Heuten, & Boll, 2015). Studies have shown that it is after 6 months that one third of smartwatch owners will abandon their device (Ledger, 2014).
This research will provide insight into how users perceive and value current smartwatch applications. It is by evaluating how users determine evaluate usability of niche fitness
smartwatch applications, we will be able to provide understanding into what makes an engaging smartwatch application that users will use more frequently. The current problem is that
smartwatch applications are unable to retain users for a long period of time as demonstrated in Figure 2.
Smartwatches in general have an initial novelty and perceived value that make them high in demand for first time users (Ledger, 2014). After that initial novelty users stop using
smartwatches for the additional benefits that their applications provide and use it merely for the basic time functionalities (Ledger, 2014). Fitness applications that provide a high level of actionable insight and simple UI’s, which retain fitness-oriented users long-term, as they can better maintain a frequent user base because these apps have a high value proposition to the user (Ledger, 2014).
Figure 1 Percentage of Smartwatch and Activity tracker owners still wearing their device (Ledger, 2014)
Research Goal
The aim of this thesis is to improve the efficiency of gym users when monitoring a bench press exercise. Created in this research, Bench Tracker, is a smartwatch and smartphone
application that offers an effective smartwatch user interface and assesses and monitors users performing this specific exercise. Bench Tracker collects the g-force generated from the 3-dimensional movements of the Apple Watch across its x, y, z-axis’ by using the Apple Watch’s accelerometer. These values are used to determine the velocity of the vertical movement of the user’s wrists as s/he performs the exercise. This is how the algorithm determines the speed a user executes a bench press. The aim of the application is to create actionable insights for users, by enabling the user to better understand his/her lifts, and by giving them access to the resources to analyze their bench press exercises, and ultimately improve the effectiveness of their weight training. Current applications in the market support a wide arrange of fitness activities, but also require a high amount of interaction from a mobile phone. Bench Tracker aims to reduce unnecessary user interactions while enabling access to personally relevant information when required in order to allow the user to focus on his/her exercise regime as much as possible to improve user usability and effectiveness.
Thesis Statement
A smart watch application can be developed to optimize user’s usability by focusing the application workflows though simplification. This optimization will be demonstrated for the niche activity of users tracking a bench press using an Apple Watch. This paper proposes an application with similar user metrics tracking to a leading fitness application but will only forces
on the exercises of bench pressing. By doing so this research aims to determine if smaller niche applications and systems can have increased usability that makes them more desirable for users.
Contributions
This work showed how to create a smart watch application that tracks a users bench press with an optimal workflow to increase usability. The contributions of this work include:
• Identified the importance evaluating HCI for usability in large fitness applications
• Developed a procedure workflow that had a high level of usability for the purpose of tracking bench pressing.
• Developed a smart watch application that can track and measure users g-forces during a bench press set.
Outline
Chapter 2 of this paper presents the Literature review and analysis on background
information. Chapter 3 covers the methodology including architecture diagrams and application design. Chapter 4 highlights the findings and analysis involving participants who participated in the experiment and their results. Chapter 5 presents the conclusion of this research.
CHAPTER TWO
LITERATURE REVIEW
Smartwatches generally do not have a lot of processing power (Yu, Ma, Liu, Huang, & Chen, 2017). They often delegate application processing to mobile devices when tasks become too complex for their watch to handle (Lyons, 2016). Although this is the current state of smartwatches, when looking back at history it is clear that processing power of smartwatches will increase over time. Lyons states that “For a long time, email and web browsing were tasks that were seen as too difficult to accomplish on mobile devices; you needed a desktop PC (or laptop) to accomplish those tasks” (Lyons, 2016). In present day emailing and web browsing is a daily activity that most mobile users can easily accomplish with their mobile device. This
demonstrates the ability and speed that technology rapidly changes. Manufacturers are always upgrading the hardware, software, design and user interface of their products in order to satisfy user’s needs (Chai-Chen & Kuo-Lun, 2018). Taking this into account it will be interesting to see how wearable technology evolves in the coming years. Considering smartwatches already have the ability to increase efficiency in daily tasks like texting and emailing, it will be interesting to see with more power what other tasks they can effectively optimize (Chai-Chen & Kuo-Lun, 2018). Even with their current processing power limitations, by correctly offloading application processing to a mobile device, applications can speed up by up to 3 times (Yu, Ma, Liu, Huang, & Chen, 2017). Furthermore, offloading an application’s processing to a mobile device can save up to 50% energy consumption in comparison to when processing is done on the smartwatch (Yu, Ma, Liu, Huang, & Chen, 2017). Essentially by taking the “smart” out of a smartwatch you can leverage a companion mobile device to do complex calculations.
Ultimately, manufacturers are trying to provide an advance hardware infrastructure to improve operating efficiency and attract more customers. (Chai-Chen & Kuo-Lun, 2018). Researchers have found that there are still many areas of improvement for smartwatch
manufactures. One third of users abandon their wearable device after six months (Ledger, 2014). Abandonment rate for activity trackers is slightly higher than that of normal smartwatch
wearables (Ledger, 2014). Added value of smartwatches to uses can stem from the user being less dependent on one’s smartphone, this is especial apparent in social situations (Cecchinato, Bird, & Cox, 2015).
It is important to have properly designed software for smaller smartwatch screens, as it simplifies device operation and provides a more effective user interface (Chai-Chen & Kuo-Lun, 2018). A properly designed interface will increase the user’s rate of interaction with the device (Chai-Chen & Kuo-Lun, 2018). Furthermore, smartwatch content (apps) were found to be the main factor to increase value and usability in the view of the user (Chai-Chen & Kuo-Lun, 2018). Design and hardware also play a factor, although were not as important as functionality applications. Figure 2 presents the most important categories consumers evaluate before
purchasing a wearable device. Along the x-axis are the categories a given consumer evaluated in order from most important to least important. On the y-axis is the points a given consumer aggregated to the importance of it. This figure demonstrates that interaction and display design, functionality and form factor are among the largest consumer concerns (Fortmann, Heuten, & Boll, 2015). Figure 2, in regards to this thesis highlights how important usability is to users. As interaction and display design had the single most points aggregated to it by a consumer in the
smartwatches have a large magnitude of sensors that provided value-added features (Hsiao, 2013). Brand, price, display size, standalone communication and shape are five important attributes that consumers evaluate when purchasing a smartwatch (Junk, Kim, & Choi, 2016)
Figure 2. Categories of importance by consumers before purchasing a wearable device (Fortmann, Heuten, & Boll, 2015)
Smartwatches have a smaller screen, smaller user interface and different mobile application designs in contrast to their mobile counter parts. Therefore, the software perspective, UI
convenience and embedded features play a very important role in the device (Chai-Chen & Kuo-Lun, 2018).
Smartwatches are beneficial to the users and more effective for some applications because the smartwatch gives the user a glanceable view of a notification where a phone would require the user to undergo more physical activity to use the device (e.g., take the phone from his/her pocket or purse) (Lyons, 2016). In a study, due to the ability for students to have glanceable and socially hidden smartwatches proved beneficial to students who were trying to cheat on exams (Cecchinato, Bird, & Cox, 2015). This is because smartwatches applications, if designed correctly, can be socially unobtrusive with low user input. Participants in the study reported they only used their smartwatch as a watch, health tracker or a media device
(Cecchinato, Bird, & Cox, 2015). All of the apps they listed require limited human interaction. The wrist is found to not be optimal for longer and more complex interactions between human and device (Lyons, 2016). Given the opportunity, people prefer to rest their arm on an object when using a smartwatch for support and stability (Strohmeier, Burstyn, & Vertegaal, 2015). This supports the claim that applications that require a lot of human input are not well received when compared to apps that monitor or supply notifications.
Currently many employers are giving their employees wearables as part of a cooperate health initiative (Ledger, 2014). This is important because it highlights that not all smartwatch purchasing is driven by consumer interest. The motivation behind companies giving employees free wearables is to lower their health insurance premiums (Everett, 2015). It was also found that by giving users free health related wearables they can help reduce turnover (Everett, 2015).
(Everett, 2015). Moreover, companies that gave free wearables found that employees would create groups and set competitive group goals using the fitness tracking wearables to track one another. It brought out the competitive side of employees but ultimately helped keep them motivated to reach their goals (Everett, 2015). This is important because this demonstrates a stratum of users that are consistently engaged with their smartwatch.
Wearable technology use, such as Fitbit is becoming increasingly popular to the general public (El-Amrawy & Nounou, 2015). As a good wearable application creates actionable insight to engage the user (Everett, 2015). Actionable insights lead to behavior change and that is what entices the user to use the application or product, which a fitness wearable like the Fitbit promotes (Everett, 2015).
A user perceived value is a key determinant of product purchase intention (Hsiao, 2013). Chai-Chen and Kuo-Lun identified that “Perceived value derives from the consumer’s evaluation of the utilities of a product or service when the expense of purchasing and usage are taken into consideration” (Chai-Chen & Kuo-Lun, 2018), pg. 2). Perceived value can be evaluated by: emotional value, social value, performance/quality value and price/value for money (Chai-Chen & Kuo-Lun, 2018). Furthermore, uniqueness of a product can influence a user’s positive attitude towards it as this can help satisfy the need of self-expression and enhance social values (Chai-Chen & Kuo-Lun, 2018).
To increase the value proposition of smartwatches for users it is important for
applications to build a strong connection between users and their health (Ledger, 2014). This can be accomplished though better bio-sensing and processing capabilities (Ledger, 2014). Watches already provide value to the user (telling time) and it is any further capabilities that will extend the additional value a user would get from a watch alone (Lyons, 2016). Bio-sensing and health capabilities of smartwatches increase the value proposition of mobile applications by providing additional avenues that application developers can exploit to create actionable insight for users. For example, by utilizing the heart monitor on the Apple Watch, fitness applications can give feedback to a user to help them better obtain a target heart rate. In addition, different
smartwatches have different additional features that cater to different users. The pebble is a smartwatch that runs applications like the Apple Watch but lacks biometric features that the Apple watch has. However, it has a much better battery life – up to 1-week battery life (Lyons, 2016). The Apple watch was found to have the most accurate heart monitor of any smartwatch device with 99.9 percent accuracy with a standard deviation of 5.7 in optimal conditions (El-Amrawy & Nounou, 2015). In comparison, the Samsung Gear Watch 2 heart monitor was found to have a 97.4 percent accuracy with a standard deviation of 28.8. (El-Amrawy & Nounou, 2015).
As discussed, the value proposition of wearable’s are important to users/consumers. Also users can feel empowered and react more positively if they are using a wearable that they feel helps them track and promote a healthy active life style. Since the Apple Watch as proven through the study above has a high level of sensor accuracy and is in a form fitting and promote
scientifically proven to be accurate and is modern, the goal is to prevent any negative initial bias towards the wearable and applications used in the study by participants that do not want use or trust the accuracy of the wearable device.
CHAPTER THREE
METHODOLOGY
Research Design
Participants in this study were given an Apple iPhone and Apple Watch for the duration of the study. They were asked to evaluate two fitness applications by completing their own bench press exercise with the purpose of tracking that specific exercise with each application. Participants were directed to take 5 minutes with each application to familiarize themselves, before
preforming his/her bench press exercise. Most participants performed 1 exercise and evaluated the exercise results with each app. Participants were encouraged to explore on their own
including the workflow in setting up each application to track a bench press exercise. There was no outside guidance from the researcher conducting the study, unless help was requested. This was to eliminate any bias that might be bestowed from the researcher to the participant. After each participant session with the applications, s/he were asked to fill out System Usability Scale (SUS) questionnaires to capture their experiences with the apps. The aim is to determine which application had the highest usability and would be used more frequently for tracking bench press exercises.
Participants in the study conducted a comparison of Gymatic and our custom-made application, Bench Tracker. Bench Tracker monitors and tracks user’s bench press velocity using the accelerometer built into the Apple Watch. Gymatic can also track the user’s bench press velocity, although it is a general workout rep counter therefore, its workflow is not
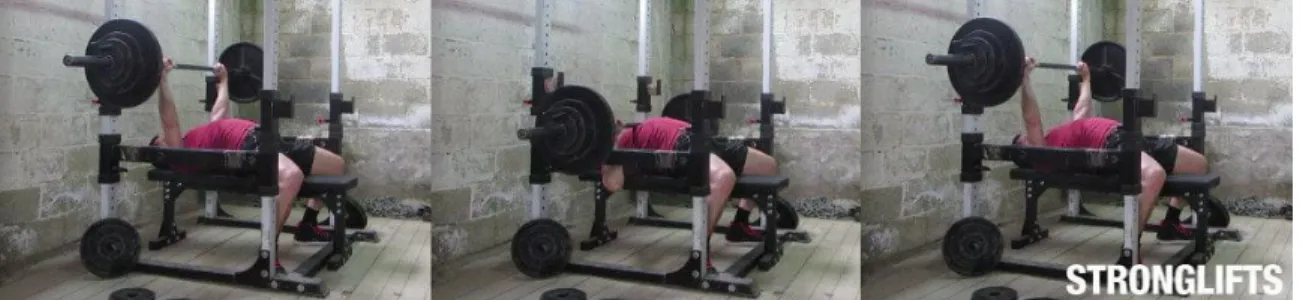
were asked to evaluate each applications’ usability. The participants were asked to evaluate each application when preforming the specific movement of bench pressing. The bench press is a movement that requires the participant to lower a weighted barbell to their chest while laying on a bench and then press it up into the air to complete a rep.
Figure 3 Bench Press Exercise
By targeting a very specific exercise for the study, Bench Tracker’s workflow was tailored for users given the context in which they would be using it. The targeted user context being a gym environment with the intention of tracking bench press workouts. Based on
research, to maximize actionable insight for users, the application should have a simplified work Bench Tracker was designed for minimal user interaction. This is mainly accomplished by reducing the amount of interactions a user has with both the Apple Watch app and the iPhone mobile application. By designing Bench Tracker with usability as a principle design
characteristic, the UI was less distracting to users then Gymatic. In this way, users could stay mentally focused on completing their exercises with the goal of enabling users to be more inclined to frequently use the application. The motivation for this design approach was that an application that requires a long setup process may frustrate the user. Frustration in a fitness context may interfere with a user’s mental focus when completing an exercise. Therefore, the
app may be less likely to be used. That is why this study focuses on evaluating the app’s usability and striving to improve its usability.
Participants
In this study, 11 participants (2 females and 9 males) were recruited and selected using
convenience sampling. They were selected based on availability and geographical constraints. The inclusion criteria was users had to be physically able to complete a bench press and would be willing to attempt one during the study if they felt comfortable doing so.
Application Selection
There are many fitness-tracking applications on the Apple App Store. One of the most prominent fitness applications on the App Store is Gymatic by Vimo Labs Inc, which is advertised as an all in one rep counter. It currently has a 4.4/5-star rating on the Apple App Store with over 1.3k reviews. Gymatic can count reps of a large magnitude of exercises, including upper body exercises, such as bench press and dumbbell curls to leg exercises, such as squats and lunges. The application uses a companion application on an Apple Watch to monitor, track and sync user’s data. The Apple Watch app works in combination with a mobile application counterpart, which is used to configure and visualize workout results. To get basic workout tracking. which includes rep counting the application is free to use. For more advanced analytics on exercises there is a premium subscription of $8(CAD)/month that users are charged. These additional analytics include charting of data related to rep velocity, set heart rate and rep speed. These
Gymatic’s has a large user base, based on the number of reviews. The application also had a high rating which suggested that it was good at executing advertised features. In addition, the
application’s bench press tracking features were thoroughly tested to confirm that the features worked as advertised.
In addition, it was determined that the features for tracking users bench press movements and providing insights could be duplicated in a custom application. This was highly important in order to demonstrate that an application usability could be increased with minimal bias. The existing functionality of the application would have to be duplicated. The features that was determined to be the most important in Gymatic that would be included in the our Bench Tracker app were; Tracking users bench press rep movement using an Apple Watch, providing graphical insights on bench press reputations and average movement speed over the each workout set in meters per second. For these reasons, Gymatic was selected as a comparator to our Bench Tracker app.
Gymatic Background
Gymatic’s reporting includes charts and points of data, although the user needs to search for the data in sub menus. This can be time consuming and awkward, especially if the user is in the middle of a workout. In addition, data points even in the paid version of the application are summarized so the user cannot get a visualization of how the summary was formed. This is concerning because in order to gain actionable insights to improve exercises, user should be able
have visual representation of where exactly they need to improve. A graphical chart is an easy way to accomplish this.
Currently, the Gymatic application takes several steps in the mobile device to setup for bench press tracking. The steps are as follows:
1. The user must add a new workout to my workout menu by pressing the “+” button
3. The user must search for the desired exercise for the purpose of the study. It was Bench Press.
5. When the user starts a workout, they are prompted to sync the workout with the Apple Watch.
6. The user must toggle the workout so that it can be transferred to the Apple Watch. They do this by pressing the watch icon beside the workout.
7. The user must then navigate to the guided workout screen in the Apple Watch application. Where they must press the sync workouts button.
8. They will then be able to start tracking their workout
9. To view work outs after completing them, the users must navigate through the mobile application menus.
10.The user can then specify the analytics they want to view.
Design of the Custom Application (Bench Tracker)
Our custom application, Bench Tracker, aimed to reduce the total number of interactions a user had to complete to track the exercise. It is because the application was created to target bench press exercise tracking, setting up the exercise could be configured on the Apple Watch
application with minimal user interaction. This was one of the main design features to increase usability of the application. In addition, to setup and track a bench press work out, users only required 2 interactions. Both interactions are completed on the same main screen of the Apple Watch application and it does not require any additional gesture or in-app navigation. To start the application, users use the crown of the watch to select what weight they are lifting followed by pressing the Start button to commence tracking the bench press exercise as demonstrated in Figure 4.
Figure 4 Bench Tracker App Setup Screen
Once the user is finished his/her bench press set, the user can press the “Finish Tracking” button, which appears on the screen.
To view the completed exercise analytics, the user must open the mobile application on the iPhone. From the supplied drop down screen, users select the date and time of all previous exercises completed. They can then select the exercise to be viewed, which loads a screen with a quick summary of the similar metrics, including average g-forces generated and an average bench press speed in m/s. There are metrics Gymatic tracks but they are displayed on 2 separate screens in Gymatic and therefore require much user interaction to find. Furthermore, a graphical chart based on this data is generated; it is shown in Figure 5. As a result, the user can take a fast glance and quickly see, evaluate and adjust their work out. The y-axis as shown in Figure 5 is of the number of g-forces being exerted during a users bench press and the x-axis is the time the force was exhorted at.
Figure 5. Bench Tracker Landscape View
Bench Tracker Algorithms
In order track a user’s bench press, Bench Tracker had to access the Apple Watches accelerometer. This provided Bench Tracker the ability to gather and record the g-force values from the Apple Watch accelerometer. To accomplish this Apple requires developers to use Swift’s core motion library. This library allows developers to access the accelerometer of an Apple Watch. As per apple documentation the library calculates acceleration movement from the accelerometer and returns the g-force value of the acceleration of the x,y,z axis as a double data type. To calculate bench speed of movement in meters per second the number of g’s exerted was
multiplied my 9.8. As per NASA “gravitational acceleration g is 9.8 meters per square second at sea level”
Technical Application Stack
The Bench Tracker was developed in Swift 4.2 using targets iOS 12+ and watchOS 4+. The mobile/watch applications were supported by ASP.NET backend webserver written in C#. All exercise data was stored in a SQL database. Both the SQL database and ASP.Net application were hosted in Azure cloud.
Participants Devices
Participants received an iPhone 6s running iOS 12.1 and an Apple Watch 3 running watchOS 5.1.3.
Study Overview
The study conducted used a custom fitness application called Bench Tracker with the purpose of tracking metrics of user’s vertical lifts using an Apple Watch’s accelerometer. Bench Tracker created a specific data set that targeted a specific niche group of users by targeting metrics for bench press activity. The metric that the application tracked was bar speed. Allowing users to create actionable insight based on the data collected. The amount of generated insight may differ
Tracker more frequently then Gymatic because it was optimized for usability in the context of bench pressing.
Evaluation Method
Participants in the study evaluated application’s usability using the System Usability Scale (SUS). The Digital Communications Division in the U.S Department of Health and Human Services summarized the benefits of the SUS based on over 1300 publications (Affairs, 2013). The main 3 benefits included; being easy to scale and administer for participants, can be used on a small sample size with reliable results, and that it is a valid and can accurately be used to determine useable and unusable systems (Affairs, 2013). Based on these findings and the extensive research that was done to validate the validity of the test. The SUS was chosen to be the evaluation method for participants to use for the study.
CHAPTER FOUR
FINDINGS (ANALYSIS AND EVALUATION)
This chapter presents the results from the Gymatic SUS surveys (Appendix A), which are presented in Table 1 Gymatic SUS Results and had an average SUS score of 52.5 and a score range from 42.5 to 75. The results from Bench Tracker SUS which are located in Table 2 Bench Tracker SUS Results had an average SUS score of 75.2, and a score range from 57.5 to 95. The response legend found in Table 3. SUS Response Legend.
Question User 1 User 2 User 3 User 4 User 5 User 6 User 7 User 8 User 9 User 10 User 11 Question Average Answer
I think that I would like to use this app
frequently. 1 2 3 1 3 2 3 2 3 4 2 2.36
I found this app unnecessarily
complex. 4 5 5 3 3 2 3 3 3 4 2 3.36
I thought this app was
easy to use. 3 2 1 2 4 3 3 2 3 4 2 2.64
I think that I would need assistance to be
able to use this app. 4 2 2 1 3 4 1 4 3 2 2 2.55
I found the various functions in this app
were well integrated. 4 2 5 4 4 4 3 4 3 4 3 3.64
I thought there was too much inconsistency in this
app. 3 1 1 1 4 1 3 3 1 2 3 2.09
I would imagine that most people would learn to use this app
very quickly. 2 5 2 4 4 1 2 3 3 5 3 3.09
I found this app very cumbersome/awkward
to use 2 2 4 3 4 2 3 3 3 3 3 2.91
I felt very confident
using this app. 3 3 2 3 3 2 3 3 3 5 3 3
I needed to learn a lot of things before I could get going with
Table 2 Bench Tracker SUS Results
Table 3. SUS Response Legend Question User 1 User 2 User 3 User 4 User 5 User 6 User 7 User 8 User 9 User 10 User 11 Question Average Answer
I think that I would like to use this app
frequently. 4 3 5 1 4 2 5 3 3 5 4 3.55
I found this app unnecessarily
complex. 1 1 2 1 3 1 3 2 2 2 2 1.82
I thought this app was
easy to use. 5 5 4 4 4 5 4 4 4 5 5 4.45
I think that I would need assistance to be
able to use this app. 3 1 1 1 1 3 3 1 3 1 1 1.73
I found the various functions in this app
were well integrated. 4 5 5 5 3 4 4 3 4 5 4 4.18
I thought there was too much inconsistency in this
app. 2 1 1 3 4 2 3 3 3 1 2 2.27
I would imagine that most people would learn to use this app
very quickly. 5 5 5 5 4 4 4 5 3 5 5 4.55
I found this app very cumbersome/awkward
to use 1 1 2 2 4 3 3 3 3 4 2 2.55
I felt very confident
using this app. 3 5 4 3 3 3 4 1 3 2 4 3.18
I needed to learn a lot of things before I could get going with
this app. 1 1 1 1 3 2 2 1 2 1 1 1.45
Actual Response Table Response Strongly Disagree 1
Disagree 2
Impartial 3
Agree 4
The results from the surveys were converted into a point scale to better analyze the qualitative data in a quantitative form. This is commonly done to improve statistical analysis as Likert scales are ordinal, which allows for the data to easily be interoperated and transformed to quantitative data (Bertram). The actual participant responses can be determined using Table 4 Summary of Each of the App tested with respect to SUS positive and negative responses. Converting the data to this form allowed for a better understanding of how much better or worse users found aspects of the application. For example, question 1 stated, “I think that I would like to use this app frequently.” For this the gymnastic app the average participant answer for this question was a 2.36 (between “Disagree” and “Undecided”) and for the Bench tracker application the average was 3.55 (between “Undecided” and “Agree”). Therefore, participants felt that they agreed that they would frequently use Bench Tracker application. In contrast, participants generally
disagreed that they would use Gymatic frequently. Furthermore, the SUS has 5 questions, questions; 1, 3, 5, 7, and 9 that have a positive connotation towards the app being tested and 5 questions; 2, 4, 6, 8, 10 that have a negative connotation. Participants responded 1.03 points higher on positive questions when evaluating the Bench Tracker application. Therefore,
participants favored the Bench Tracker, as its optimized usability and participants felt that they would use it more frequently. To further support this, participant scored questions with a negative connotation towards Bench Tracker 0.782 points lower than Gymatic. This demonstrated that participants were more likely to disagree with questions that implied negativity towards Bench Tracker then Gymatic. Therefore, they had stronger feelings of negativity towards the usability towards Gymatic.
To visually understand the SUS results Figure 6 demonstrates that Bench Tracker out preformed Gymatic on all of the negative SUS question except question 6. This could most likely be
attributed to the applications styling. Odd questions in the SUS had a positive connotation so the more strongly participants agreed with it, the better the application preformed. Figure 6 that demonstrate that Bench Tracker out preformed Gymatic on all these questions. This indicated that participants liked Bench Tracker better because it had overall better usability and it also indicated that they would prefer to use the application more frequently.
Figure 6 Bench Tracker vs Gymatic Average SUS Visual Comparison
To further support and analyze the SUS data a summary of the data found in Table 1 Gymatic SUS Results and Table 2 Bench Tracker SUS Results can be found in Figure 6 Bench Tracker vs Gymatic Average SUS Visual Comparison. Comparison highlights that participants responded with
3.55 1.82 4.45 1.73 4.18 2.27 4.55 2.55 3.18 1.45 2.36 3.36 2.64 2.55 3.64 2.09 3.09 2.91 3 2.82 1 2 3 4 5 6 7 8 9 10 Av er age Ans we r Question Number
Average SUS Question Results
Bench Tracker Results Gymatic Results
“Agree” on positive questions relating to the SUS survey for the Bench Tracker application and “Undecided” for the Gymatic application. Additionally, for the negative questions participants on average responded with “Disagree” for the Bench Tracker application and “Undecided” for the Gymatic application. This further supports the claim that by simplifying applications users will be more likely to use the application more frequently Table 3. SUS Response Legend further supports the mathematical logic behind this reasoning.
Table 4 Summary of Each of the App tested with respect to SUS positive and negative responses Question Gymatic Average Bench Tracker Average
Bench Tracker Minus Gymatic Score
I think that I would like to use this app
frequently. 2.36 3.55 1.19
I found this app unnecessarily complex. 3.36 1.82 -1.54
I thought this app was easy to use. 2.64 4.45 1.81
I think that I would need assistance to be able
to use this app. 2.55 1.73 -0.82
I found the various functions in this app were
well integrated. 3.64 4.18 0.54
I thought there was too much inconsistency in
this app. 2.09 2.27 0.18
I would imagine that most people would learn
to use this app very quickly. 3.09 4.55 1.46
I found this app very cumbersome/awkward to
use 2.91 2.55 -0.36
I felt very confident using this app. 3 3.18 0.18
I needed to learn a lot of things before I could
get going with this app. 2.82 1.45 -1.37
Positive Questions Average 1.036 Negative Questions Average -0.782
Application Pos Neg
Furthermore, by comparing questions results from each application using a two tailed unpaired t-test further demonstrates if the difference in the scoring were significant.
Table 5 T-test results showing p values when comparing participant responses to SUS questions. Question p value 1 0.0228 2 0.0007 3 0.0001 4 0.0881 5 0.1168 6 0.6957 7 0.0013 8 0.3463 9 0.6547 10 0.0206
Table 5Error! Reference source not found. shows the p value results from the t test. Important take always from this are that Questions 1,2,3,7, and 10 are significantly different. This is especially important because questions 1 states “I think I would use the use this app frequently”, question 2 states “I think this application was unnecessarily complex” and question 3 states “I thought this application was easy to use”. These 3 questions were statistically different is important because they directly coincide with the applications usability.
Anecdotal / Qualitative Findings
There were 2 common issues that were verbally brought to the attention of the researcher that were not recorded in the SUS. The first was application reliability. Some users reported Gymatic counting false positive and false negative reps. This was noted to directly reflect participants’ overall ease of use and confidence in the application. In addition, 2 participants said that they did not complete a bench press to track their data in Gymatic. They decided to forgo this portion of the study because they felt it was too cumbersome do to confusion and poor application usability. It was explained this was due to design poor design. This also demonstrated that participants struggled to use the application, which positively corelates with Gymatic’s lower score on the SUS question that asked participants if they thought the application was easy to use. It was also noted that the Bench Tracker application styling could be improved as it “did not feel modern.”
Discussion
The research conducted provides understanding into how users evaluate usability of applications that provide a high level of actionable insight. The research demonstrated that larger fitness applications struggle to have a high level of usability in comparison to niche applications that target specific fitness exercises. Specifically, with smartwatch applications it is important that applications that require less user interaction are preferred. This is apparent with fitness
applications because time spent setting up a fitness application before a workout ultimately, takes away from user’s time and concentration on that activity.
CHAPTER FIVE
CONCLUSION
The increasing growth of smartwatches has been substantial in recent years and it will continue to grow. This has caused many application developers and companies to attempt trying to take advantage of this growing and emerging market. Based on early adoption of wearable applications, companies have found it hard to keep users engaged and using their wearable applications over a long period of time for various reasons (Ledger, 2014). Users on the other hard are finding these wearable applications not as useful as their mobile counter parts and often are opting to use the mobile application over the wearable (Lyons, 2016). In order to create high quality applications developers will have to work around current constraints of smartwatches. A good way to accomplish this is by creating actionable insight. Actionable insight’s can be feedback or data presented to the user from an application in a way that keeps the user engaged and/or wanting to frequently use the application. The created smartwatch application, Bench Tracker provided actionable insights to users by allowing them to track their bench press exercises in a way that optimized usability. The study conducted included 11 participants that participated over a span of 2 weeks. The study found that users preferred small niche specific smartwatch applications because their workflow can be optimized for users of general-purpose applications. This was supported by SUS surveys that participants scored Bench Tracker at a 75.2 and Gymatic at a 52.5. Participants in the study also reported that they would more inclined to use Bench Tracker more frequently than Gymatic.
Limitations and Future Research Limitations
Due to time constraints and logistics, the total number of study participants was 11. In addition, it was hard to find willing participants because the selection process was through convenience sampling. A lot of potential participants didn’t want to interrupt their work out to participate in a study for no compensation. Furthermore, there would be benefit in investigating users long term usage trends based on the Bench Tracker. Participants in the study reported that they would frequently use the application, but this was after using it for a short period of time. A long-term comparison study between Bench Tracker and Gymatic would be useful provide more insight into how usability effects long term application usage. In addition, it would be beneficial to increase to get a larger number of participants in the study to reduce likely hood of
Future Research
Further directions of this research would be to evaluate long term usability trends of users. The study conducted evaluated users over a short period of time and their impressions based on the application. There would be additional research benefit in running a longer study over in the range of 2-4 weeks to see how usability effected participants usage. In addition, adding additional features to the application could provide additional benefit to users. For example, exploring the effects of additional health features like heart rate monitoring, while still keeping a simplistic and easy to use design could provide beneficial insights.
REFERENCES
Affairs, Assistant Secretary for Public. “System Usability Scale (SUS).” Usability.gov,
Department of Health and Human Services, 6 Sept. 2013, www.usability.gov/how-to-and-tools/methods/system-usability-scale.html.
Bertman, D (2018). Likert Scales… are the meaning of life
Cecchinato, M. E., Bird, J., & Cox, A. L. (2015). Smartwatches: the Good, the Bad and the Ugly. 33rd Annual ACM Conference Extended Abstracts on Human Factors in Computing Systems, (pp. 2133-2138). Seoul.
Chai-Chen, C., & Kuo-Lun, H. (2018). What drives smartwatch purchase intention? Perspectives from. Telematics and Informatics, 35, 103-113.
Consumer Technology Association. (2018). Global smart watch unit shipments from 2014 to 2019 (in millions)*. Retrieved from Satista:
https://www.statista.com/statistics/525848/global-smartwatch-shipments/
El-Amrawy, F., & Nounou, M. I. (2015). Are Currently Available Wearable Devices for. Healthc Inform Res, 21(4), 315-320.
Everett, C. (2015). Can wearable technology boost corporate wellbeing? Occupational Health, 67(8), 12.
Fortmann, J., Heuten, W., & Boll, S. (2015). User Requirements for Digital Jewellery. British HCI Conference (pp. 119-125). Lincoln, Lincolnshire, United Kingdom: British HCI.
Hsiao, K.-L. (2013). Android smartphone adoption and intention to pay for mobile internet: Perspectives from software, hardware, design, and value. Library Hi Tech, 31(2), 216-235.
Jagmohan Chauhan, S. S. (2016). Characterization of Early Smartwatch Apps. IEEE. Junk, Y., Kim, S., & Choi, B. (2016). Consumer valuation of the wearables: The case of
smartwatches. Computers in Human Behavior, 63(1), 899-905.
Kuo-Lun Hsiao, C.-C. C. (2018). What drives smartwatch purchase intention? Perspectives from hardware, software, design, and value. Science Direct.
Ledger, D. (2014). Inside Wearables - Part 2. Endeavour Partners.
Lyons, K. (2016). Smartwatch Innovation: Exploring a Watch-First Model. MPI Informatics. Rawassizadeh, R., Price, B. A., & Petre, M. (2015, Jan). Wearables: has the age of smartwatches
finally arrived? Communications Of The ACM, 45-47. doi:10.1145/2629633
Strohmeier, P., Burstyn, J., & Vertegaal, R. (2015). Effecs of Display Sized on a Scrolling Task using a Cylinderical Smartwatch. MobileHCI.
Yu, M., Ma, Y., Liu, X., Huang, G., & Chen, X. (2017).
Padulo, Johnny & Mignogna, P & Mignardi, S & Tonni, F & Dottavio, Stefano. (2012). Effect of Different Pushing Speeds on Bench Press. International journal of sports medicine. 33. 376-80. 10.1055/s-0031-1299702.
APPENDIX
Appendix A
Appendix C
CONSENT TO PARTICIPATE IN RESEARCH
Title of Study: THEEFFECTOFACTIONABLEINSIGHTINSMARTWATCH APPLICATIONSANDCREATINGLONGTERMUSERS
You are asked to participate in a research study conducted by Chris Campanelli from the School of Applied Computing and Engineering Sciences, Sheridan College.
This survey is only available to those 18 years of age and older, and must own an Apple iPhone. If you have any questions or concerns about the research, please feel free to contact Chris Campanelli at (905) 483 1447 or via email at [email protected]
Purpose of the Study
This study intends to determine how and what types of smartwatch applications and smartwatch application design’s help retain users long term. We do not want to alter users day to day Procedures
If you volunteer to participate in this study, you will be given an Apple Watch that must be synced with an iPhone you currently use daily. You are not required to wear the Apple Watch 24/7. You are only asked to wear and use the Apple Watch and applications on it as you want and only if you want over the duration of a 1-month period. You will also be asked to complete some simple surveys.
Potential Risks and Discomforts
There are no expected risks by participating in this survey.
Potential Benefits to Participants and/or to Society
The benefits to you and society by participating in this research are to provide a baseline for understanding interruptions as users perform computer based tasks. Ultimately, the goal of this research is to shed more light on the problem: “What makes for a good smartwatch application”
Confidentiality
Every effort will be made to ensure confidentiality of any identifying information that is obtained in connection with this study. No identifying information, such as a name or email address, is kept. The results will be kept until the conclusion of the research. Data will be only accessible to authorized researchers and will reside in a secure location and kept confidential. Data may be disclosed as required by Canadian law. In addition, health data will be automatically be collected by Apple. This health data is collected, stored and used by Apple to give you addition health insights automatically through the Apple health app. This additional data collection, only you will have access to and it will be securely stored on Apples servers. No one from the research team will be able to see or touch this data.
Commercialization
The research findings which will be discovered in this study do not have any intended
commercial application. At this time, the research is strictly investigative, and has no immediate or implied commercial use.
Participation and Withdrawal
You can choose whether to be in this study or not. If you volunteer to be in this study, you may withdraw at any time without consequences of any kind. To withdraw from the study at any time, simply discard the questionnaire.
Rights of Research Participants
You may withdraw your consent at any time and discontinue participation without penalty. You are not waiving any legal claims, rights or remedies because of your participation in this research study. This study has been reviewed and received ethics clearance through the Sheridan Research Ethics Board. If you have questions regarding your rights as a research participant, contact:
Principal Investigator (Chris Campanelli: 905-483-1447 or [email protected]) ___________________________________ _____________________
Researcher Signature Date
Your signature below indicates that you understand the above conditions of participation in this study and that you have had the opportunity to have your questions answered by the researcher. ___________________________________ _____________________
____________________________________ ____________________ Authorized Representative Signature** Date
*Where written consent is culturally unacceptable, or where there are good reasons for not recording consent in writing, the procedures used to seek free and informed consent shall be documented.
**Free and informed consent must be obtained from an authorized representative for someone who is not legally competent to consent to be a research participant.