Scholarship at UWindsor
Scholarship at UWindsor
Earth & Environmental Sciences Publications
Earth & Environmental Sciences
7-2017
Public perceptions of a rip current hazard education program:
Public perceptions of a rip current hazard education program:
“Break the Grip of the Rip!”
“Break the Grip of the Rip!”
Chris Houser
University of Windsor
Sarah Trimble
Texas A&M UniversityRobert Brander
UNSW Sydney, SydneyB. Chris Brewster
United States Lifesaving Association
Greg Dusek
NOAA/National Ocean Service, Center for Operational Oceanographic Products and Services
See next page for additional authors
Follow this and additional works at: https://scholar.uwindsor.ca/environmentalsciencepub
Part of the Earth Sciences Commons, and the Environmental Sciences Commons
Recommended Citation
Recommended Citation
Houser, Chris; Trimble, Sarah; Brander, Robert; Brewster, B. Chris; Dusek, Greg; Jones, Deborah; and Kuhn, John. (2017). Public perceptions of a rip current hazard education program: “Break the Grip of the Rip!”. Natural Hazards and Earth System Sciences, 17 (7), 1003-1024.
https://scholar.uwindsor.ca/environmentalsciencepub/9
This Article is brought to you for free and open access by the Earth & Environmental Sciences at Scholarship at UWindsor. It has been accepted for inclusion in Earth & Environmental Sciences Publications by an authorized administrator of Scholarship at UWindsor. For more information, please contact [email protected].
https://doi.org/10.5194/nhess-17-1003-2017 © Author(s) 2017. This work is distributed under the Creative Commons Attribution 3.0 License.
Public perceptions of a rip current hazard education program:
“Break the Grip of the Rip!”
Chris Houser1, Sarah Trimble2, Robert Brander3, B. Chris Brewster4, Greg Dusek5, Deborah Jones6, and John Kuhn5
1Department of Earth and Environmental Sciences, University of Windsor, 401 Sunset Avenue,
Windsor, N9B 3P4, Ontario, Canada
2Department of Geography, Texas A&M University, 810 O&M Building, College Station, 77843-3148, Texas, USA 3School of Biological, Earth and Environmental Sciences, UNSW Sydney, Sydney, NSW 2052, Australia
4United States Lifesaving Association, Huntington Beach, CA 92648, USA
5NOAA/National Ocean Service, Center for Operational Oceanographic Products and Services,
1305 East West Highway, SSMC4 #6636, Silver Spring, MD 20910, USA
6National Weather Service, Marine, Tropical, and Tsunami Services Branch, Silver Spring, MD 20910, USA
Correspondence to:Chris Houser ([email protected]) Received: 9 January 2017 – Discussion started: 30 January 2017
Revised: 12 May 2017 – Accepted: 31 May 2017 – Published: 4 July 2017
Abstract. Rip currents pose a major global beach hazard; estimates of annual rip-current-related deaths in the United States alone range from 35 to 100 per year. Despite increased social research into beach-goer experience, little is known about levels of rip current knowledge within the general pop-ulation. This study describes the results of an online sur-vey to determine the extent of rip current knowledge across the United States, with the aim of improving and enhanc-ing existenhanc-ing beach safety education material. Results suggest that the US-based “Break the Grip of the Rip!”®campaign has been successful in educating the public about rip current safety directly or indirectly, with the majority of respondents able to provide an accurate description of how to escape a rip current. However, the success of the campaign is lim-ited by discrepancies between personal observations at the beach and rip forecasts that are broadcasted for a large area and time. It was the infrequent beach user that identified the largest discrepancies between the forecast and their observa-tions. Since infrequent beach users also do not seek out life-guards or take the same precautions as frequent beach users, it is argued that they are also at greatest risk of being caught in a dangerous situation. Results of this study suggest a need for the national campaign to provide greater focus on locally specific and verified rip forecasts and signage in coordina-tion with lifeguards, but not at the expense of the successful national awareness program.
1 Introduction
Rip currents (often called “rips” or “rip tides”) are strong, narrow seaward flows driven by alongshore variations in wave setup landward of the breaker zone. Due to their de-pendence on wave breaking, rips can develop in any beach environment in oceanic, sea, and lacustrine environments. Castelle et al. (2016b) classify rips as (1) boundary rips that develop along both natural and engineered structures includ-ing headlands, groins and piers; (2) bathymetric rips that de-velop in response to the variability of the nearshore morphol-ogy; and (3) hydrodynamic rips that are spatial and tempo-rally variable and develop in the absence of morphological variations or a lateral boundary. The type of rip that devel-ops on a beach depends on the local wave climate and geol-ogy. For example, rips in the Great Lakes tend to be associ-ated with natural headlands or the presence of large groins or harbor jetties, while rips in Florida and Texas tend to be bathymetrically controlled and associated with a transverse bar and rip nearshore morphology (Houser et al., 2013). Rips also vary regionally based on the driving forces, with rips on the Great Lakes typically associated with moderate to strong winds, while on the West Coast of the United States the rips are often associated with large swell events independent of the wind.
which exceeds fatalities caused by most other natural haz-ards (Brander et al., 2013). While it has been estimated that 30–40 individuals drown each year in rip-current-related in-cidents in the United States (Gensini and Ashley, 2010), Lushine (1991) suggested that rips may account for up to 150 fatal drownings per year and the United States Lifesaving As-sociation (USLA) estimates this number to be over 100 per year. USLA’s National Lifesaving Statistics Report (2012) indicates that over 82 % of surf beach rescues in the US are rip current related and they therefore surmise that 82 % of all fatal drownings at beaches are associated with rip currents.
Beach users’ vulnerability to drowning in a rip current depends on a combination of nearshore hydrodynamic and bathymetric conditions, personal and group behaviors, and the beach safety and rip current knowledge of the individ-ual (e.g., Houser et al., 2011a, b, 2016; Brander et al., 2011; Caldwell et al., 2013). Morgan et al. (2009) identified that lacking rip current knowledge was associated with rip cur-rent drownings, as was gender, age, alcohol consumption, and overconfidence in swimming ability. Recent evidence suggests that while most beach users are aware of rip cur-rents and the hazard they pose, they are not able to identify a rip current (Sherker et al., 2010; Caldwell et al., 2013; Brannstrom et al., 2014). More than 80 % of beach users surveyed in Florida and Texas failed to identify rip currents in photographs, usually by incorrectly identifying areas of breaking waves as the most hazardous swimming conditions (Brannstrom et al., 2014). This is consistent with results of Sherker et al. (2010), who argued that most beach users are unable to identify a rip current and that “beachgoers clearly need to know what a rip looks like to actively avoid swim-ming in it” (p. 1787). Given sufficient information, it is pos-sible for beach users to identify a rip current with confidence (Hatfield et al., 2012). However, the ability to identify a rip current or to recognize posted warnings about the rip current danger is not a guarantee that a beach user will be safe, par-ticularly because many will still choose to swim in unsafe and unpatrolled sections of the beach, away from the pres-ence of lifeguards, for social or behavioral reasons or because of a lack of awareness and/or complacency (Drozdzewski et al., 2012, 2015; Williamson et al., 2012; Houser et al., 2016). Recent evidence suggests that beach access manage-ment can inadvertently steer unsuspecting beach users to-wards rip-prone areas, increasing the chances of a
drown-2005). The Rip Current Task Force was convened in 2003 by the National Oceanic Atmospheric Administration (NOAA) and USLA to establish consistent rip current education ef-forts and improve sharing of rip current rescue data across the United States. Subsequently, with the assistance of the National Weather Service (NWS) and Sea Grant, a national “Break the Grip of the Rip!”®education campaign was ini-tiated in 2004. The Break the Grip of the Rip!® campaign aimed to educate the public about the rip current hazard by providing information about what rip currents are, why they are dangerous, how to identify them, what to do if caught in one, and how to help someone else if they are caught in a rip current. Aspects of this information have been disseminated through various means such as the NWS Rip Current Safety web page (http://www.ripcurrents.noaa.gov/), brochures, beach signs, videos, newspaper articles, and pub-lic service announcements on television.
While this campaign was the first of its kind globally, it was also particularly challenging given that the United States has four very different coastlines (West Coast, East Coast, Gulf Coast, Great Lakes) that differ in terms of wave climate and beach systems, and a large inland non-coastal population who may only visit any of these coastlines infrequently. Re-sults from Brannstrom et al. (2015) suggest that while most beach users in Texas were not familiar with the campaign itself, many were familiar with a key message of the cam-paign on “what to do” when caught in a rip current. This suggests that the campaign may have been successful in ed-ucating beach users and reducing the number of drownings, but this hypothesis has never been formally tested.
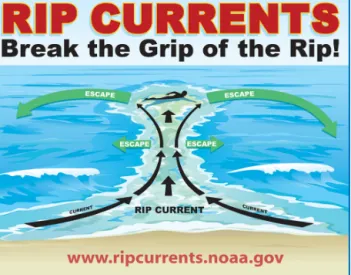
The core visual image used in many of these interven-tions was a simple diagrammatic illustration of an idealized rip current from an oblique aerial perspective (Fig. 1). In this image, the rip current is characterized by relatively calm white water surrounded by more intensive wave breaking ad-jacent to the rip and close to the shoreline. An image template was created that could be accessed online and in hard copy and duplicated freely to be posted along boardwalks, beach fronts, and public beach access points throughout the United States. The image has also been more recently adopted in other countries such as Thailand, Costa Rica, Mexico, South Korea, and Japan. While the NOAA–USLA sign was not in-tended to teach the general population to identify a rip, the prominent image of a rip current on the sign and attempts to
Figure 1.Rip current warning sign developed by the United States Rip Current Task Force as part of the “Break the Grip of the Rip!”® education campaign.
post the sign on beaches indicate that its function and visual argument constitute an invitation to beach users to use the in-formation to identify rip currents (Brannstrom et al., 2015).
Due to this conflict between its’ theoretical and practi-cal use, the NOAA–USLA rip current sign has proven to be mostly successful in regard to educating beachgoers on “what to do” (e.g., swim parallel to the beach) when caught in a rip current, but it has not been particularly successful in im-proving beach users’ ability to identify rip currents from the perspective of standing or sitting on the beach (Brannstrom et al., 2015). Consistent with results of Matthews et al. (2014), only a small percentage of beach users (<50 %) recalled ob-serving rip current warning signs on beaches in Florida and Texas (Caldwell et al., 2012; Brannstrom et al., 2014) despite their widespread occurrence at beach access points. How-ever, it is important to note that despite observing and un-derstanding a warning sign, it is well established that some people will not take the appropriate actions to prepare for or avoid the hazard (Siegrist and Gutscher, 2006; Karanci et al., 2005; Hall and Slothower, 2009; Jóhannesdóttir and Gís-ladóttir, 2010).
In a separate initiative, the NWS has endeavored to de-velop a public rip current forecasting system, although the methodology varies among weather forecast offices (WFOs). Some WFOs issue surf zone forecasts that include a three-tiered (low, moderate, high) rip current outlook communi-cated to the public during television and radio news broad-casts (Carey and Rogers, 2005) and social media platforms. Some WFOs work with local lifeguards to update their out-looks based on real-time observations. However, as discussed in NOAA (2015), these forecasts are not necessarily com-municated or disseminated in a consistent manner through-out all regions and, therefore, are not communicated
seam-lessly. The lack of consistency in forecasting is complicated by rip development being dependent on how the incident wave field interacts with the pre-existing nearshore morphol-ogy, which is difficult to predict without local knowledge on how it evolves over a range of spatial and temporal scales.
Since perception of the rip hazard depends in part on trust in experts and authorities, and trust in the protective measures they employ (Njome et al., 2010; Heitz et al., 2009; Terpstra, 2011; Terpstra et al., 2009; Barnes, 2002), inaccuracies in the forecast or a discrepancy between the forecast and what is observed at a specific beach at a specific time can erode con-fidence in the forecast (Siegrist and Cvetkovich, 2000; Es-pluga et al., 2009). Lack of confidence in forecasts could po-tentially condition beach users to downplay the hazard warn-ing on future visits (Hall and Slothower, 2009; Scolobig et al., 2012; Green et al., 1991; Mileti and O’Brien, 1993). Fur-thermore, the generic nature of the rip current forecasts can result in situations where the actual intensity of rips varies substantially from the forecast. Beachgoers could easily ob-serve a discrepancy between their beach location and the rip forecast, caused by either the generalized nature of the fore-cast or their inability to identify a rip current (Caldwell et al., 2012; Brannstrom et al., 2014, 2015).
The national US rip current education program is clearly an impressive effort yet many rip-current-related fatalities and rescues still occur on US beaches and overseas (Gensini and Ashley, 2010) and there is little quantitative evidence available to assess the overall effectiveness of the program. This is largely because no “pre-program” study was con-ducted on public understanding, perception, or behavior in relation to the rip current hazard. There is also a lack of hard data on rip-current-related fatalities, beach visitation num-bers, and how incident frequency and exposure rate may have changed over time. In this regard, NOAA sponsored a work-shop in 2015 to review the Break the Grip of the Rip!® pro-gram and NWS rip current forecasts to discuss whether exist-ing messagexist-ing is scientifically sound, as well as effective and clear in reaching all age groups and demographics (NOAA, 2015).
It was acknowledged at the NOAA workshop that while there have been several recent studies to describe the ex-tent of rip current knowledge amongst beach users (or lack thereof) on specific beaches in the United States (Caldwell et al., 2013; Brannstrom et al., 2014, 2015), there is insuffi-cient understanding about beach user knowledge of rip cur-rents and their behavior at the beach at a national level. This study describes results of a national online survey focused on US-based beachgoers and their understanding of, and expe-rience with, the Break the Grip of the Rip!®program and the rip current hazard to provide quantitative evidence to guide future improvements to beach safety education material and forecasting efforts.
Figure 2.Photographs used in questions 42 through 44 of the survey to ask respondents, “Where on this photograph would you swim?” The location of the rip current in each photograph is shown by the red arrow, which was not visible to the respondents.
Table 1.Question groups used to elicit responses from respondents notified about the survey by various agencies in the United States.
Group Focus of questions Example topics 1 Informed consent
2 Non-identifying personal information ZIP code, age, ethnicity, and beach use 3 Swimming behavior Self-assessed swimming ability
4 Beach behavior and beach safety information Frequency of visits; perceived risks at the beach 5 Rip identification and knowledge Description of a rip current; ability to identify rip current
in a photograph
6 Memorability, conspicuity, comprehension, priming Source of rip information; memory of observing rip safety warnings warnings
7 Rip current sign knowledge and understanding Understanding rip current warning signs and warnings
2 Methodology
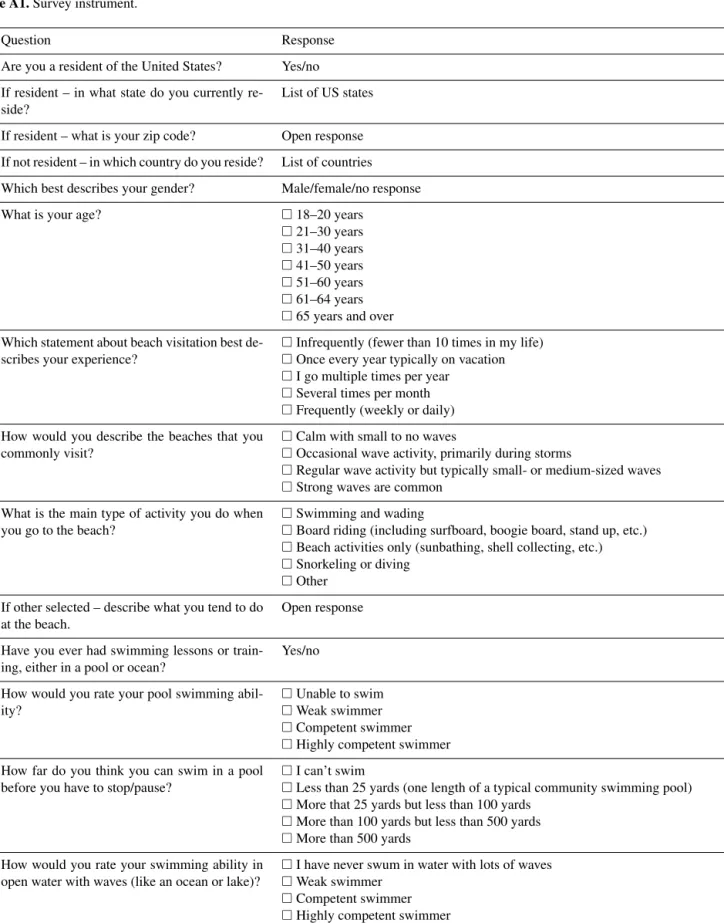
The study research design relied on an Internet-based survey instrument using Qualtrics, approved by the relevant human subject protection program from Texas A&M University. The survey consisted of questions re-phrased from Sherker et al. (2010) and photograph-based rip current identification protocols (Fig. 2) modified from Brannstrom et al. (2014, 2015), with questions grouped into six categories (Table 1). The survey had 75 questions and took approximately 20– 30 min to complete. It remained open from May to August 2015 and all answers were recorded anonymously through Qualtrics Survey Software. A copy of the survey instrument is provided in the Appendix of this paper.
The survey was distributed by email to cooperating or-ganizations and individuals for distribution though listservs, websites, social media, and in advertisements. It was dissem-inated via secure Internet and social media links for Texas A&M University, Sea Grant, Science of the Surf, NWS, and the NOAA. While this Internet-based recruitment process at-tempted to target a much wider demographic of the US popu-lation, it is also reasonable to assume that as the host websites were all beach and surf-related, survey respondents likely had greater interest in, and understanding of, coastal environ-ments and hazards, leading to a potential bias that was also experienced in a beach-safety-related study by Drozdzewski et al. (2012).
3 Results
Between May and August 2015, a total of 2084 respon-dents started the online survey, but only 1622 completed all questions (completion rate: 78 %). Geographically, the largest number of respondents were from the state of Texas (n=368) where Texas Sea Grant and the local NWS of-fice conducted significant advertisement for the survey. Large numbers of respondents also came from North Carolina (n=214), California (n=184), and Florida (n=130), with most remaining states having<50 respondents. Of the 50 US states, only Nebraska did not have a respondent. Overall this
cohort managed to capture respondents who use each of the coastlines in the continental US. Respondents were evenly distributed by age (>18 years); each 10-year range between 21 and 60 garnered about between 320 and 420 respondents. A slight majority of the respondents were female (55 %).
3.1 Familiarity with the Break the Grip of the Rip!® campaign
Only 18 % (n=304) of respondents reported hearing about the Break the Grip of the Rip!®campaign with nearly iden-tical split by gender and age. Approximately 40 % of respon-dents reported hearing about the campaign either through a brochure/pamphlet (n=120) or at the entrance to a beach (n=119), whereas 163 respondents (54 %) reported hearing about the campaign through various sources on the Internet. Ninety respondents reported having heard about the cam-paign from the Break the Grip of the Rip!®website. When asked what “break the grip of the rip” means, most respon-dents (familiar with the campaign) reported (to varying de-grees of accuracy) that it was designed to provide informa-tion about what to do if caught in a rip current:
– “Do not try to fight the current, instead work with the current until you can break free of its pull.”
– “Advises affected swimmers not to struggle while head-ing shoreward but to swim parallel to the beach till out of the off-beach current.”
There were, however, several respondents (familiar with the campaign) who believed that the messaging was not ap-propriate and needed to be rethought:
– “The slogan is useless to anyone caught in a rip current! What can you do by knowing this slogan? . . . ‘Wave, Yell & Swim Parallel’ is a far better slogan . . . it pro-vides three lifesaving pieces of information. The exist-ing slogan provides nothexist-ing.”
– “It’s an advertising slogan; it doesn’t mean much at all. It’s a bad slogan; it does not tell folks what to do, what to watch for, or anything useful.”
Figure 3.Percent of self-reported beach visitation by respondents.
Figure 4.Relative importance of beach and surf factors to respondents when selecting a beach. Note that respondents were asked to identify all factors that applied.
Responses from those who were not familiar with the cam-paign were much shorter and did not contain the level about survival strategies provided by those familiar with the cam-paign. Representative responses include “how to escape”, “tips to survive”, and “how to get out of a rip”.
3.2 Beach preference
As presented in Fig. 3, most respondents visited the beach either once per year on vacation (22 %) or multiple times per year (42 %). Visitation exhibits a statistically significant re-lationship with age, with older respondents (>40) visiting the beach more often than younger respondents (χ2=46.5,
ρ <0.01). Perceived wave size on beaches visited by re-spondents depends on age and frequency of beach visitation with older respondents who visit the beach frequently tend-ing to report beaches they visited havtend-ing strong waves, while younger respondents, who tended to visit the beach infre-quently, identified the beach as having small waves (χ2=84,
ρ <0.01). In general, respondents who visit the beach infre-quently tend to describe the beach as having small waves and that their primary beach activity is swimming and/or wad-ing. All respondents who visit the beach frequently (weekly or daily) identified board riding as their main activity and
tended to frequent beaches with strong wave activity (χ2=
111,ρ <0.01), suggesting a greater understanding of wave conditions. There was no statistically significant variation in wave description based on home state, suggesting that per-ception of wave activity is largely based on frequency of beach visitation and other personal characteristics. In terms of choice of beach visited, wave activity and the potential hazard posed by rip currents or the absence of lifeguards are less important than cleanliness and at the same level of im-portance as crowds (Fig. 4).
When determining which beach to visit, frequent beach users, who were mostly board riders, tended to prefer beaches with lots of waves, whereas infrequent users em-phasized safety and cleanliness (χ2=159, ρ <0.01). Fre-quent beach users also believed it was very important to swim near a lifeguard, while infrequent users did not (χ2=51,
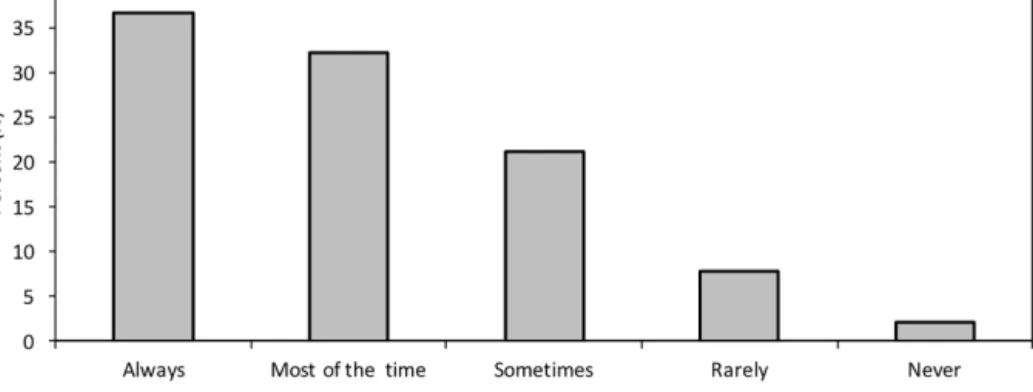
ρ <0.01). Across both groups, however, respondents sug-gested they would still enter the water even if a lifeguard was not present, suggesting that recognition about the impor-tance of lifeguards is not consistent with behavior in select-ing where and when to swim (Fig. 5). Frequent beach visitors were also more confident in their ability to “always” spot a rip current in contrast to infrequent beach visitors (χ2=247,
Figure 5.Self-reported tendency to enter the water in the absence of a lifeguard on a beach.
Figure 6.Percent of respondents’ belief that rip currents can be seen by beach users.
ρ <0.01). Those who visit the beach less often (e.g., sev-eral times per year or month) believed they could spot a rip “sometimes” or believed it is not possible to see a rip current, consistent with the response from all respondents (Fig. 6).
3.3 Swimming ability
Most respondents (∼52 %) self-identified as competent swimmers (Fig. 7) and reported in a separate question that they were capable of swimming between 25 and 100 yards (22.8 and 91.4 m) or more than 100 yards (91.4 m) with-out having to stop or pause in open water (χ2=1391,
ρ <0.01). Respondents who self-reported as highly com-petent open water swimmers (n=213, 12 %) primarily be-lieved they could swim more than 500 yards in open wa-ter without resting, while those who self-reported as weak swimmers (n=566, 31 %) believed that they were only ca-pable of swimming 25 yards or less. Those who identified as highly competent or weak swimmers tended to have the narrowest range of self-reported ranges of swimming abil-ity, while those who self-identified as competent swimmers had the widest range of self-reported swimming distances for both pools and open water.
3.4 Ability to identify a rip current
When asked “Where on this photograph would you swim?”, approximately 54 % of respondents correctly identified the location furthest away from the rip current in Photograph 1 (Figs. 2a and 8a). However, 182 (11 %) respondents in-correctly selected the rip current as the safest location to enter the water, with the remaining respondents identifying other areas of the photograph (adjacent to the rip) as be-ing the safest location. Results of a ztest suggest that re-spondents who selected the rip as the safest location are sig-nificantly younger than those who correctly identified the safest location in the photograph (z=12.1,ρ <0.01). Those who correctly identified the safest location in the photograph also visited beaches more frequently (z=6.1,ρ <0.01) and self-reported beaches they visited as having strong waves (z=6.4, ρ <0.01). Most respondents who identified the rip as the safest location self-reported never having swim-ming lessons (z=2.8, ρ <0.01) and described themselves as weak swimmers in both pools (z=3.7, ρ <0.01) and open water (z=6.2,ρ <0.01). Those same respondents also self-reported that it was important to swim near a lifeguard (z=5.8, ρ <0.01) but tended to not consider hazards be-fore going to the beach, unlike respondents who were able to correctly identify the safest spot to enter the water (z=14.1,
Figure 7.Percent of self-reported swimming ability in a pool and in open water with waves.
When asked what beach features they believed to be most dangerous, respondents who correctly identified the safest swimming location away from the rip were more likely to report alongshore currents and rip currents as dangerous fea-tures, while those who selected the rip as the safest location tended to identify jellyfish, sharks, and big waves. Respon-dents who incorrectly selected the rip current as the safest location were also least familiar with the common US beach safety flag system (z=11.5,ρ <0.01) and tended to have not heard of rip currents (z=17.3,ρ <0.01). Respondents who selected the rip as the safest location did not understand what was meant by a “high risk” (z=3.2, ρ <0.01) or a “low risk” (z=7.5,ρ <0.01) of rip current development as broadcast by some NWS services. The same respondents also noted that rip forecasts are apt to be inconsistent with the conditions they encountered on the beach, in contrast to re-spondents who correctly identified the safest location in the photograph and noted that forecasts tended to be consistent with their experience (z=3.3,ρ <0.01).
Approximately 25 % of respondents (n=630) incorrectly identified the left side of the groin (with an active rip) as the safest spot to enter the water in Photograph 2 (Figs. 2b and 8b). Like the responses to Photograph 1, those respon-dents tended to be younger (z=5.2, ρ <0.01), go to the beach infrequently (z=7.8,ρ <0.01), and self-report waves being relatively small (z=7.3, ρ <0.01) and their swim-ming ability in open water to be relatively poor (z=2.2,
ρ <0.01). These respondents are also unlikely to consider hazards before going to the beach (z=10.9,ρ <0.01), are unfamiliar with the common beach flag system in the United States (z=12.5, ρ <0.01), do not understand the defini-tion of a “high-risk” of rip current development (z=4.2,
ρ <0.01), and believe that rip forecasts are not consistent with their personal beach experiences (z=2.8, ρ <0.01). Unlike responses for Photograph 1, those respondents who incorrectly identified the rip as the safest location were not significantly different (at the 95 % confidence level) from those who correctly identified the safest location (right side of the groin) with respect to pool swimming, swimming near a lifeguard, type of water activity at the beach, knowledge of
Figure 8.Identified location of safest location to enter the water in the photographs presented in questions 42 through 44 and also presented in Fig. 2. Warm (red) colors indicate large number of re-sponses, while cold (blue) colors indicate few responses. No color (background picture) represents areas that received no responses.
the Break the Grip of the Rip!®campaign, or their perceived ability to use the sign to identify a rip current.
A similar pattern was observed in respondents’ ability to identify the safest location to enter the water in Photograph 3 (Figs. 2c and 8c), with 26 % of respondents incorrectly iden-tifying the rip current as the safest location. Like responses for the other photographs, respondents who identified the rip as the safest location to enter the water did not visit beaches as often (z=4.5, ρ <0.01), self-reported having relatively limited swimming ability in pools (z=3.1, ρ <0.01) and open water (z=2.8, ρ <0.01), and did not believe it was important to swim near a lifeguard (z=3.0,ρ <0.01), un-like those who correctly identified the safest location to enter the water in the photograph. Respondents who selected the rip current as safe for swimming were not as familiar with the flag system used in the United States (z=5.6,ρ <0.01), rip currents (z=3.9,ρ <0.01), or the Break the Grip of the Rip!®campaign (z=4.4,ρ <0.01). These respondents also did not understand what was meant by a “low risk” (z=2.5,
ρ <0.01) and a “high risk” (z=3.4,ρ <0.01) of rips. How-ever, unlike photographs 1 and 2, no statistically significant difference was observed between those who correctly or in-correctly identified the safest spot to enter the water with re-spect to age, self-reported wave activity, swimming lessons, behavior in the absence of lifeguards, importance of check-ing for hazards, or the ability to use the sign to identify a rip current.
3.5 Response to the rip current warning sign
Only 31 % of all respondents believed the NOAA rip cur-rent warning sign could be used to identify a rip curcur-rent. In-terestingly, those respondents who incorrectly identified the rip current as the safest spot on the beach to enter the wa-ter tended to believe that the NOAA rip current warning sign couldnothelp a beach user identify a rip current. This con-trasted with those who correctly identified the safest location in any of the photographs (z=5.2,ρ <0.01). When asked to describe how the sign could be used to identify a rip cur-rent, some of the latter respondents were able to relate the rip in the picture to a real rip:
– “It shows that in a rip current, there appears to be a break in the water, with water moving in a different direction.”
– “It shows you the ‘calm’ area between the two areas of normal wave activity indicating the channel where the rip is located.”
Most of these responses focused on the pattern of wave breaking and the orientation of the “calmer” water to the beach. There is evidence that some respondents believed the picture to be an accurate representation of a rip, but they could not provide specific detail about the real-world features on the beach it depicted, for example “graphic depiction of what the tide looks like”. This suggests that some respon-dents believe the sign is accurate since it was designed and placed there by an authority.
As previously noted, the rip current warning sign was not designed to help beach users identify a rip current but rather to inform them how to escape a rip. Most respondents could clearly state what the sign was informing them about swim-ming parallel to the beach to escape a rip:
– “Let the current take you out and then swim parallel the shore to escape.”
– “Swim parallel to the shore, or wait until the rip gets less strong further offshore.”
Of the respondents, 96 % could provide a response to this question and virtually all responses indicated that the sign informed them to swim parallel to shore to escape the rip current, suggesting that the sign has been effective in com-municating this message. When asked how seeing this sign would change their behavior of the beach, a majority (65 %) of respondents suggested they would take precaution when entering the water:
– “Might avoid going in water if I see surface signs of rip activity and drive to another beach.”
– “Consider not going in. Look carefully for signs of rips. Look for flags and lifeguards.”
This suggests that while most respondents understood that the sign provided them with information on how to escape a rip current, it also helped with prevention as most respon-dents also noted that they would take precaution or use it to spot (and presumably avoid) a rip rather than focus on escape strategies.
Most respondents (86 %) provided ideas on how to im-prove the rip current warning sign, with more than half sug-gesting the sign needed to provide a more accurate depiction and/or description of a rip current:
– “I don’t think it clearly identifies it enough that the waves will not break where a rip current is. It is great because it shows how to get out of one but I think with another picture of an actual rip current people would identify them easier.”
– “Pictures showing what actual rip currents look like would be useful./Most casual beachgoers are not con-fident that they could identify a rip current from shore or predict where one might be forming.”
– “There needs to be more info on how to detect, recog-nize and avoid a rip current. Information on conditions during which rip currents are most likely to form would also be useful.”
A small number of respondents (<10 %) suggested that the sign should either include step-by-step instructions on what to do and/or provide more information about the ex-perience of being caught in a rip current:
that it only needed minor edits, including space for local emergency numbers and contacts. A small number of respon-dents (<5 %) believed that the sign should include ments that elicit fear amongst beach users including state-ments such as “Rip currents can drown you”.
3.6 Prevention
One in four (25 %) respondents reported they had been pre-viously caught in a rip current by accident, while 10 % of respondents reported that they had purposely entered a rip for surfing. When asked how to escape a rip, those who had accidently been caught in a rip current provided relatively detailed responses that either described escape by swimming parallel or riding the current without panic:
– “Let it flow. Don’t fight it. Perhaps as long as you min-imize tiring exertions try to flow towards the side of the current. Basically do the same thing you’d do if you fell in a strong river about to empty into a lake. You certainly wouldn’t kill yourself trying to swim out upstream.”
– “Don’t panic!!! Either swim – without too much exer-tion – parallel to the beach for 25+yards, OR tread wa-ter and allow yourself to be carried out until the rip loses power, then swim parallel to the beach. Once out of the rip, swim back towards shore (again in a relaxed manner, taking time to prevent exhaustion). When near-ing the beach, take care not to get drawn back into the rip by water flow parallel to the shoreline.”
Of those who had not been previously been in a rip 7 % (n=36) did not provide a description of how to escape. The remaining respondents provided relatively short responses that described escape through combinations of swimming parallel and relaxation
Assuming no response is an indication of a lack of knowl-edge about rips, the number of respondents who did not pro-vide an accurate description of how to escape a rip current is∼9 %, suggesting that overall the campaign has been suc-cessful in informing beach users to (1) not fight the current; (2) swim out of the current, then to shore; (3) if you can’t escape, float or tread water; and (4) if you need help, call or wave for assistance.
conditions before going to a beach with the majority (83 %) using the Internet to find that information. A large majority (88 %) of respondents stated that information about beach and surf conditions affected their behavior, with many say-ing that they would either “not go” (to the beach), “not go in the water”, or “look for rips”. When asked whether the rip current forecast (either high or low) was consistent with con-ditions they experienced at the beach, approximately 67 % of respondents stated that the forecasts were not necessarily consistent with their observations. For some, this inconsis-tency reflected the temporal and spatial broadness of the rip forecast compared to what they observed:
– “Weather changed quickly and no beach flags were posted, advising of rip currents.”
– “Rip currents cannot be predicted for individual beaches, they are blanket warnings.”
Other respondents noted the forecast was inaccurate be-cause other beach users had not adjusted their behavior:
– “I never noticed an[y] thing unusual and people in gen-eral don’t seem to adjust their behavior.”
Others noted it was not possible to determine whether the forecast was accurate because they were not able to spot a rip on the beach at that specific time or in general:
– “I couldn’t determine if/where rip tide activity might be in the water if the forecasts had warned beach-goers to be aware of a high risk on that day.”
In several cases (n=59), respondents noted they had not heard a forecast warning of the rip hazard on a given day or in general through responses such as “I don’t know if I’ve ever heard a rip current forecast?”
Additional questions about high-risk rip conditions so-licited written responses that suggest many respondents un-derstood the high-risk warning to mean that wind and wave activity are tantamount to the development of rips:
– “Due to tides, weather, etc., there is a much greater risk for rip currents in the ocean.”
There was a mix of responses in which respondents be-lieved that “high risk” meant that rips would form or that
there was a greater chance of rip formation. Others (n=102) believed that the use of the terms high and low risk were mis-leading:
– “Whenever or wherever there are waves there can be rip currents, so I am not sure what “high” or “low” risk of rip currents means. All rips are potentially dangerous.” In response to the definition of low risk, respondents tended to suggest this implied that rips were unlikely or would not form:
– “Rip currents may still exist but are weaker or fewer than normal.”
– “Conditions are not conducive to rip currents.”
– “The factors necessary for rip currents to form are ab-sent – not likely to encounter rip.”
Of note, whether a respondent described high and low risk of rips as a probability (likely, unlikely) or in absolute terms (is or is not present) is not related to whether the respondent noted that the rip forecast was consistent with their observa-tions at the beach. For both high and low risk, some respon-dents believed that the forecast (by radio, Internet, etc.) was not based on the predicted weather but rather on whether a rip had been sited on a beach or not with statements such as “not sighted” or “strong rips observed”. Others (n=129) believed that high and low risk was associated with the local bathymetry being conducive to the formation of rips: “the to-pography/bathymetry is suited to rip currents”.
3.8 Trusted sources of information
Respondents were also asked to rank sources of information about rip currents from (1) most trusted to (5) least trusted. Except for social media (Facebook, Twitter, etc.), all sources of information were nearly equally ranked from most to least trusted with no discernable pattern. Only social media exhib-ited a discernable pattern, with more than 35 % of respon-dents identifying it as the least trusted source, although 18 % of respondents also identified it as the most trusted. More respondents identified Internet sources as the most trusted compared to other sources, while television and radio were identified as trusted (rank 2 and 3), but not the most trusted. No significant correlations were observed between trust in a source of information and respondent demographics, sug-gesting that a broad communication strategy is the most ef-fective to reach the widest audience.
4 Discussion
The primary results of this US-based rip current survey are summarized in Table 2. Results suggest that while many are not aware of the Break the Grip of the Rip!®campaign, the US beach-going public is informed about rip current safety.
While this is an encouraging result, it needs to be placed in context. The goal of this study was to examine US-based beachgoers’ understanding of, and experience with, the na-tional Break the Grip of the Rip!®program and the rip cur-rent hazard to provide quantitative evidence for improving the program. Despite the dissemination of the online survey leading to a potentially biased cohort (Sect. 2) that was dom-inated by respondents who were relatively frequent beachgo-ers, self-rated as competent swimmbeachgo-ers, and could success-fully identify the safest location to enter the water based on photographs, approximately 10 % of survey respondents were infrequent beachgoers, poor swimmers, largely igno-rant of the rip current hazard, and more liable to make poor swim location choices.
When taking the entire US beach-going population into account, this cohort represents a significant population of po-tential “at-risk” beachgoers. Given that this population was a key target of the Break the Grip of the Rip!®campaign, it is therefore of considerable concern that this cohort (i) tended to select the rip current as the safest location to enter the water on each of the survey photographs, (ii) did not con-sider hazards before going to the beach, (iii) were not fa-miliar with the beach flag system in the United States, and (iv) did not seek out lifeguards when visiting a beach. These results clearly highlight how at risk infrequent beach users still are despite the decadal existence and ongoing presence of the campaign.
In contrast, survey respondents who were frequent beach-goers and had previous experience with rip currents had a better understanding of what rip currents were, the danger they represent, and how to escape from a rip. As described by Brannstrom and Houser (2015), those who get caught in a rip current “understand the dangers of rips first hand and . . . realize [they] never want to be caught in that situation or acci-dent [again].” Similar results were found in studies involving surveys of people who had been caught in rip currents in Aus-tralia (Drozdzewski et al., 2012, 2015). Those with indirect or no experience tend to underestimate the danger compared to those with direct experience (Ruin et al., 2007).
It is also interesting to note that while many survey respon-dents were not familiar with the Break the Grip of the Rip!® campaign itself, a clear majority (∼91 %) understood the pri-mary message of the campaign and were able to provide an accurate explanation of the message (i.e., “break the grip”). Respondents previously familiar with the campaign provided detailed explanations of how to escape a rip by swimming parallel and/or floating until the current weakened, indicat-ing they may also have gained this knowledge from other sources.
Survey results also suggest that other factors can influence behavioral response in relation to the rip current hazard. For example, as noted by several survey respondents, if everyone else at the beach is entering the water and not heeding an existing rip current warning (out of ignorance or purposeful neglect), there is a chance that the beach user may become
ards, self-reported understanding of “high” and “low” risk conditions, and perceived accuracy of rip forecasts
Response to warning sign Perceived ability to use sign to identify a rip current varied with ability to identify safest location on a photograph
Sign has been effective in communicating swimming parallel as an escape strategy and taking caution when entering the water
Identified need to provide a more accurate depiction of a rip current, detailed instructions on how to escape a rip current, and local emergency information
Prevention Break the Grip of the Rip!®campaign has been successful in informing beach users to (1) not fight the current;
(2) swim out of the current, then to shore; (3) if you can’t escape, float or tread water; and (4) if you need help, call or wave for assistance.
Forecasts Self-reported change in behavior based on forecasted beach and surf conditions, but tendency for forecasts to be inconsistent with observations
Perceived inaccuracy of forecast related to spatial and temporal broadness of forecast, inability to identify a rip, and behavior of other beach users
Trusted sources of information No significant correlations were observed between trust in a source of information and respon-dent demographics
complacent and also enter the water despite understanding the risk. This suggests that decisions can be made based on what other beach users are doing rather than rip forecasts (Lapinski et al., 2014). The tendency to follow the behavior of others may be enhanced when someone goes together as part of a group and enters the water because everyone is will-fully ignoring the risk or is ignorant to the severity of the risk (see Mollen et al., 2012; Arozarena et al., 2015). A regional forecast or global warning will not necessarily deter beach user behavior as much as direct intervention by lifeguards.
This study has also revealed some important issues with existing rip forecasting methods and resultant warnings (Ta-ble 2). Approximately 67 % of all respondents stated that rip current forecasts are not necessarily consistent with what they observe on the beach. Consistent with previous studies on natural hazards, those who have not experienced a pre-dicted hazard or did not experience personal damage during a visit to the beach are more likely to downplay the danger the next time they visit (Hall and Slothower, 2009; Scolobig et al., 2012; Green et al., 1991; Mileti and O’Brien, 1993). Any inconsistency between a rip forecast and direct obser-vations therefore has the potential for some beach users to
downplay the rip current risk on future beach visits. While forecast methodology varies by WFO, most rip forecasts do not consider bathymetry, local topography, or hard structures that may force rips over a range of wind wave conditions. It is also not clear how many forecasts are based on the actual presence of rips observed by lifeguards.
The key problem is that rip forecasts tend to be generalized for a large region and time, whereas actual rip development and flow behavior is extremely variable over space and time (Castelle et al., 2016a). It is also difficult to predict the po-tential for rip development without an understanding of the pre-existing nearshore morphology, which itself is difficult to measure directly, remotely, or through numerical model-ing. A static daily regional rip warning may therefore fail to replicate different rip conditions that occur during that day. For beachgoers, this can lead to a different interpretation of the forecast accuracy and may potentially lead to downplay-ing the actual risk (see Brilly and Polic, 2005). Mileti and O’Brien (1993, p. 40) describe this reasoning as “The first impact did not affect me negatively, therefore, subsequent impacts will also avoid me.” At the same time, beach users will not be able to conceptualize events that have never
oc-curred or to see future trips to the beach as anything more than a mirror of past visits or experiences (Kates, 1962; Tver-sky and Kahneman, 1973). If the rip forecast and warnings are inaccurate or perceived to be inaccurate by the beach user, there may also be a potential loss of trust in that authority (Espluga et al., 2009) and future forecasts.
It can be assumed that beach users who rely heavily on rip forecasts and assume they are accurate might use them to calibrate their own observations and experiences, which will impact their future forecast expectations. If a low rip risk forecast is issued and the rips are prevalent and strong, then beach users may lose faith in forecast accuracy. Simi-larly, if a high rip risk forecast is issued and no rips are ob-served with relatively calm conditions, then beach users may become complacent about the hazard and discount or ignore future forecasts in the future. However, results of this study suggest that given time and experience at the beach over a range of conditions, beach users can develop a nuanced un-derstanding of the forecast and gain greater confidence that it is appropriate. Rip forecast inaccuracies appear to be most problematic for infrequent beach users who also do not ap-pear to seek out lifeguards and are unable to spot rips cor-rectly.
Most respondents could clearly state what the standard-ized rip current sign was informing them to do in terms of swimming parallel to the beach to escape the rip, but many identified a need to provide information that would allow beach users to identify a rip current in general (e.g., “Pic-tures showing what actual rip currents look like would be useful”) or specific to the local beach (e.g., “Picture of rip at actual beach [the sign] is placed on”). However, evidence from beach surveys in Florida and Texas suggest that beach users are not able to accurately identify a rip current (Cald-well et al., 2012; Brannstrom et al., 2014), although there may be ways in which the sign can be made more accurate through small revisions to the perspective, colors, and beach morphology (Brannstrom et al., 2015). While local informa-tion may improve the accuracy and interpretainforma-tion of the sign, there is the potential for different signs and messaging be-ing used (of varybe-ing quality and detail), leadbe-ing to confu-sion and misinterpretation by beach users. A more appropri-ate strappropri-ategy may be to take a more local approach to risk and emergency management including local emergency con-tact information. This approach places greater authority in local managers and emergency responders, without resulting in different signs.
A local approach also includes putting greater emphasis on the expertise of lifeguards to prevent accidents and respond to emergencies promptly and properly. This would also par-tially consider the fact that there are different types of rip currents and associated behavior in different geographic lo-cations and regions (Castelle et al., 2016b). Of note, Surf Life Saving Australia has recently adopted a “combined ap-proach” to promoting how to escape a rip current (Bradstreet et al., 2014). This decision was largely based on field tests of
rip escape strategies (McCarroll et al., 2014; Van Leeuwen et al., 2016), which clearly showed that natural variance in rip flow behavior influences effectiveness of different rip escape strategy strategies. This has also been illustrated by recent numerical modeling studies (McCarroll et al., 2015; Castelle et al., 2016a, b). However, communicating such a complex and mixed message is problematic. In contrast, concepts of rip avoidance instruction are consistent and simpler to ex-plain, making them more suitable for advertising campaigns and signage (Bradstreet et al., 2014).
While there is still insufficient evidence to suggest that present warning systems help people avoid and escape rip currents (see also Lapinski et al., 2014), there is evidence that lifeguards are effective at preventing drowning death through preventive actions and rescues. With proper training and ex-perience a lifeguard can provide invaluable local understand-ing of the rip hazard to provide effective mitigation. Unfor-tunately, there is no consensus amongst beach users that it is safe (or not) to swim in the surf after lifeguards are off duty (Petrass and Blitvich, 2014), despite evidence that it is safer to swim in the presence of a lifeguard. In this respect, greater focus should be placed on reminding beach users to swim near lifeguards and only at times that lifeguards are present because “the chances of drowning at a beach protected by lifeguards trained under USLA standards is less than 1 in 18 million” (Branche et al., 2001).
5 Conclusions
A survey about the extent of public rip current knowledge in the United States was conducted with the aim of establish-ing a dataset that provides guidance for the improvement and enhancement of existing beach safety interventions. Results suggest that the US-based Break the Grip of the Rip!® cam-paign has been successful in helping inform the public about rip current safety. Although few respondents were familiar with the campaign itself, most respondents could provide an accurate description of how to escape a rip current by swim-ming parallel and/or floating until the current weakened. Re-sults suggest that the most at-risk population are infrequent beach users because they do not seek out lifeguards, do not take the same precautions as frequent beach users, and be-lieve there are large discrepancies between rip forecasts and their own observations at the beach. Survey results provide a conservative estimate of 10 % of US beachgoers being at risk of being caught in a rip due to ignorance and/or poor swimming choices. Future education efforts should attempt to target this beach-going demographic group. Knowledge of rips, visual ability to accurately identify a safe swimming location in where rip currents are present, and ability to inter-pret rip forecasts are each dependent on prior experience with rips and the frequency of beach visitation. In addition to con-cerns about the spatial and temporal accuracy of public rip forecasts, many respondents identified a lack of local detail in
Appendix A
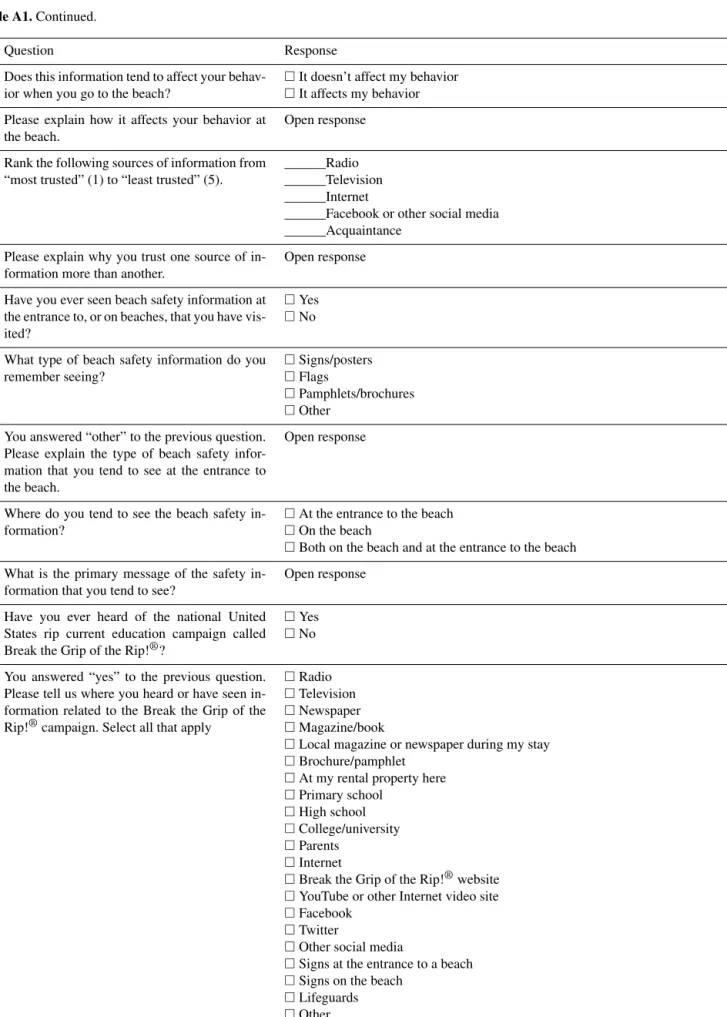
Table A1.Survey instrument.
Question Response
Are you a resident of the United States? Yes/no If resident – in what state do you currently
re-side?
List of US states
If resident – what is your zip code? Open response If not resident – in which country do you reside? List of countries Which best describes your gender? Male/female/no response What is your age? 18–20 years
21–30 years
31–40 years
41–50 years
51–60 years
61–64 years
65 years and over Which statement about beach visitation best
de-scribes your experience?
Infrequently (fewer than 10 times in my life)
Once every year typically on vacation
I go multiple times per year
Several times per month
Frequently (weekly or daily) How would you describe the beaches that you
commonly visit?
Calm with small to no waves
Occasional wave activity, primarily during storms
Regular wave activity but typically small- or medium-sized waves
Strong waves are common What is the main type of activity you do when
you go to the beach?
Swimming and wading
Board riding (including surfboard, boogie board, stand up, etc.)
Beach activities only (sunbathing, shell collecting, etc.)
Snorkeling or diving
Other If other selected – describe what you tend to do
at the beach.
Open response
Have you ever had swimming lessons or train-ing, either in a pool or ocean?
Yes/no
How would you rate your pool swimming abil-ity?
Unable to swim
Weak swimmer
Competent swimmer
Highly competent swimmer How far do you think you can swim in a pool
before you have to stop/pause?
I can’t swim
Less than 25 yards (one length of a typical community swimming pool)
More that 25 yards but less than 100 yards
More than 100 yards but less than 500 yards
More than 500 yards How would you rate your swimming ability in
open water with waves (like an ocean or lake)?
I have never swum in water with lots of waves
Weak swimmer
Competent swimmer
Unsure What is the most important factor for you when
choosing an ocean or lake beach to visit, with the intention of going into the water?
Safety (e.g., are not prone to theft)
Safety in the water (avoid dangerous water hazards)
Lifeguard presence
Cleanliness of the beach and water
Crowds (prefer to be on a popular beach)
Crowds (prefer to be on a secluded, private or empty beach)
Ease of access
Avoid lots of breaking waves (i.e., prefer calm conditions)
Prefer lots of breaking waves
Other You answered “other” to the previous questions.
Please describe the most important factor for you when choosing an ocean or lake beach to visit.
Open response
When you go to the beach, how important is it to you to swim near a lifeguard?
Not important
Important
Very important If you visit a beach with no lifeguards, do you
still go into the water to wade, swim, or float?
Always
Most of the time
Sometimes
Rarely
Never Do you think about or check for hazards when
you go to the beach?
Always
Most of the time
Sometimes
Rarely
Never What do you think is the most dangerous hazard
when you swim, wade, or float at the beach?
Jellyfish Sharks Big waves Shore breaks Undertow Alongshore currents Rip currents
Surfboards/boogie boards/other swimmers
Sunburn
Other You answered “other” to the previous question.
Please identify what you think is the most dan-gerous hazard at the beach.
Table A1.Continued.
Question Response
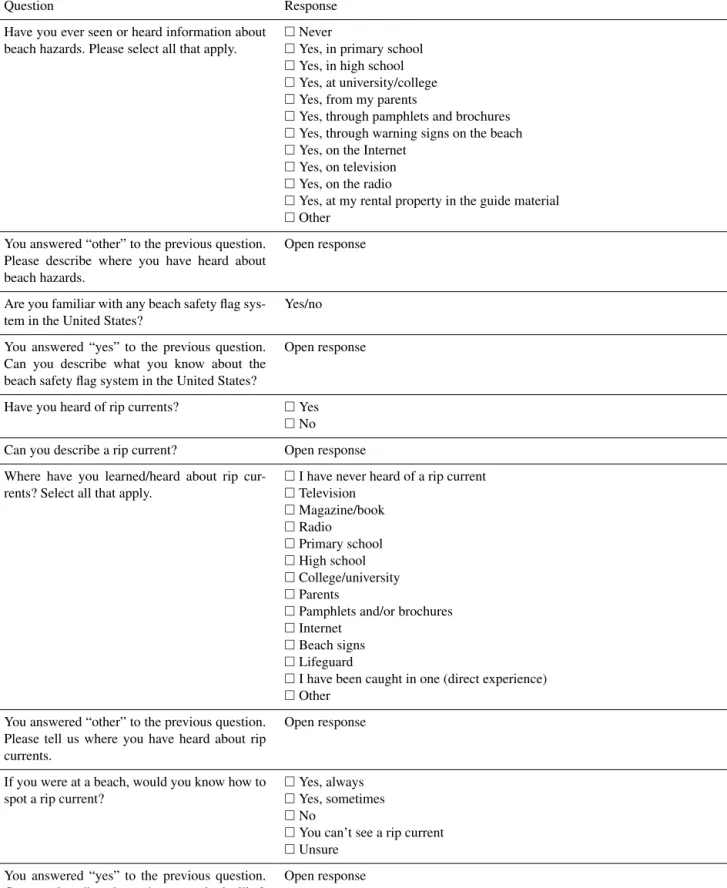
Have you ever seen or heard information about beach hazards. Please select all that apply.
Never
Yes, in primary school
Yes, in high school
Yes, at university/college
Yes, from my parents
Yes, through pamphlets and brochures
Yes, through warning signs on the beach
Yes, on the Internet
Yes, on television
Yes, on the radio
Yes, at my rental property in the guide material
Other You answered “other” to the previous question.
Please describe where you have heard about beach hazards.
Open response
Are you familiar with any beach safety flag sys-tem in the United States?
Yes/no
You answered “yes” to the previous question. Can you describe what you know about the beach safety flag system in the United States?
Open response
Have you heard of rip currents? Yes
No
Can you describe a rip current? Open response Where have you learned/heard about rip
cur-rents? Select all that apply.
I have never heard of a rip current
Television Magazine/book Radio Primary school High school College/university Parents
Pamphlets and/or brochures
Internet
Beach signs
Lifeguard
I have been caught in one (direct experience)
Other You answered “other” to the previous question.
Please tell us where you have heard about rip currents.
Open response
If you were at a beach, would you know how to spot a rip current?
Yes, always
Yes, sometimes
No
You can’t see a rip current
Unsure You answered “yes” to the previous question.
Can you describe what a rip current looks like?
Where on this photograph would you feel most safe to enter the water? Click on the picture at the spot along the beach that you believe is the safest.
Where on this photograph would you feel most safe to enter the water? Click on the picture at the spot along the beach that you believe is the safest.
Explain what you should do if caught in a rip current?
Open response
Have you ever been caught in a rip current? Yes, I was caught in a rip by accident
Yes, I used the rip on purpose (e.g., for surfing)
No
Not sure You answered that you had been caught in a
rip current. Where (ie. what beach) were you caught in a rip current?
Open response
You answered that you were caught in a rip cur-rent by accident. How did you get out of the rip current the first time this happened to you?
Self-escaped by swimming parallel to the beach first, then back to the beach
Self-escaped by swimming straight back to the beach
Self-escaped by just floating
Rescued by lifeguard
Rescued by bystander (e.g., family, friend, stranger, surfer)
Don’t know/can’t remember Before going to the beach, do you get
informa-tion on the beach and surf condiinforma-tions for the day?
Yes
No
You answered “yes” to the previous question. What source do you use to get information on the beach and surf conditions for the day? Select all that apply.
Radio
Television
Internet
Facebook or other social media
Acquaintance
Other You answered “other” to the previous question.
Please explain the other source of information about beach and surf conditions that you use.
Table A1.Continued.
Question Response
Does this information tend to affect your behav-ior when you go to the beach?
It doesn’t affect my behavior
It affects my behavior Please explain how it affects your behavior at
the beach.
Open response
Rank the following sources of information from “most trusted” (1) to “least trusted” (5).
______Radio ______Television ______Internet
______Facebook or other social media ______Acquaintance
Please explain why you trust one source of in-formation more than another.
Open response
Have you ever seen beach safety information at the entrance to, or on beaches, that you have vis-ited?
Yes
No
What type of beach safety information do you remember seeing?
Signs/posters
Flags
Pamphlets/brochures
Other You answered “other” to the previous question.
Please explain the type of beach safety infor-mation that you tend to see at the entrance to the beach.
Open response
Where do you tend to see the beach safety in-formation?
At the entrance to the beach
On the beach
Both on the beach and at the entrance to the beach What is the primary message of the safety
in-formation that you tend to see?
Open response
Have you ever heard of the national United States rip current education campaign called Break the Grip of the Rip!®?
Yes
No
You answered “yes” to the previous question. Please tell us where you heard or have seen in-formation related to the Break the Grip of the Rip!®campaign. Select all that apply
Radio
Television
Newspaper
Magazine/book
Local magazine or newspaper during my stay
Brochure/pamphlet
At my rental property here
Primary school
High school
College/university
Parents
Internet
Break the Grip of the Rip!®website
YouTube or other Internet video site
Other social media
Signs at the entrance to a beach
Signs on the beach
Lifeguards
If you see this sign at a beach, how would it change your behavior at the beach?
Yes
No
Does this sign help you identify a rip current? Open response You answered “yes” to the previous question.
How does it help you identify a rip current?
Open response
What other information would be useful to be included in the Break the Grip of the Rip!® sign?
Open response
Have you ever seen or heard rip current fore-casts from the following sources? Select all that apply. Radio Newspaper Television Internet Social media No
Do you understand what it means if there is a “high risk” for rip currents?
Yes
No
You answered “yes” to the previous question. What does a high risk of rip currents mean?
Open response
Do you understand what it means if there is a “low risk” for rip currents?
Yes
No
You answered “yes” to the previous question. What does a low risk of rip currents mean?
Open response
Do you adjust your activities at the beach based on the rip forecast?
Open response
If you heard a rip current forecast (e.g., low risk or high risk) and went to the beach on the same day, did the forecast match the conditions that you encountered at the beach?
Yes
No
You answered “no” to the previous question. How did the conditions that you encountered differ from the conditions that you experienced at the beach?
Competing interests. The authors declare that they have no conflict of interest.
Edited by: Vassiliki Kotroni
Reviewed by: Robin Davidson-Arnott and Olga Petrucci
References
Arozarena, I., Houser, C., Echeverria, A. G., and Brannstrom, C.: The rip current hazard in Costa Rica, Nat. Hazards, 77, 753–768, 2015.
Arun Kumar, S. V. V. and Prasad, K. V. S. R.: Rip current-related fatalities in India: a new predictive risk scale for forecasting rip currents, Nat. Hazards, 70, 313–335, 2014.
Ashley, W. S. and Black, A. W.: Fatalities associated with noncon-vective high-wind events in the United States, J. Appl. Meteorol. Climatol., 47, 717–725, 2008.
Barnes, P. H.: Approaches to community safety: risk perception and social meaning, Aust. J. Emerg. Manag., 1, 15–23, 2002. Barrett, G. and Houser, C.: Identifying hotspots of rip current
ac-tivity using wavelet analysis at Pensacola Beach, Florida, Phys. Geogr., 33, 32–49, 2012.
Bradstreet, A. J., Brander, R. W., McCarroll, J. R., Brighton, B., Dominey Howes, D., Drozdzewski, D., Sherker, S., Turner, I., Roberts, A., and MacMahan, J.: Rip current survival principles: Towards consistency, J. Coastal Res., 72, 85–92, https://doi.org/10.2112/SI72-016.1, 2014.
Branche, M.: Lifeguard effectiveness: A report of the working group, Atlanta, GA, Centers for Disease Control and Prevention, National Center for Injury Prevention and Control, 2001. Brander, R. W., Bradstreet, A., Sherker, S., and MacMahan, J.:
Re-sponses of swimmers caught in rip currents: perspectives on mit-igating the global rip current hazard, Int. J. Aquat. Res. Educ., 5, 476–482, 2011.
Brander, R., Dominey-Howes, D., Champion, C., Del Vecchio, O., and Brighton, B.: Brief Communication: A new perspec-tive on the Australian rip current hazard, Nat. Hazards Earth Syst. Sci., 13, 1687–1690, https://doi.org/10.5194/nhess-13-1687-2013, 2013.
Brannstrom, C. and Houser, C.: “Riding the rip”: an experiential and integrated human–physical geography curriculum in Costa Rica, J. Geogr. Higher Educ., 39, 527–542, 2015.
Brannstrom, C., Trimble, S., Santos, A., Brown, H. L., and Houser, C.: Perception of the rip current hazard on Galveston Island and North Padre Island, Texas, USA, Nat. Hazards, 72, 1123–1138, 2014.
Brannstrom, C., Brown, H. L., Houser, C., Trimble, S., and Santos, A.: “You can’t see them from sitting here”: Evaluating beach user understanding of a rip current warning sign, Appl. Geogr., 56, 61–70, 2015.
Brighton, B., Sherker, S., Brander, R., Thompson, M., and Brad-street, A.: Rip current related drowning deaths and rescues in Australia 2004–2011, Nat. Hazards Earth Syst. Sci., 13, 1069– 1075, https://doi.org/10.5194/nhess-13-1069-2013, 2013. Brilly, M. and Polic, M.: Public perception of flood risks, flood
fore-casting and mitigation, Nat. Hazards Earth Syst. Sci., 5, 345–355, https://doi.org/10.5194/nhess-5-345-2005, 2005.
Caldwell, N., Houser, C., and Meyer-Arendt, K.: Ability of beach users to identify rip currents at Pensacola Beach, Florida, Nat. Hazards, 68, 1041–1056, 2013.
Carey, W. and Rogers, S.: Rip currents: coordinating coastal re-search, outreach and forecast methodologies to improve public safety, in: Solutions to Coastal Disasters 2005, ASCE, 285–296, 2005.
Castelle, B., McCarroll, R. J., Brander, R. W., Scott, T., and Dubar-bier, B.: Modelling the alongshore variability of optimum rip cur-rent escape strategies on a multiple rip-channelled beach, Nat. Hazards, 81, 664–686, 2016a.
Castelle, B., Scott, T., Brander, R. W., and McCarroll, R. J.: Rip current types, circulation and hazard, Earth-Sci. Rev., 163, 1–21, 2016b.
Drozdzewski, D., Shaw, W., Dominey-Howes, D., Brander, R., Wal-ton, T., Gero, A., Sherker, S., Goff, J., and Edwick, B.: Surveying rip current survivors: preliminary insights into the experiences of being caught in rip currents, Nat. Hazards Earth Syst. Sci., 12, 1201–1211, https://doi.org/10.5194/nhess-12-1201-2012, 2012. Drozdzewski, D., Roberts, A., Dominey-Howes, D., and Brander,
R.: The experiences of weak and non-swimmers caught in rip currents at Australian beaches, Aust. Geogr., 46, 15–32, 2015. Espluga, J., Gamero, N., Prades, A., and Solà, R.: El papel de la
confianza en los conflictos socio ambientales, Política y sociedad 46, 225–273, 2009.
Gensini, V. A. and Ashley, W. S.: An examination of rip current fatalities in the United States, Nat. Hazards, 54, 159–175, 2010. Green, C. H., Tunstall, S. M., and Fordham, M. H.: The risks
from flooding: Which risks and whose perception?, Disasters, 15, 227–236, 1991.
Hall, T. E. and Slothower, M.: Cognitive factors affecting home-owners’ reactions to defensible space in the Oregon coast range, Soc. Natur. Resour., 22, 95–110, 2009.
Hartmann, D.: Drowning and Beach-Safety Management (BSM) along the Mediterranean Beaches of Israel – a long-term perspec-tive, J. Coastal Res., 22, 1505–1514, 2006.
Hatfield, J., Williamson, A., Sherker, S., Brander, R., and Hayen, A.: Development and evaluation of an intervention to reduce rip current related beach drowning, Accident Anal. Prev., 46, 45–51, 2012.
Heitz, C., Spaeter, S., Auzet, A. V., and Glatron, S.: Local stake-holders’ perception of muddy flood risk and implications for management approaches: A case study in Alsace (France), Land Use Policy, 26, 443–451, 2009.
Houser, C., Caldwell, N., and Meyer-Arendt, K.: Rip Current Haz-ards at Pensacola Beach, Florida, Rip currents: beach safety, physical oceanography, and wave modeling, p. 175, 2011a. Houser, C., Barrett, G., and Labude, D.: Alongshore variation in the
rip current hazard at Pensacola Beach, Florida, Nat. Hazards, 57, 501–523, 2011b.
Houser, C., Arnott, R., Ulzhöfer, S., and Barrett, G.: Nearshore Cir-culation over Transverse Bar and Rip Morphology with Oblique Wave Forcing, Earth Surf. Proc. Land., 38, 1269–1279, 2013. Houser, C., Murphy, T., and Labude, D.: Alongshore
correspon-dence of beach users and rip channels at Pensacola Beach, Florida, Nat. Hazards, 78, 2175–2183, 2015.
Houser, C., Brander, R., Brannstrom, C., Trimble, S., and Flaherty, J.: Case Study of Rip Current Knowledge amongst Students