REVIEW ARTICLE
published: 04 July 2014 doi: 10.3389/fneur.2014.00093
Network connectivity in epilepsy: resting state fMRI and
EEG–fMRI contributions
Maria Centeno1,2
* and David W. Carmichael1,2
1Imaging and Biophysics Unit, Institute of Child Health, University College London, London, UK 2Epilepsy Unit, Great Ormond Street Hospital, London, UK
Edited by:
Jesus Eduardo Pastor, Hospital Universitario La Princesa, Spain Reviewed by:
Erik K. St. Louis, Mayo Clinic and Foundation, USA
Guillermo José Ortega, Instituto de Investigación Sanitaria Hospital de la Princesa, Spain
*Correspondence: Maria Centeno, Imaging and Biophysics Unit, Institute of Child Health, University College London, 30 Guilford Street, London WC1N 1EH, UK
e-mail: [email protected]
There is a growing body of evidence pointing toward large-scale networks underlying the core phenomena in epilepsy, from seizure generation to cognitive dysfunction or response to treatment.The investigation of networks in epilepsy has become a key concept to unlock a deeper understanding of the disease. Functional imaging can provide valuable informa-tion to characterize network dysfuncinforma-tion; in particular resting state fMRI (RS-fMRI), which is increasingly being applied to study brain networks in a number of diseases. In patients with epilepsy, network connectivity derived from RS-fMRI has found connectivity abnormalities in a number of networks; these include the epileptogenic, cognitive and sensory process-ing networks. However, in majority of these studies, the effect of epileptic transients in the connectivity of networks has been neglected. EEG–fMRI has frequently shown networks related to epileptic transients that in many cases are concordant with the abnormalities shown in RS studies. This points toward a relevant role of epileptic transients in the net-work abnormalities detected in RS-fMRI studies. In this review, we summarize the netnet-work abnormalities reported by these two techniques side by side, provide evidence of their over-lapping findings, and discuss their significance in the context of the methodology of each technique. A number of clinically relevant factors that have been associated with connec-tivity changes are in turn associated with changes in the frequency of epileptic transients. These factors include different aspects of epilepsy ranging from treatment effects, cognitive processes, or transition between different alertness states (i.e., awake–sleep transition). For RS-fMRI to become a more effective tool to investigate clinically relevant aspects of epilepsy it is necessary to understand connectivity changes associated with epileptic tran-sients, those associated with other clinically relevant factors and the interaction between them, which represents a gap in the current literature. We propose a framework for the investigation of network connectivity in patients with epilepsy that can integrate epileptic processes that occur across different time scales such as epileptic transients and disease duration and the implications of this approach are discussed.
Keywords: epilepsy, functional connectivity, EEG–fMRI, resting state, resting state networks, RS-fMRI
INTRODUCTION
The notion of networks in epilepsy has gained momentum in the last decade, becoming a key concept used to explain the phenom-ena observed in this condition. Seizure generation, spread and termination as well as therapeutic response and cognitive impair-ment may be explained by the interactions between, and dysfunc-tion of, large-scale networks. Early evidence for the involvement of macroscopic networks in epilepsy syndromes arises from EEG studies (1) and, for the last decade, several authors have devel-oped a framework based on brain networks to explain various features of epilepsy (2–5). There is a growing body of evidence pointing toward large-scale networks, often bihemispheric and involving several lobes, underlying seizures in different epileptic syndromes (5).
Imaging studies have been one of the main contributors to the development of this network framework and have provided relevant information for the characterization of macroscopic net-work abnormalities in the epileptic brain. Functional MRI is a
powerful tool to investigate connectivity and organization of brain networks via differences in evoked responses to different stimuli. Resting state fMRI (RS-fMRI) has become an increasingly pop-ular way to employ fMRI that investigates synchronous activity between regions in the absence of an explicit task based on signal correlation. These studies have shown that there is a consistent pattern of spatially distinct, brain networks that show coherent signal fluctuations. RS-fMRI studies have been used to identify network abnormalities in many different pathologies including epilepsy (6).
Different approaches have been applied to the investigation of network connectivity in RS-fMRI studies. The first most com-monly used methodology is seed-based correlation maps (7), where the correlation betweena prioridefined regions of interest (ROI) is calculated within a temporal frequency range and used as an index of connectivity. Regions can contain common variance from various noise sources and this need to be removed, for exam-ple via regression or partial correlation (8,9). This approach can
Centeno and Carmichael Functional connectivity in epilepsy
be extended by using an anatomical parcelation of the brain from the lobar to the voxel scale and correlating every region with all other regions before comparing the resulting correlation matrix. These matrices represent a measure of the whole brain connec-tivity (connectome) and can be thresholded and binarized to obtain summaries of network properties using graph theory such as clustering, path length, and betweenness centrality. Each of these metrics has well characterized implications for networks in terms of properties such as their efficiency for information transfer and robustness to damage.
Several metrics have been used to look at measures of corre-lation with some spatial support; these include methods such as regional homogeneity (ReHo) (10), functional integration (11), and global brain asymmetry.
The second main method is spatial independent component analysis of fMRI data that separates the signal into spatial maps of covarying voxels (12). Components that are related to brain activ-ity then need to be identified as resting state networks by selecting them from components related to sources of noise. This is typi-cally done by looking at the spatial and temporal properties of the components.
Brain network connectivity is not static and so the investi-gation of network dynamics is an important further step. Not only correlations, but causality between nodes can be evaluated. This has been achieved for example through biophysical com-putational models such as dynamic causal models (DCM) (13), structural equation modeling (14), and granger causality (15). Although some methods have shown their robustness on model-ing causal statistical influences between simultaneously recorded neural time series data (16), the use of these methods in fMRI data is still controversial. This is due to the inherent limitations of fMRI: slow dynamics, regional variability of the hemodynamic response to underlying neuronal activity and the complexities of image acquisition (differences in slice timing). These methods must be used with care and with an appropriate understanding of their limitations (17–19).
Not only analysis methodology but also the definition of rest is different across RS-fMRI studies. Subjects may be instructed to rest with the eyes closed or open with or without visual fixation and these may be a confounding factor; in epilepsy drowsiness may be associated with a different rate of interictal activity and this may be influenced by the instructions given to the subject.
More detail information on the history, development of meth-ods and limitations of RS-fMRI studies can be found in these reviews (6, 20). The development of simultaneous EEG–fMRI acquisition has enabled a major step to be taken toward the iden-tification of network abnormalities related to epileptic activity. Detailed information about the methodology and its evolution can be found in recent reviews (21–23).
EEG–fMRI can be thought of as an extension of RS-fMRI, where the lack of a model of fMRI changes defined by an exper-imental paradigm is replaced by apost hocelectrophysiologically defined model of brain state. In studies of epilepsy, this is typically achieved by defining epochs of pathologic (e.g., interictal epilep-tiform discharges or ictal activity) versus normal background activity, although a similar approach can be applied to derive a
model from physiological rhythms (e.g., alpha and beta) (24,25). A voxel-wise analysis can then proceed to identify the brain regions with fMRI changes associated with these electrophysiological features.
Early application of EEG–fMRI was aimed at better characteri-zation and more accurate localicharacteri-zation of the brain areas involved in interictal spike generation (26), but it soon evolved into a research tool capable of investigating brain function in diseased and healthy populations.
However, it became clear that EEG–fMRI studies often revealed networks commonly reported in RS-fMRI studies (27). Despite this commonality and potential convergence of results there is very little cross reference between studies looking into brain net-works at rest in epilepsy and EEG–fMRI studies, making it timely to comparatively summarize the findings from each strand of liter-ature. One of the key questions that arise is regarding the role that epileptic transients might play in the findings of RS-fMRI studies, where this factor has been largely neglected.
The interaction between these two (network connectivity and epileptic transients) may be of a bidirectional nature. While the often transient stochastic nature of interictal and ictal discharges might imply a transition between (bi-stable) states it seems likely that these events occur in patients because of an alteration in net-work properties that facilitates abnormal synchronization within and between brain regions (or makes these transitions more likely by altering the systems dynamics). The properties of the epilep-tic network seem to evolve over multiple timescales, indexed by the typical clinical observations that epileptic events frequency is modulated by cognitive load, sleep, stress, and disease duration. Therefore, we need to better understand and evaluate network structure in epilepsy and the dynamic changes occurring within it at multiple timescales (from milliseconds to years).
Since some RS-fMRI studies have found an association between network abnormalities and clinical variables that in turn often cor-relate with frequency of epileptic transients (i.e., age of epilepsy onset, duration of epilepsy, response to treatment, and cogni-tive function), it makes sense to consider that the integration of this information in the investigation of network abnormalities in epilepsy will lead to novel ways of interpreting network changes observed.
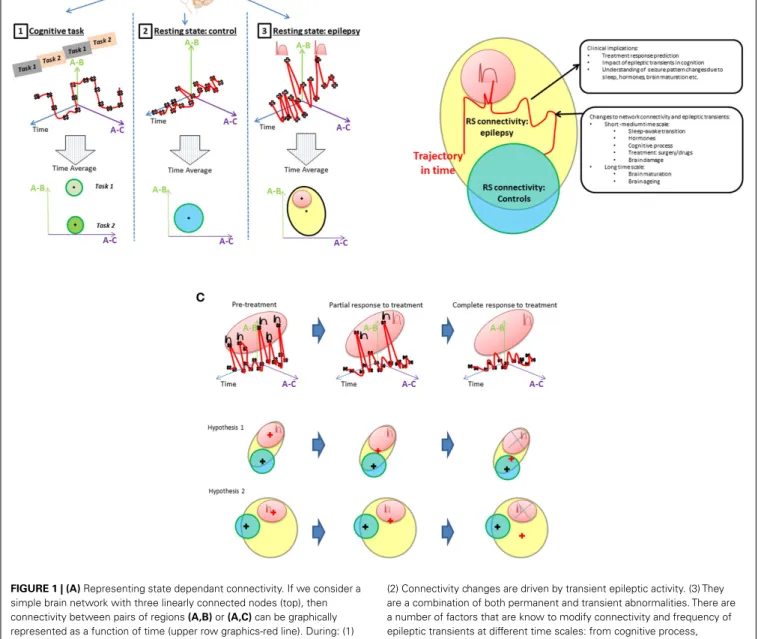
The integration of EEG information into network connectivity analysis requires the dynamic of connectivity to be considered. Classically, connectivity studies have assumed network connec-tivity can be characterized as the mean over a period of time (an fMRI session). This is represented inFigure 1A. Inferences about network connectivity differences between patients and con-trols have been estimated by comparing average connectivity. The addition of the temporal dimension (Figure 1B) opens the door to explore the interaction between connectivity and epileptic activity.
In this review, network abnormalities reported by RS-fMRI and EEG–fMRI studies are compared side to side and the role of epilep-tic transients in the RS-fMRI findings to date is discussed. Finally, we propose and discuss a framework to investigate the interac-tion of epileptic transients in connectivity (Figures 1A,B) and the potential applications of this framework (Figure 1C).
Centeno and Carmichael Functional connectivity in epilepsy
FIGURE 1 | (A)Representing state dependant connectivity. If we consider a simple brain network with three linearly connected nodes (top), then connectivity between pairs of regions(A,B)or(A,C)can be graphically represented as a function of time (upper row graphics-red line). During: (1) cognitive tasks; (2) resting state in healthy population; and (3) resting state in patients with epilepsy. The fluctuations of this network’s connectivity in time could be measured at points illustrated by the black crosses. The brain’s connectivity state during rest and activity can then be summarized by the mean and range represented by the “+” and circles areas, respectively, in the lowest row of “Time average” plots. Epileptic transients are associated with changes in network connectivity (peaks in top right graphic) that account for a proportion of the connectivity (red area) expected to lie outside of the range associated with resting state activity in controls. The contribution of epileptic transients (red area) to the RS connectivity differences found patients with epilepsy (cross in the yellow area) and how this relates to normal connectivity (blue area in adjacent plot) still remains to be well characterized.(B)Connectivity differences between controls and epilepsy. Resting connectivity in patients with epilepsy (yellow area) falls out of the range (blue area) seen in controls for certain networks as reported by RS studies. Several hypotheses can be derived from this observation, e.g., (1) Connectivity changes are permanent abnormalities.
(2) Connectivity changes are driven by transient epileptic activity. (3) They are a combination of both permanent and transient abnormalities. There are a number of factors that are know to modify connectivity and frequency of epileptic transients at different time scales: from cognitive process, sleep/awake transitions, or treatment effects in the short–medium term through to brain maturation and aging occurring at a long term scale. An example change in connectivity due to such factors is shown as trajectory in time (red line) through a space defined by the connectivity that can be measured using RS-fMRI. However, to understand connectivity changes associated with these factors, it is crucial to obtain measurements at different time points along the trajectory and associated them with clinically relevant factors. If RS connectivity dynamics and the role of epileptic transients in altering measured RS-fMRI connectivity are understood, RS connectivity measurements may be a potential biomarker of a number of clinically relevant aspects in epilepsy such as prediction of response to treatment, cognitive dysfunction associated to epilepsy or change to seizure patterns due to hormones, sleep, brain maturation, etc.(C)Example of a model of connectivity changes applied to investigate drug treatment in epilepsy. Any factor that modifies the rate of epileptic transients will result in changes to the RS connectivity.
(Continued)
Centeno and Carmichael Functional connectivity in epilepsy
FIGURE 1 | Continued
In the case of medical treatment, different degrees of response (partial or complete) would be associated with different connectivity states in a patient; more epileptic transients, means the network would spend more time with connectivity values in the “epileptic transient connectivity region” (red area) as illustrated in the first row graphic. How these changes to connectivity affect the mean connectivity of a patient with epilepsy is dependant on the proportion of abnormal connectivity explained by the epileptic transients. In this case, two scenarios are possible. Hypothesis 1: connectivity abnormalities in patients with epilepsy are mainly due to the abnormalities
associated to epileptic transients, in which case, the gradual reduction of transients in time will result in the mean connectivity of a patient with epilepsy (represented by a red+) progressively moving towards connectivity found within the healthy population (represented by the blue circle with the mean on the black cross position). Alternatively, hypothesis 2 illustrates how if only a proportion of connectivity abnormalities are due to epileptic transients, connectivity may change in time due to treatment with a reduction in epileptic transients, however, the connectivity remains significantly different to the healthy population with potential therapeutic and cognitive consequences.
EPILEPTOGENIC NETWORK ABNORMALITIES
The epileptogenic network refers to the areas involved in gen-eration and spread of epileptic activity. These networks may vary across the different syndromes. Epilepsy syndromes have traditionally been classified based on the electro-clinical pat-terns, into focal and primary generalized syndromes (28). Focal epilepsies are defined by EEG correlates circumscribed to an area of the cortex as opposed to generalized syndromes in which the totality of the cortex is thought to be involved in seizure generation.
Although this classical view marks a clear difference based on the extent of cortex involved in seizure generation, there is a growing body of evidence pointing toward the involvement of large-scale networks underlying both the focal (5,29) and the generalized syndromes (30–33) as well as evidence of epileptic activity being focally initiated in idiopathic generalized epilepsy (IGE) (29,32). From this perspective, the boundaries between “focal” and “generalized” epilepsies have become more blurred. Under this framework, the concept of zones (e.g., the epilepto-genic zone), adopted from the stand point of epilepsy surgery (34) can become more general in meaning. The epileptogenic zone and seizure onset zone could be exchanged for the network nodes that (by removal) can alter the network properties such that seizures cannot be generated. The network framework makes the poten-tial range of processes and mechanisms of seizure generation and spread more varied; seizures arising from a hyper excitable region may entrain a larger neural network (5). Furthermore, recent the-oretical studies of networks suggests that the network structure itself can generate seizures with or without the hyper excitable region (29).
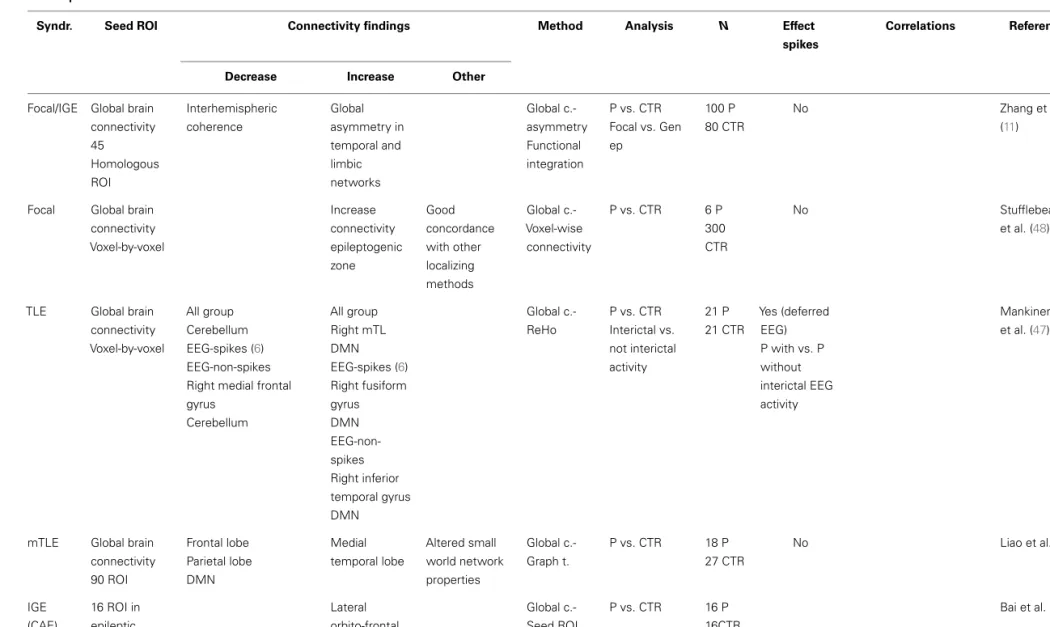
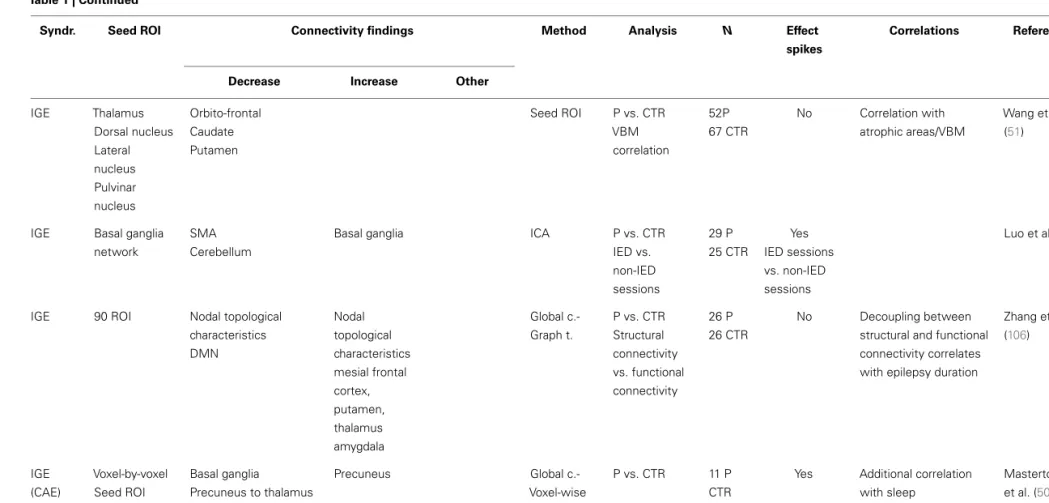
Resting state fMRI studies in patients with epilepsy have pro-vided extensive information about abnormalities in the epilepto-genic networks in the different epileptic syndromes (Table 1).
The majority of RS-fMRI studies in focal epilepsies have focused on temporal lobe epilepsy (TLE). TLE has the advan-tage of being one of the most prevalent and homogeneous group within the focal epilepsy syndromes, and although it provides a good model for investigating abnormalities in the epileptogenic network, the impact of these findings for surgical management of patients is limited given the efficacy of standard pre-surgical evaluation and surgical approaches in this group (35).
The epileptogenic network in TLE is relatively well charac-terized (5), comprising of a number of structures in the mesial temporal lobe (amygdala and hippocampus), adjacent cortex including entorhinal cortex and lateral temporal cortex and extra temporal structures including thalamus and orbito-frontal cortex.
The contralateral homologous regions serve the rapid spread of seizure activity. Connectivity maps seeding in these areas of the epileptogenic network have shown a number of abnormalities, comprising decreased connectivity within a set of sub regions in the epileptic temporal lobe (36–39), decreased connectivity between hippocampi (39–42), and decreased connectivity between the hippocampus and the orbito-frontal region (40). Decreased connectivity is the most common finding among those studies targeting the epileptogenic network; hence it is interesting to com-pare these findings with other measures of neuronal connectivity such as EEG. Although not recorded simultaneously, intracranial EEG (icEEG) showed an increase in connectivity between the same subset of regions found to be less connected by fMRI (38). Con-nectivity of the epileptogenic regions measured by EEG has shown diverse results. Classically, hyper-synchrony within the epilepto-genic regions has been shown using intracranial electrodes (43,
44), however, evidence of decreased synchronization of electrical activity have also been reported during ictal (45) and interic-tal (46) states. Variability of connectivity between studies in the epileptogenic regions may be in part explained by the difference in methodology between studies (type of intracranial electrodes, the analysis method applied to the data and the regions included in the network). However, the investigation of temporal dynamics of EEG-based connectivity shows that the desynchronization in the epileptogenic regions fluctuate at different time points (46).
The relationship between network connectivity as measured by EEG and fMRI has barely been explored. Recently, we introduced a framework to investigate this in EEG–fMRI data acquired simul-taneously (Deligianni et al., submitted). In this work, we showed that EEG-based connectivity had more intra-hemispheric com-ponents compared with MRI-based connectivity that showed a predominance of inter-hemispheric connections. The prediction of connectivity patterns from one modality to the other worked better when fMRI is predicted from EEG than vice versa, indicat-ing that EEG connectivity may have a greater level of complexity compared to that derived from fMRI.
Further research is needed to be done in order to further understand the relationship between the connectivity measured by these two modalities and in turn to interpret the similarities and discrepancies seen in the pathological brain.
Although the majority of RS-fMRI studies report decreases of connectivity within the epileptogenic network, there are also reports of increased connectivity. These increases may be located in areas overlapping the epileptogenic region, but are typically reported in areas outside the epileptogenic region suggesting a compensatory mechanism: Bettus et al. reported in several studies
Centeno and Carmic hael F unctional connectivit y in epilepsy
Table 1 | Resting state studies in epilepsy reporting abnormalities of the epileptogenic network.
Syndr. Seed ROI Connectivity findings Method Analysis N Effect spikes
Correlations Reference
Decrease Increase Other
TLE Hippocampus
Thalamus
From hippocampus: Superior medial gyrus Midcingulate gyrus Contralateral posterior cingulate (DMN) From thalamus: IFG
From hippocampus Parietal lobe Middle temporal gyrus Seed ROI P vs. CTR Correlation with structural abnormalities 15 P 15 CTR No Holmes et al. (115)
TLE Hippocampus Seed ROI Correlation
with memory scores
15 P 15 CTR
No Memory scores
positive correlation with connectivity to contralateral hippocampus and negative correlation with ipsilateral hip
Holmes et al. (55) mTLE Amygdala Hippocampus DMN Contralateral mTL Limbic prefrontal regions Seed ROI P vs. CTR 23 P 23 CTR Yes Simultaneous EEG–fMRI Excluded sessions with IED Pittau et al. (42) mTLE +HS
Hippocampus DMN angular gyri, thalami medial frontal
Seed ROI correlation P vs. CTR Correlation with memory scores 21 P 12 CTR No RTLE: increased connectivity to frontal regions, better performance LTLE: increased connectivity to posterior regions – worse performance Doucet et al. (116)
mTLE Hippocampus Left
hippocampus influences right Granger causality P vs. CTR Correlation with duration/age onset
19 P No Epilepsy duration above
10 years correlates: increases of inter-hippocampal connectivity Swap of directionality of influence Morgan et al. (41) (Continued) www .fr ontiersin.or g J uly 20 1 4 |V olume 5 | Article 93 | 5
Centeno and Carmic hael F unctional connectivit y in epilepsy Table 1 | Continued
Syndr. Seed ROI Connectivity findings Method Analysis N Effect spikes
Correlations Reference
Decrease Increase Other
TLE Hippocampus Amygdala Entorhinal c. Brodmann 38 TL network epileptic side TL network contralateral side IC EEG connectivity pattern is opposed to fMRI connectivity pattern
Seed ROI Comparison between ipsi-contralateral network IC EEG connectivity vs. fMRI connectivity 5 P No Bettus et al. (38) mTLE Hippocampus Amygdala Entorhinal c. Brodmann 38 TL network epileptic side TL network contralateral side Seed ROI P vs. CTR Correlation with clinical factors Correlation with cognitive scores 22 P 36 CTR No No correlation with clinical data (N seizures/disease duration/onset) but increases correlated with cognitive scores
Bettus et al. (36) mTLE Hippocampus Amygdala Entorhinal c. Brodmann 38 TL network epileptic side TL network contralateral side Seed ROI P vs. CTR Correlation with cognitive scores 8 TLE 26 CTR No Increases on connectivity correlates with memory performance Bettus et al. (37) mTLE +HS Hippocampus Ipsi-contralateral Hippocampus Seed ROI P vs. CTR 18 P 9 CTR No Pereira et al. (39) Focal EEG–fMRI activation within resection area
Seed ROI Correlation with surgical outcome 18 P 14 CTR No Strongly lateralized connectivity map correlates with good surgery outcome Negishi et al. (117) Focal (nodular hetero-topia) Heterotopic nodule/s Network composed by other nodules and overlying cortex
Seed ROI Correlation with epilepsy duration Correlation with tractography 11 P No Longer duration of epilepsy correlates with greater connectivity abnormalities Functional connectivity maps correlate with tractography Christodoulou et al. (118) (Continued) F rontiers in Neur olog y | Epilepsy J uly 20 1 4 |V olume 5 | Article 93 | 6
Centeno and Carmic hael F unctional connectivit y in epilepsy Table 1 | Continued
Syndr. Seed ROI Connectivity findings Method Analysis N Effect spikes
Correlations Reference
Decrease Increase Other
Focal/IGE Global brain connectivity 45 Homologous ROI Interhemispheric coherence Global asymmetry in temporal and limbic networks Global c.-asymmetry Functional integration P vs. CTR Focal vs. Gen ep 100 P 80 CTR No Zhang et al. (11)
Focal Global brain connectivity Voxel-by-voxel Increase connectivity epileptogenic zone Good concordance with other localizing methods Global c.-Voxel-wise connectivity P vs. CTR 6 P 300 CTR No Stufflebeam et al. (48)
TLE Global brain connectivity Voxel-by-voxel All group Cerebellum EEG-spikes (6) EEG-non-spikes Right medial frontal gyrus Cerebellum All group Right mTL DMN EEG-spikes (6) Right fusiform gyrus DMN EEG-non-spikes Right inferior temporal gyrus DMN Global c.-ReHo P vs. CTR Interictal vs. not interictal activity 21 P 21 CTR Yes (deferred EEG) P with vs. P without interictal EEG activity Mankinen et al. (47)
mTLE Global brain connectivity 90 ROI Frontal lobe Parietal lobe DMN Medial temporal lobe Altered small world network properties Global c.-Graph t. P vs. CTR 18 P 27 CTR No Liao et al. (95) IGE (CAE) 16 ROI in epileptic network Lateral orbito-frontal cortex inter-hemisphere Global c.-Seed ROI P vs. CTR 16 P 16CTR Bai et al. (52) (Continued) www .fr ontiersin.or g J uly 20 1 4 |V olume 5 | Article 93 | 7
Centeno and Carmic hael F unctional connectivit y in epilepsy Table 1 | Continued
Syndr. Seed ROI Connectivity findings Method Analysis N Effect spikes
Correlations Reference
Decrease Increase Other
IGE Thalamus Dorsal nucleus Lateral nucleus Pulvinar nucleus Orbito-frontal Caudate Putamen Seed ROI P vs. CTR VBM correlation 52P 67 CTR No Correlation with atrophic areas/VBM Wang et al. (51)
IGE Basal ganglia network
SMA Cerebellum
Basal ganglia ICA P vs. CTR
IED vs. non-IED sessions 29 P 25 CTR Yes IED sessions vs. non-IED sessions Luo et al. (49)
IGE 90 ROI Nodal topological characteristics DMN Nodal topological characteristics mesial frontal cortex, putamen, thalamus amygdala Global c.-Graph t. P vs. CTR Structural connectivity vs. functional connectivity 26 P 26 CTR No Decoupling between structural and functional connectivity correlates with epilepsy duration
Zhang et al. (106) IGE (CAE) Voxel-by-voxel Seed ROI Precuneus Thalamus Basal ganglia Precuneus to thalamus Precuneus Global c.-Voxel-wise connectivity Seed ROI P vs. CTR 11 P CTR
Yes Additional correlation with sleep
Masterton et al. (50)
For each study, information is provided regarding the epileptic syndrome included in the study, the areas where connectivity was seeded from (ROI), in case of those studies using this approach; the main findings subdivided in increases and decreases of connectivity, and whether the effect of the spikes was addressed in the study (effect of spikes), as well as the correlations if any of the findings with clinical data. Synd., epileptic syndrome; Seed ROI, region of interest used as the connectivity seed; P, patients; CTR, controls; Focal, focal epilepsies; TLE, temporal lobe epilepsy; mTLE, medial TLE; HS, hippocampal sclerosis; IGE, idiopathic generalized epilepsies; CAE, childhood absence epilepsy; IDE, interictal epileptiform discharges; ICA, independent component analysis; Global c., global brain connectivity; Graph t., graph theory; ReHo, regional homogeneity; ALFF, amplitude of low-frequency fluctuations.
F rontiers in Neur olog y | Epilepsy J uly 20 1 4 |V olume 5 | Article 93 | 8
Centeno and Carmichael Functional connectivity in epilepsy
that connectivity was increased in the homologous network con-tralateral to the disrupted epileptogenic network in TLE, which are known to be propagation areas (36,37).
Whole brain connectivity analysis have found abnormalities in areas belonging to the epileptogenic network: using ReHo analysis of fMRI as a measure of abnormal local synchronicity, Mankinen et al. (47) have reported abnormalities in the right temporal lobe and default mode network (DMN) areas in a sample of patients with left and right non-lesional TLE. In another voxel-by-voxel analysis of local and long distance connectivity, Stufflebeam et al. (48) have shown abnormalities co-localized with the epileptogenic zone defined by icEEG in patients with focal epilepsy of different locations.
Similarly, in patients with IGE, several studies have investigated abnormalities in the epileptogenic networks by creating connectiv-ity maps from areas found to be involved in the seizure generation in these syndromes. The thalamus and the basal ganglia are most commonly chosen as seed regions, and they typically show reduced connectivity with other components in the network, mainly sub-cortical structures and orbito-frontal cortex (49–51). There are also reports of increased connectivity between hemispheres as shown by Bai et al. (52) in the lateral aspect of the orbito-frontal cortex in patients with childhood absence epilepsy (CAE) using two independent connectivity analysis methods (ROI seed maps and a voxel-by-voxel approach).
Methods that do not use a priorispatial hypothesis such as ICA (49,53), voxel-by-voxel connectivity analysis (50), or ReHo analysis (54) have also pointed to the existence connectivity abnor-malities in the so called cortico-subcortical network. In the study by Moeller et al. (53), the component corresponding to the cortico-subcortical network was found to be highly correlated with the interictal activity recorded simultaneously providing strong evi-dence that the epileptiform transients play a key role in the connectivity abnormalities uncovered by RS-fMRI in IGE.
Just a few studies have investigated how connectivity changes relate to clinical factors. Morgan et al. (41) showed that the ini-tial disruption of inter-hippocampal connectivity evolves into an increased connectivity after 10 years of disease duration in TLE. Directionality of the hippocampal influence also changes with the duration of epilepsy; in general there is a left over right hippocam-pal influence, regardless the side of epilepsy, however, this relation-ship is switched in patients with epilepsy duration>10 years where the contralateral hippocampus has the dominating influence over the affected one.
Connectivity changes have been also related with memory func-tion in TLE: memory scores are preserved in those patients with stronger connectivity to the contralateral temporal lobe (55) and in those with stronger intra-hippocampal connectivity and between hippocampus and frontal areas; and conversely, decreased connec-tivity to the orbito-frontal cortex was related to poorer memory performance (40).
EEG–fMRI was conceived as a technique to map the epilep-togenic networks. In focal epilepsies, several studies have shown found a good concordance between the regions of BOLD signal change during interictal activity and the epileptogenic regions mapped by standard techniques (56–63). It has been estimated that EEG–fMRI can contribute to more accurately localize the
epileptic focus in around 2/3 of pre-surgical cases as compared to the standard pre-surgical tests (60).
Similarly, in IGE, a large number of EEG–fMRI studies have characterized the networks involved in the generation of epileptic activity (64–68). Common findings across studies show activa-tion of a cortico-subcortical network composed by mid-frontal regions, thalami, caudate, and cerebellum during the occurrence of generalized spike-waves.
From early EEG–fMRI studies, it was noted that responses are often multiple and distributed in areas within the epileptic focus but also remotely located from epileptogenic regions in the case of focal epilepsies. Changes in BOLD signal have been reported on the contralateral homologous cortex, as well as extra temporal regions in patients with TLE (56,58) and (predominantly nega-tive) responses in DMN areas (27,66). This supports the presence of large-scale, often bilateral networks underlying focal epilepsies and the involvement of other networks such as the DMN during epileptic activity.
There is on-going work aimed at objectively deriving the epilep-togenic zone from EEG–fMRI maps in order to provide infor-mation that can be used for surgical evaluation (69). Different authors have chosen different statistical methods for its defini-tion: from the global maxima of response (59), to the number of voxels within the cluster (70). Several methods have aim to separate regions of propagation from those involved in initiation such as electrical source imaging (ESI) (71,72) of interictal spikes. These methods have been tested against surgical outcome, which is the gold standard for the localization of the epileptogenic net-work and more importantly assessing clinical utility. Good surgical outcome has been associated with the inclusion of the global max-ima of response being within the resection margins (59). On the contrary, responses discordant with the area of surgery, and wide-spread responses are a marker of poor prognosis (59) this was also observed in a group of patients with focal cortical dysplasia (con-firmed post-resection) whose post-surgical prognosis is typically good (73) likely indicating multifocal disease (74,75).
The dynamics of epileptic networks in focal epilepsy (76,77) and in IGE (30,78) have been investigated using DCM and slid-ing window analysis, aimslid-ing to identify the temporal and causal relationship between network nodes.
In IGE, crucial subcomponents of the network such as the thal-amus (79) have been targeted to further define their role, which could potentially inform targets for future therapies such as deep brain stimulation. However, there is still no consensus between the different studies as to the lead node or the exact role of the thalamus. There are several factors that might explain these dis-crepant results. Firstly, there is some methodological uncertainty in the temporal relationship between generalized spike and wave discharges (GSW) and fMRI changes with several studies indi-cating fMRI changes can precede GSW events (31). Further, the methods used in different studies to infer causality are not consis-tent and neither are the network nodes. This suggest that further work is needed both from a computational perspective to better predict how GSW arise (29) and a modeling perspective to better test these predictions with experimental data (80).
Even though EEG–fMRI and RS-fMRI studies have been able to identify networks involved in the generation and spread of
Centeno and Carmichael Functional connectivity in epilepsy
epileptiform activity, the interpretation of the findings greatly dif-fers between these two approaches. Whereas EEG–fMRI studies allow inference that the changes observed are related to interictal activity, RS-fMRI cannot differentiate, which changes observed in the network may be due to transient or permanent network abnor-malities. This is important, for example when trying to understand the mechanism for treatment response or effects of disease dura-tion; is the network connectivity fundamentally altered or is it that the number of transient events and transient changes in connectivity has been reduced?
COGNITIVE NETWORK ABNORMALITIES
Resting state fMRI studies have extensively investigated networks involved in cognitive processes and sensory-motor processing in the different epileptic syndromes (Table 2).
Abnormalities include decreased connectivity in language net-work (81), memory network (40), auditory and sensorimotor networks (82) as well as increases in connectivity of visual and dorsal attention networks (83) in patients with focal epilepsies. In IGE in whom cognition is expected not to be grossly abnormal, increased connectivity was found within the nodes of the atten-tion network and between attenatten-tion network and adjacent the supplementary motor area (84). Also self-referential, somatosen-sory, visual, and auditory networks connectivity is increased in IGE patients compared to controls (85).
In the case of cognitive networks, there is a higher variability between the changes observed as both reports of increases and decreases in connectivity are found in the literature in similar numbers.
The increases in connectivity observed in some studies have been associated to efficient compensatory changes that maintain cognitive function (40,83), but there are also notable reports of poorer function associated with the abnormal increase in con-nectivity between networks. For example, in juvenile myoclonic epilepsy (JME) increased SMA and working memory network functional connectivity was linked with increased demands in working memory function (86). This finding offered an expla-nation for the myoclonic jerks associated with cognitive-motor tasks that are found in this syndrome. Similarly, in patients with TLE, increased connectivity of working memory networks to the diseased hippocampus was associated with poorer performance in working memory tests (87).
How epileptic transients may affect these RS-fMRI findings is uncertain due to the lack of studies investigating this potential influence. In a report by Chaudhary et al. (88), EEG activity was monitored during a working memory–fMRI session; task related activation was found to be significantly decrease during the epilep-tic transient period. Interestingly, a modulatory effect of the task was also found on the frequency of epileptic activity that in turn was associated with task performance. In reflex epilepsies, the interaction between epileptic activity and cognitive network con-nectivity becomes even more pertinent,Vaudano et al. (76) showed in a patient with reading epilepsy, that areas within the cognitive network involved in reading (left prefrontal cortex) played a causal role in initiating reading-evoked seizures, potentially by facilitat-ing activity in the epileptogenic cortex, in this case, located in the premotor cortex. These reports again show the need for the
application of EEG information to better understand connectivity changes within and between cognitive networks in patients with epilepsy.
Abnormalities in the DMN deserve special attention due to the extended literature in this regard both from RS-fMRI and EEG–fMRI studies. In relation to interictal activity in focal epilep-sies, EEG–fMRI studies have found BOLD signal changes in DMN (27,89) with differences in the strength and pattern between TLE and extra-TLE (27,89). DMN BOLD changes are also common to patients with IGE (64–68). These studies, across focal and IGE, point predominantly to a decrease of BOLD signal in DMN during epileptic transients.
A recent study (90) has provided relevant insights about the electrophysiological correlates of this phenomena: a decrease of gamma power and increase of lower frequencies, occurs synchro-nously with interictal activity in the main nodes of DMN when recorded with icEEG. This may explain the negative change in BOLD signal found in these areas coupled with epileptic activ-ity, and confirms that the coupling between the BOLD and EEG signals remains intact (91).
Although there have been many studies finding DMN alter-ations in epilepsy there remains large gaps in our understanding of the interaction between the epileptogenic network and the DMN. Interestingly, a study using effective connectivity (30) showed that this response in the precuneus was predictive of changes within the thalamo-cortical regions. This is consistent with the idea that conscious attention (indexed by the precuneus) modulates the connectivity of the thalamo-cortical loop and can therefore alter the probability of GSW generation.
Resting state fMRI studies have extensively investigated DMN and have consistently reported abnormal connectivity within the DMN and between the DMN and epileptogenic regions in focal epilepsies (92–98) and IGE (49,50,85,92,99–102). The most common finding is a decrease in the connectivity within DMN and between the epileptogenic regions with DMN. However, there are also some reports of increased connectivity in certain nodes like the precuneus (50,85).
The correlation between the DMN and functioning of other cognitive networks in fMRI (103) and its proven strong corre-lation with the epileptic activity points toward the need to test cognitive networks abnormalities in epileptic patients in light of the EEG information.
ALTERED GLOBAL BRAIN CONNECTIVITY
Mathematical tools to derive global network organization such as graph theory have been applied to fMRI (and more rarely EEG) data to identify abnormalities in patients with epilepsy. In this section, we will discuss the changes in global network organization found in patients with epilepsy (Table 3).
Graph theory based analysis has shown that brain networks in patients with epilepsy follow a small world type topology, similar to healthy subjects. However, significant differences in the parame-ters that define the small world connectivity have been detected in comparison to controls: patients with focal epilepsy have an increased modularity and interhemispheric connections (104) as well as abnormal degree, strength closeness, clustering coefficient, and betweenness centrality (105). Liao et al. (95) showed these
Centeno and Carmic hael F unctional connectivit y in epilepsy
Table 2 | Resting state studies in epilepsy reporting abnormalities of cognitive networks.
Syndr. ROI Connectivity findings Method Analysis N Effect spikes Correlations Reference Decrease Increase Other
IGE Self-referential, somatosensory, visual auditory DMN (frontopolar/parietal) DMN (precuneus) ICA P vs. CTR Correlation disease duration 16 P 16 CTR No Disease duration correlates with medial prefrontal cortex changes in connectivity
Wang et al. (85)
TLE left Language network
Language networks ICA P vs. CTR 17 P
30 CTR No Waites et al. (81) TLE+HS Auditory Sensorimotor Visual networks Auditory/sensorimotor Between visual ntw and mTL
Visual cortex ICA P vs. CTR
Correlation with clinical factors 33 P 33 CTR No Epilepsy duration correlate negatively with connectivity Zhang et al. (82) TLE+HS Dorsal attentional network Dorsal attentional network ICA P vs. CTR Correlation with cognitive scores 24 P 24 CTR No Working memory scores correlate with connectivity in attention network Zhang et al. (83) IGE 18 ROI in attention network Within attention network and adjacent areas Seed ROI P vs. CTR 14 P 14 CTR No Disease duration correlates with abnormal connectivity in frontal areas Maneshi et al. (84) TLE Precuneus Frontopolar DMN Hippocampus Left TLE to different regions Abnormalities are epilepsy side specific Seed ROI P vs. CTR 23 P 13 CTR No Haneef et al. (96) mTLE Precuneus Frontopolar
Hippocampus Seed ROI P vs. CTR
Correlation with DTI 20 P 20 CTR No Correlates fc of precuneus to mTL with DTI Liao et al. (119) Focal DMN, in particular Precuneus/parietal ICA P vs. CTR Correlation with clinical factors 11 P 11 CTR No No correlation with clinical factors Widjaja et al. (98) mTLE+HS DMN ICA P vs. CTR Correlation with clinical factors 52 P 29 CTR No Decrease connectivity in mTL structures correlate with duration
Zhang et al. (94) (Continued) www .fr ontiersin.or g J uly 20 1 4 |V olume 5 | Article 93 | 1 1
Centeno and Carmic hael F unctional connectivit y in epilepsy Table 2 | Continued
Syndr. ROI Connectivity findings Method Analysis N Effect spikes Correlations Reference Decrease Increase Other
TLE RSN ICA P vs. CTR Interictal vs. non-interictal activity 21 P 21 CTR Yes (deferred EEG) P with IED vs. no IED Correlation with interictal activity Mankinen et al. (97) Focal/IGE Precuneus Less connected in generalized epilepsies ICA P vs. CTR Generalized vs. focal epilepsy 28 P 34 CTR No Lui et al. (92) mTLE DMN Basal ganglia Limbic structures Global c.-ALFF P vs. CTR Subgroup analysis 6 P with interictal activity. Correlation of interictal spikes with ALFF 50 P 25 CTR
Yes Zhang et al.
(93) IGE Anterior cingulate Precuneus Prefrontal Precuneus Seed ROI P vs. CTR 15 P 15 CTR No Correlation with epilepsy duration (increased connectivity PFC with parahipp and decreased connectivity PFC/PCC)
McGill et al. (99)
IGE (CAE) Bilateral dorsal prefrontal cortex Precuneus Anterior cingulate DMN Cognitive control network Affective network
Seed ROI Sessions GSW vs. sessions non-GSW
10 P Yes Correlation with
interictal activity
Yang et al. (100)
IGE Precuneus DMN Seed ROI P vs. CTR 12 P
14 CTR
Yes Fronto-parietal connectivity correlates negatively with epilepsy duration. No correlation with other clinical variables Luo et al. (101) (Continued) F rontiers in Neur olog y | Epilepsy J uly 20 1 4 |V olume 5 | Article 93 | 12
Centeno and Carmichael Functional connectivity in epilepsy T able 2 | Continued S yndr . R OI Connectivity findings Method Analysis N Ef fect spik es Cor relations Ref er ence Decr ease Incr ease Other F ocal/IGE P recuneus DMN in P with GTCS
Set functions model
F ocal ep with partial sz vs. GTCS vs. CTR 28 P 34 CTR No Lui et al. ( 92 ) IGE DMN ICA P dr ug resist ant vs. P dr ug responsiv e vs. CTR 60 P 38 CTR Y es Cor relates with dr ug resist ancy Ka y et al. ( 11 4 ) IGE DMN R OI/Graph t. P vs. CTR 1 4 P 29 CTR No Song et al. ( 1 02 ) F or eac h st udy , inf ormation is pro vided regarding the epileptic syndrome included in the st udy , the areas where connectivit y w as seeded from (R OI), in case of those st udies using this approac h; the main findings subdivided in increases and decreases of connectivit y, and whether the ef fect of the spik es w as addressed in the st udy (ef fect of spik es), as w ell as the cor relations of the findings with clinical dat a if an y. S ynd., epileptic syndrome; Seed R OI, region of interest used as the connectivit y seed; P, patients; CTR, controls; F ocal, focal epilepsies; TLE, temporal lobe epilepsy; mTLE, medial TLE; HS , hIPPOCAMP AL sclerosis; IGE, idiopathic generaliz ed epilepsies; CAE, childhood absence epilepsy; IDE, interict al epileptif orm disc harges; Global c., global brain connectivit y; Graph t., graph theor y; R eHo, regional homogeneit y; ALFF , amplit ude of lo w -frequency fluct uations.
abnormalities were more marked in the epileptogenic networks and DMN of patients with TLE. In IGE, increased integration and nodularity in the cortico-subcortical network and decrease degree and nodularity of DMN nodes have been reported (102,105).
Using global connectivity asymmetry and interhemispheric coherence as measures, patients with focal and generalized epilepsy, showed higher global asymmetry and lower interhemi-spheric coherence compared to controls. These abnormalities were more prominent in the temporal and limbic networks across both focal and IGE patients (11).
The clinical meaning of these findings is uncertain and only a few studies have included correlations with some clinical aspects of epilepsy such as disease duration (54,106).
The majority of the studies applying graph theoretical analy-sis or voxel-wise analyanaly-sis primarily set out to find differential characteristics that correctly classify patients with epilepsy from healthy control groups. Although this approach may be useful in other neurological conditions such as Alzheimer’s (107), where presymptomatic diagnosis is important, the clinical applicability is unclear in epilepsy where diagnosis is based on the occurrence of spontaneous seizures and the prediction of populations at risk remains speculative.
One of the aspects that need to be explored is the effect that the transient epileptic activity may have on these network properties, which has not yet been address by any of the studies and will pro-vide useful information on the relation of these measures and the physiopathology of the disease. Further work is required to deter-mine if these RS-fMRI measures can become a useful biomarker of disease progression (beyond potentially simply indexing interictal event rate) and therefore help to measure therapeutic efficacy or predict treatment response.
ROLE OF INTERICTAL ACTIVITY IN RS-fMRI
The effect of epileptiform activity on the networks abnormali-ties described in RS-fMRI studies has been largely neglected. Only a few RS-fMRI studies have included EEG information in their analysis. The most common approach has been to use the EEG to exclude the presence of interictal activity during RS-fMRI. In the absence of interictal activity on scalp EEG, Pittau et al. (42) found decreased connectivity within the DMN and in the epilep-togenic network of TLE patients and similar findings have been seen in patients with IGE (49,50). Mankinen et al. (97) reported similar findings on those patients whose EEG acquired previously to scan was showing no interictal activity, however an important limitation of this study is that presence of epileptiform activity during the scanning session cannot be ruled out due to its inter-mittent nature and change in prevalence in certain states (i.e., when drowsy).
Conversely, where a direct comparison between RS-fMRI ses-sions with and without the occurrence of spikes has been made have shown that the network abnormalities reported are more marked during the occurrence of interictal activity. In IGE, increased connectivity of epileptogenic network involving basal ganglia and decreased connectivity in DMN (101), cognitive con-trol network (CCN) and affective network (AN) (100) were greater during those sessions with occurrence of GSW compared to those without.
Centeno and Carmic hael F unctional connectivit y in epilepsy
Table 3 | Resting state studies in epilepsy reporting abnormalities of global brain connectivity.
Syndr. ROI Connectivity findings Method Analysis N Effect spikes Correlations Reference Decrease Increase Other
FLE Global brain connectivity
Long range connections Interhemispheric connections Increased modularity in patients Global c.-Graph t. P vs. CTR Correlation 37 P 41 CTR No Increased modularity correlates with worse cognition
Vaessen et al. (104)
mTLE Global brain connectivity
No specific networks Classification
of network characteristics lead to diagnostic accuracy of 77% Global c.-Graph t. P vs. CTR 16 P 52 CTR No Zhang et al. (105)
Focal/IGE Global brain connectivity Interhemispheric coherence Global asymmetry (temporal and limbic networks) Global c.-Asymmetry Integration P vs. CTR 100P 80 CTR No Zhang et al. (11)
IGE Global brain connectivity
Cortical and subcortical structures Global c.-ReHo P vs. CTR 25 P 25 CTR No ReHo in thalamus/insula and DMN correlated with duration of epilepsy Zhong et al. (54)
IGE Global brain connectivity Nodal topological characteristics DMN Nodal topological characteristics mesial frontal cortex, putamen, thalamus amygdala Global c.-Graph t. P vs. CTR Structural connectivity vs. functional connectivity 26 P 26 CTR No Decoupling between structural and functional connectivity correlates with epilepsy duration
Zhang et al. (106)
For each study, information is provided regarding the epileptic syndrome included in the study, the areas where connectivity was seeded from (ROI), in those studies using this approach; the main findings subdivided in increases and decreases of connectivity, and whether the effect of the spikes was addressed in the study (effect of spikes), as well as the correlations if any of the findings with clinical data.
Synd., epileptic syndrome; Seed ROI, region of interest used as the connectivity seed; P, patients; CTR, controls; Focal, focal epilepsies; TLE, temporal lobe epilepsy; mTLE, medial TLE; HS, hippocampal sclerosis; IGE, idiopathic generalized epilepsies; CAE, childhood absence epilepsy; IDE, interictal epileptiform discharges; Global c., global brain connectivity; Graph t., graph theory; ReHo, regional homogeneity; ALFF, amplitude of low-frequency fluctuations
F rontiers in Neur olog y | Epilepsy J uly 20 1 4 |V olume 5 | Article 93 | 14
Centeno and Carmichael Functional connectivity in epilepsy
Mankinen et al. (47) showed that ReHo abnormalities have a different distribution depending on the presence/absence of inter-ictal activity on EEG acquired prior to the fMRI. Moeller et al. (53) and Rodionov (108) found that ICA can identify a compo-nent that spatially correlates with the cortico-subcortical network that is temporally correlated with epileptic transients.
There is only one RS-fMRI study where the correlation between interictal EEG activity and brain connectivity abnormalities was quantified (93). Using amplitude of low frequency oscillations (ALFF) as measure of resting connectivity in a subgroup of six patients with mTLE; increased connectivity was measured within mesial temporal lobe networks of patients, which correlated with the number of interictal events. This suggests that interictal activity was likely to be largely responsible for the network abnormalities observed.
There are two main challenges when approaching the integra-tion of EEG informaintegra-tion (i.e., epileptic activity) in fMRI con-nectivity analysis. The first limitation is scalp EEG’s sensitivity to capture epileptiform abnormalities; icEEG recordings show that only a portion of the epileptiform activity is captured by scalp EEG. This limitation needs to be taken into account in those studies that describe connectivity changes in the absence of epilep-tic activity monitored by scalp EEG. Acquisition of simultaneous icEEG–fMRI offers one possible solution to this sensitivity limita-tion (109,110) while the extraction of scalp EEG information not visually identifiable remains another (111). The second limitation is to define the concept of abnormality in the EEG of patients with epilepsy. The classical definition of epileptiform abnormalities, useful from the clinical point of view, constrains EEG modeling to a number of abnormal features whereas EEG (and MEG) research is providing new insights into different ways of exploring and defin-ing EEG background activity (112) and its relation to RS-fMRI derived networks (113).
Abnormalities in brain networks are likely to be present in epilepsy without visible epileptiform activity in scalp EEG as evidenced by structural connectivity changes (106,114) but to dif-ferentiate the more permanent and transient connectivity changes might have implications; for example in understanding how treat-ment of the transient epileptic events might reverse their cognitive impact.
In general, to understand the sequelae of altered brain connec-tivity in terms of cognition and seizure likelihood, both clinically important questions, we need to disambiguate and understand the effect of brain network alterations occurring over different timescales; millisecond changes related to IEDs, tens of seconds as measured by RS-fMRI and permanent changes (e.g., measured using diffusion tensor imaging). EEG–fMRI therefore has a role to play in the functional connectivity changes occurring in the milliseconds – tens of seconds domain.
DISCUSSION AND CONCLUSION
WHAT HAVE WE LEARNT FROM RS-fMRI AND EEG–fMRI STUDIES?
Resting state fMRI studies in epilepsy have derived information with regards to network dysfunction within and across epilepsy syndromes. In both, focal and generalized epileptic syndromes abnormalities are seen in large-scale networks usually involving more than one lobe, and with bilateral distribution. Some of the
network abnormalities have common features like the disruption of DMN and the thalamo-cortical patterns seen across syndromes with spike and wave discharges (seeTables 1–3). These findings are consistent with EEG–fMRI studies, primarily modeling fMRI changes to interictal events which have also shown large-scale works associated with epileptic activity, including changes in net-works such as the DMN. However, open questions remain regard-ing how the RS network changes found correlate to key aspects of epilepsy such as seizure and IED generation, response to treatment (pharmacological and surgical) and cognitive dysfunction.
The strength of combined EEG–fMRI lies in the ability to define brain state and add a different range of temporal scales for assess-ment of dynamic changes in network activity. This allows for the identification and separation of pathologic features and their characterization.
EEG–fMRI has had some level of validation as a pre-surgical assessment tool; however it is likely to be useful in a subset of patients and requires specialist equipment and knowledge, limit-ing its availability to major epilepsy centers. RS-fMRI has relatively little evidence of clinical utility in pre-surgical assessment, where it needs to be predictive or diagnostic in terms of localization in individuals to have clinical impact.
FUTURE DIRECTIONS
We propose the integration of both methods as the forward step to link the abnormalities of network connectivity to the pathophysiological phenomena of the disease.
Figure 1 summarizes the questions and hypothesis derived from this review. Given the episodic nature of epileptic activ-ity, it seems appropriate to represent functional connectivity as a dynamic trajectory through a connectivity space with time (Figure 1A). Connectivity, as indexed by fMRI correlations between regions will depend on brain state: during cognitive tasks, we expect a higher connectivity if the nodes are involved in that task (A-1 pale green area), lower connectivity if they are not (A-1, green area), and a small variability in connectivity given that cogni-tive processes, typically require functional segregation. In contrast, at rest, mean connectivity of that same network will be expected to be significantly different and have greater variability due to the relatively unconstrained nature of the resting state (A-2). In the case of patients with epilepsy, there is an additional component that has been found to induce changes in connectivity: epileptic transients (A-3). Meanwhile, resting state studies have determined that the mean connectivity of patients with epilepsy is abnormal, the contribution of transients to these findings is yet to be properly characterized.
In our view, the understanding of the effect of connectivity changes associated with epileptic transients on the overall RS con-nectivity is crucial for interpreting the findings of RS-fMRI studies to date and to understand the interaction between RS-fMRI net-works in epileptic processes or cognitive co-morbidities. Current RS-fMRI studies capture connectivity changes as an average over time showing differences from controls (Figure 1B: where patient’s connectivity is represented by yellow area and controls in blue).
Epileptic transient’s rate and seizure activity may be modulated by a number of factors that occur over different timescales: from treatment to cognitive activity or external/internal factors such as
Centeno and Carmichael Functional connectivity in epilepsy
hormones, sleep, or sensory stimulation. This might be because they cause changes in brain connectivity that takes them toward or away from network connectivity configuration that are associ-ated with epileptic states (represented by the red area). One clear example is reflex epilepsies, where changes in the network involved in reading precede the seizure onset as measured by EEG–fMRI in a case with reading epilepsy (76).
To understand the effect on resting state networks of any factor of interest that interacts with epileptic transients we need to first understand their role in the global RS connectivity in epilepsy.
Taking as an example drug treatment response, we can hypoth-esize a change in RS connectivity based on the modification of epileptic transients due to treatment (Figure 1C): progressive decrease in epileptic activity may result in network connectivity taking values that fall outside the “epileptic transient connectivity zone” and in turn that are more similar to controls connectivity. The characterization of these changes may allow RS-fMRI results to be used as a marker of relevant aspects of the disease at differ-ent time scales: such as response to treatmdiffer-ent, cognitive effects of epilepsy, transition between interictal and ictal states, or chronic effects of disease progression.
Resting state fMRI and connectivity analysis is a fast developing field of research and is therefore set to benefit from substan-tial methodological advances with faster data acquisition, reduced artifacts and improved and better validated analysis procedures.
Future work needs to ground results in clinically observed fea-tures such as the change in epileptiform activity, or seizure rates over different timescales, e.g., with different levels of attention, in different sleep states, or over months or years of disease progres-sion. Therefore, allowing us to better understand how changes in brain networks occurring over different timescales contribute to the clinical manifestations of epilepsy and their control. While RS-fMRI provides an important non-invasive tool to evaluate network structure in epilepsy the addition of EEG recording should allow for better inference regarding the dynamic changes occurring at multiple timescales in epilepsy.
ACKNOWLEDGMENTS
Maria Centeno is funded by action Medical research grant num-ber SP4646. This work was supported by the National Institute of Health Research Great Ormond Street Hospital Biomedical Research Centre. This review was stimulated by discussion in a workshop organized by Prof. Yu-Feng Zhang.
REFERENCES
1. Gloor P. Generalized cortico-reticular epilepsies. Some considerations on the pathophysiology of generalized bilaterally synchronous spike and wave dis-charge.Epilepsia(1968)9(3):249–63. doi:10.1111/j.1528-1157.1968.tb04624.x 2. Laufs H. Functional imaging of seizures and epilepsy: evolution from zones to networks.Curr Opin Neurol (2012) 25(2):194–200. doi:10.1097/WCO. 0b013e3283515db9
3. Halasz P. The concept of epileptic networks. Part 2.Ideggyogy Sz(2010)63(11– 12):377–84.
4. Halasz P. The concept of epileptic networks. Part 1.Ideggyogy Sz(2010)63(9– 10):293–303.
5. Spencer SS. Neural networks in human epilepsy: evidence of and implications for treatment.Epilepsia(2002)43(3):219–27. doi:10.1046/j.1528-1157.2002. 26901.x
6. Snyder AZ, Raichle ME. A brief history of the resting state: the Washing-ton University perspective.Neuroimage(2012)62(2):902–10. doi:10.1016/j. neuroimage.2012.01.044
7. Biswal B, Yetkin FZ, Haughton VM, Hyde JS. Functional connectivity in the motor cortex of resting human brain using echo-planar MRI.Magn Reson Med
(1995)34(4):537–41. doi:10.1002/mrm.1910340409
8. Fox MD, Snyder AZ, Vincent JL, Corbetta M, Van Essen DC, Raichle ME. The human brain is intrinsically organized into dynamic, anticorrelated functional networks.Proc Natl Acad Sci U S A(2005)102(27):9673–8. doi:10.1073/pnas. 0504136102
9. Smith SM, Miller KL, Salimi-Khorshidi G, Webster M, Beckmann CF, Nichols TE, et al. Network modelling methods for FMRI.Neuroimage(2011) 54(2):875–91. doi:10.1016/j.neuroimage.2010.08.063
10. Zang Y, Jiang T, Lu Y, He Y, Tian L. Regional homogeneity approach to fMRI data analysis.Neuroimage(2004)22(1):394–400. doi:10.1016/j.neuroimage. 2003.12.030
11. Zhang J, Cheng W, Wang Z, Zhang Z, Lu W, Lu G, et al. Pattern clas-sification of large-scale functional brain networks: identification of infor-mative neuroimaging markers for epilepsy.PLoS One(2012)7(5):e36733. doi:10.1371/journal.pone.0036733
12. McKeown MJ, Makeig S, Brown GG, Jung TP, Kindermann SS, Bell AJ, et al. Analysis of fMRI data by blind separation into independent spatial components.Hum Brain Mapp(1998)6(3):160–88. doi:10.1002/(SICI)1097-0193(1998)6:5/6<368::AID-HBM7>3.3.CO;2-5
13. Friston KJ, Dolan RJ. Computational and dynamic models in neuro-imaging.Neuroimage(2010)52(3):752–65. doi:10.1016/j.neuroimage.2009.12. 068
14. McIntosh AR, Gonzalez-Lima F. Structural modeling of functional neural path-ways mapped with 2-deoxyglucose: effects of acoustic startle habituation on the auditory system.Brain Res(1991)547(2):295–302. doi:10.1016/0006-8993(91) 90974-Z
15. Roebroeck A, Formisano E, Goebel R. Mapping directed influence over the brain using Granger causality and fMRI.Neuroimage(2005)25(1):230–42. doi:10.1016/j.neuroimage.2004.11.017
16. Bressler SL, Seth AK. Wiener-Granger causality: a well established
methodol-ogy.Neuroimage(2011)58(2):323–9. doi:10.1016/j.neuroimage.2010.02.059
17. Daunizeau J, David O, Stephan KE. Dynamic causal modelling: a critical review of the biophysical and statistical foundations.Neuroimage (2011) 58(2):312–22. doi:10.1016/j.neuroimage.2009.11.062
18. Friston K, Moran R, Seth AK. Analysing connectivity with Granger causal-ity and dynamic causal modelling.Curr Opin Neurobiol(2013)23(2):172–8. doi:10.1016/j.conb.2012.11.010
19. Friston K. Dynamic causal modeling and Granger causality comments on: the identification of interacting networks in the brain using fMRI: model selection, causality and deconvolution.Neuroimage(2011)58(2):303–5. doi:10.1016/j. neuroimage.2009.09.031 author reply 10-1,
20. Cole DM, Smith SM, Beckmann CF. Advances and pitfalls in the analysis and interpretation of resting-state FMRI data.Front Syst Neurosci(2010)4:8. doi:10.3389/fnsys.2010.00008
21. Rosenkranz K, Lemieux L. Present and future of simultaneous EEG-fMRI.
MAGMA(2010)23(5–6):309–16. doi:10.1007/s10334-009-0196-9
22. Gotman J, Pittau F. Combining EEG and fMRI in the study of epileptic dis-charges.Epilepsia(2011)52(Suppl 4):38–42. doi:10.1111/j.1528-1167.2011. 03151.x
23. Laufs H, Daunizeau J, Carmichael DW, Kleinschmidt A. Recent advances in recording electrophysiological data simultaneously with magnetic resonance imaging.Neuroimage(2008)40(2):515–28. doi:10.1016/j.neuroimage.2007.11. 039
24. Laufs H, Krakow K, Sterzer P, Eger E, Beyerle A, Salek-Haddadi A, et al. Elec-troencephalographic signatures of attentional and cognitive default modes in spontaneous brain activity fluctuations at rest.Proc Natl Acad Sci U S A(2003) 100(19):11053–8. doi:10.1073/pnas.1831638100
25. Moosmann M, Ritter P, Krastel I, Brink A, Thees S, Blankenburg F, et al. Cor-relates of alpha rhythm in functional magnetic resonance imaging and near infrared spectroscopy.Neuroimage(2003)20(1):145–58. doi:10.1016/S1053-8119(03)00344-6
26. Lemieux L, Salek-Haddadi A, Josephs O, Allen P, Toms N, Scott C, et al. Event-related fMRI with simultaneous and continuous EEG: description of