Automatic segmentation method of
pelvic floor levator hiatus in
ultrasound using a self-normalizing
neural network
Ester Bonmati
Yipeng Hu
Nikhil Sindhwani
Hans Peter Dietz
Jan D
’
hooge
Dean Barratt
Jan Deprest
Tom Vercauteren
Ester Bonmati, Yipeng Hu, Nikhil Sindhwani, Hans Peter Dietz, Jan D’hooge, Dean Barratt, Jan Deprest, Tom Vercauteren,“Automatic segmentation method of pelvic floor levator hiatus in ultrasound using a
self-Automatic segmentation method of pelvic floor
levator hiatus in ultrasound using a self-normalizing
neural network
Ester Bonmati,a,b,c,* Yipeng Hu,a,b,cNikhil Sindhwani,dHans Peter Dietz,eJan D’hooge,dDean Barratt,a,b,c
Jan Deprest,b,dand Tom Vercauterena,b,c,d
aUniversity College London, Centre for Medical Image Computing, London, United Kingdom
bUniversity College London, Wellcome/EPSRC Centre for Interventional and Surgical Sciences, London, United Kingdom cUniversity College London, Department of Medical Physics and Biomedical Engineering, London, United Kingdom
dUniversity Hospitals Leuven, Department of Development and Regeneration, Cluster Urogenital Surgery and Clinical Department of Obstetrics
and Gynaecology, KU Leuven, Leuven, Belgium
eSydney Medical School Nepean, Nepean Hospital, Penrith, Australia
Abstract. Segmentation of the levator hiatus in ultrasound allows the extraction of biometrics, which are of importance for pelvic floor disorder assessment. We present a fully automatic method using a convolutional neural network (CNN) to outline the levator hiatus in a two-dimensional image extracted from a three-dimen-sional ultrasound volume. In particular, our method uses a recently developed scaled exponential linear unit (SELU) as a nonlinear self-normalizing activation function, which for the first time has been applied in medical imaging with CNN. SELU has important advantages such as being parameter-free and mini-batch independent, which may help to overcome memory constraints during training. A dataset with 91 images from 35 patients during Valsalva, contraction, and rest, all labeled by three operators, is used for training and evaluation in a leave-one-patient-out cross validation. Results show a median Dice similarity coefficient of 0.90 with an inter-quartile range of 0.08, with equivalent performance to the three operators (with a Williams’index of 1.03), and outperforming a U-Net architecture without the need for batch normalization. We conclude that the proposed fully automatic method achieved equivalent accuracy in segmenting the pelvic floor levator hiatus compared to a previous semiautomatic approach.©The Authors. Published by SPIE under a Creative Commons Attribution 3.0 Unported License. Distribution or reproduction of this work in whole or in part requires full attribution of the original publication, including its DOI.[DOI:10.1117/1.JMI .5.2.021206]
Keywords: levator hiatus; automatic segmentation; self-normalizing neural network; ultrasound; convolutional neural network. Paper 17270SSRR received Sep. 15, 2017; accepted for publication Dec. 18, 2017; published online Jan. 10, 2018.
1
Introduction
Pelvic organ prolapse (POP) is the abnormal downward descent of pelvic organs, including the bladder, uterus, and/or the rectum or small bowel, through the genital hiatus, resulting in a protru-sion through the vagina. In a previous study, 27,342 women between the age of 50 and 79 years were examined and found that about 41% showed some degree of prolapsed.1
Ultrasound is at present the most widely used imaging modality to assess the anatomical integrity and function of pelvic floor because of availability and noninvasiveness. Since the levator hiatus is the portal through which POP must occur, its dimen-sions and appearance are measured and recorded during an ultra-sound exam. The hiatal dimensions have also been correlated with severity of prolapse, levator muscle avulsion, and even pro-lapse recurrence after surgery.2–4
During a transperineal ultrasound examination, three-dimen-sional (3-D) volumes are acquired during Valsalva maneuver (act of expiration while closing the airways after a full inspira-tion), at pelvic floor muscle contraction, and during rest. The hiatal dimensions and its area are then recorded by manually outlining the levator hiatus in the oblique axial two-dimensional
(2-D) plane at the level of minimal anterioposterior hiatal dimensions (referred to as the C-plane hereinafter).2
The main limitation of this technique is the high variability between operators in assessing the images and the operator time required. Sindhwani et al.5 earlier proposed a semiautomatic method to segment the levator hiatus in a predefined C-plane. To define the C-plane, their approach requires first the identifi-cation of two 3-D anatomical landmarks within the 3-D volume, the posterior aspect of the symphysis pubis (SP), and the ante-rior border of the pubovisceral muscle (PM), which are labeled manually. Then, the SP and PM are manually defined on the selected C-plane, and the system performs the outlining auto-matically. Although it is true that most of the times the SP and PM defined in the 3-D volume may correspond in the 2-D image, this is not always the case and may need to be corrected in the axial view. Therefore, Sindhwani et al.’s5method requires
identification of the two points in both images. Additionally, the contours in the C-plane rely on the manual addition of a third point and may require some additional manual adjustments. This method was shown to reduce interoperator variability in comparison to manual segmentation. Overall, despite interesting results, the procedure still lacks automation, limiting its repro-ducibility, and requires operator inputs and, consequently, time. Recently, convolutional neural networks (CNNs) have been shown to be able to successfully perform several tasks, such as *Address all correspondence to: Ester Bonmati, E-mail:[email protected]
classify, detect, or segment objects in the context of medical image analysis.6 Litjens et al.7 provide a good review on deep learning in medical image analysis. To segment medical images, different deep-learning approaches have been proposed in 2-D (e.g., left and right ventricles8and liver9) and 3-D (e.
g., brain tumour10and liver11) and have recently been extended to support interactive segmentation in both 2-D and 3-D.12,13In particular, using 2-D ultrasound images, CNN has been employed to successfully segment deep brain regions,14 the foetal abdomen,15thyroid nodule,16foetal left ventricle,17and
vessels18providing a fully automatic approach.
In this work, we propose a fully automatic method to seg-ment, in manually defined 2-D C-planes, the levator hiatus from ultrasound volumes thereby further automating the process of outlining the pelvic floor. In particular, we employ a self-nor-malizing neural network (SNN) using a recently developed scaled exponential linear unit (SELU) as a nonlinear activation function, with and without SELU-dropout,19showing competi-tive results compared to the equivalent network not using SELU. To the best of our knowledge, our work is the first attempt to combine SELU with CNN. SNNs have clear benefits in many medical imaging applications. These include the parameter-free and mini-batch independence nature of SNNs. In deep learning for medical imaging applications, memory constraints are fre-quently reached during training. Having opportunities to reduce the complexity of the network and being able to use a smaller mini-batch size (in contrast to batch normalization), without sac-rificing the generalization performance, are both crucial for many applications.
We train and evaluate the network using 91 C-plane ultra-sound images, from 35 patients, in a leave-one-patient-out cross validation. The dataset contains images at three different stages: full Valsalva, contraction, and rest. For each image, three labels from three different operators are available and are used for training and evaluation within the cross-validation experi-ment. Furthermore, we directly compare the results using U-Net-based architectures,20,21 a ResNet approach,22 and the
proposed network with and without SELU-dropout.
2
Method
2.1 Self-Normalizing Neural Networks for Ultrasound Segmentation
In this work, segmenting anatomical regions of interest in medi-cal images are posed as a joint classification problem for all image pixels using a CNN. Ultrasound images, which contain relatively sparse features that are depth- and orientation-depen-dent representation of the anatomy, pose a challenging task for traditional CNNs. Therefore, the appropriate regularization and robustness of the training may be important to successfully seg-ment ultrasound images. In recent years, rectified linear units (ReLU) have become thede factostandard nonlinear activation function for many CNN architectures due to its simplicity and provide partially constant, nonsaturating gradient, whereas batch normalization retains a similar importance by effectively reducing the internal variate shift and, therefore, regularizes and accelerates the network training.23However, the stochastic
gra-dient descent with relatively small data and mini-batch sizes (commonly found in medical image analysis applications) may significantly perturb the training so that the variance of the training error becomes large. This has also been reported by the training error curves from previous work.24This work
explores an alternative construction of the nonlinear activation function used in an SNN, a recent development suggesting to use a SELU function.19The proposed SELU constructs a
par-ticular form of parameter-free SELU so that the mapped vari-ance can be effectively normalized, i.e., by dampening the larger variances and accelerate the smaller ones. As a result, batch-dependent normalization may not be needed, which means that there is no mini-batch size limitation and networks should be able to obtain equivalent results with reduced memory constraints. The SELU activation function is defined as
EQ-TARGET;temp:intralink-;e001;326;642
SELUðxÞ ¼λ
xif x >0
αex−αifx≤0; (1)
where scaleλ¼1.0507andα¼1.6733(see Klambauer et al.19 for details on the derivation of these two parameters). This spe-cific form in Eq. (1) ensures the mapped variance by the SELU activation is effectively bounded19thereby leading to a
self-nor-malizing property.
2.2 Network Architecture
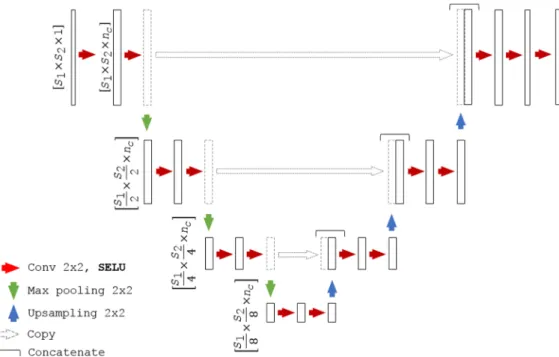
We adapt a U-Net architecture20,25as a baseline CNN to assess the segmentation algorithms. We refer to the proposed self-nor-malizing U-Net-based network as SU-Net hereinafter. The detailed network architecture is shown in Fig.1. Each block consists of two convolutions, with a kernel size of2×2, each followed by a SELU activation. Downsampling is achieved with a max-pooling with a kernel size of2×2and stride2×2, which halves the sizes of the feature maps preserving the number of channels, whereas upsampling doubles the feature map sizes and also preserving the number of channels. Upsampling is per-formed by a transposed convolution with a2×2stride. After each upsampling, the feature maps are concatenated with the last feature maps of the same size (before pooling). The last block contains an extra convolution and the corresponding SELU activation. As shown in Fig.2, all the batch normalization with ReLU blocks are replaced by a single SELU activation (described in Sec.2.1). For the case of SU-Net with drop-out, the dropout was applied after each convolution. SELU-dropout works with SELUs by randomly setting activations to the negative saturation value (in contrast to zero variance in ReLU), to keep the mean and variance. The weighted sum of an L2 regularization loss with of the probabilistic Dice score using label smoothing is used as a loss function.26,27 2.3 Networks Evaluation
Manually labeled ultrasound images, each of which are labeled by three individual operators, are available to train the networks. Our benchmark includes the proposed SU-Net using SELU (SU-Net), the SU-Net also using SELU-dropout (SU-Net + dropout), and a baseline U-Net using batch normalization and ReLU (U-Net) sharing the same architecture as the SU-Net (Fig.1). Other hyperparameters are kept fixed for all these archi-tectures. Additionally, similar to Vigneault et al.,25we also
com-pare the results with a U-Net in which the last layer convolutions are replaced by dilated convolutions (U-Net + DC) and with a ResNet architecture.22Hyperparameters used in the implemen-tation of the U-Net + DC and ResNet networks are described in Sec. 3.2. Evaluation is performed in a leave-one-patient-out cross validation, in which the networks are trained 35 times using data from 34 patients while the contours from the different
images of the left-out patient are used in testing. As a result, 91 automatic segmentations are obtained from the 35-fold valida-tion, corresponding to the size of the original dataset.
2.4 Metrics
Results are evaluated using two region-based measures, Dice similarity coefficient28and Jaccard coefficient,29and two dis-tance-based measures, symmetric Hausdorff distance and mean absolute distance (MAD). The choice of this comprehensive set of metrics aims to allow direct comparison with the results from a previous study using the same dataset.5 Additionally, we include two more region-based measures, the false positive Dice (FPD) and the false negative Dice (FND),30and one dis-tance-based measure, the symmetric mean absolute distance (SMAD), which is the symmetric version of MAD.
LetAandBbe the two binary images which correspond to two labeled levator hiatus, in our evaluation,Acorresponds to an automatic segmentation and B to a manual segmentation (ground truth), the Dice similarity coefficientDðA; BÞ ¼2jA∩ Bj∕ðjAj þ jBjÞexpresses the overlap or similarity between label
A and B. The Jaccard coefficient JðA; BÞ ¼ jA∩Bj∕jA∪Bj
provides an alternative, more conservative overlap measure between A and B. FPD¼2jA∩B¯j∕ðjAj þ jBjÞ and FND¼ 2jA¯ ∩Bj∕ðjAj þ jBjÞ, where A¯ refers to the complement of A
and B¯ to the complement of B, and can be used to quantify if the method is over- or undersegmenting, respectively.
LetX¼ fx1; x2; : : : ; xng and Y¼ fy1; y2; : : : ; yng be two finite 2-D point sets sufficiently sampled from the contours or boundaries of binary images A and B with sizes nx and
ny, respectively, the symmetric Hausdorff distance (H) finds the maximum distance between each point of a set to the closest point of the other set as follows: HðX; YÞ ¼
maxfmaxfjdðx; YÞjg;maxjdðy; XÞjg;∀x∈X;∀y∈Y, where
dðx; YÞ ¼minfkx−yikg; i¼ f1: : : nyg and kx−yik is the Euclidean distance between the 2-D point x and the i’th point ofY. This measure quantifies the maximum level of dis-agreement between two labels. The mean absolute distance, MADðX; YÞ ¼Pnx
i¼1jdðxi; YÞj∕nx, quantifies the averaged
level of agreement between contours X and Y by finding the averaged distance between all points of a set to the closest point of the other set. Note that, as previously mentioned, MAD is asymmetric; therefore, we also include the symmetric mean absolute distanceSMADðX; YÞ ¼nxþ1nyð
Pnx
i¼1jdðxi; Yj þ
Pny
i¼1jdðyi; XÞjÞ.
2.5 Statistical Comparative Analysis
Performance is quantified and compared by evaluating the com-puter-to-observer differences (COD) to determine the agreement between the automatic segmentation and the manual segmenta-tions. A pairwise comparison approach between each label obtained with the automatic method and the three labels avail-able for each image is performed by considering all the metrics described in Sec.2.4. Performance quantification is presented for all network architectures described. Furthermore, statistical analysis employing a paired two-sample student’st-test is used to test whether the differences in performance between SU-Net and U-Net, U-Net + DC, ResNet and SU-Net + dropout are sta-tistically significant different.
Fig. 2 (a) SU-Net architecture versus (b) U-Net architecture.
Fig. 1 Network architecture, whereS1andS2correspond to the spatial dimension andncto the number
of channels. For the U-Net, the SELU unit is replaced by batch normalization and ReLU, and for the U-Net with dilated convolution (U-Net + DC), the last layer is also replaced by a dilated convolution.
Using a similar pairwise approach, interobserver differences (IOD) are quantified to determine the agreement between manual segmentations from the three operators and to allow a further comparison with the automatic methods.
The extended Williams’index (WI) is a statistical test for numeric multivariate data to test the null hypothesis that the automatic method agrees with the three operators and that the three operators agree with each other.31,32This index
quan-tifies the ratio of agreement by calculating the number of times that the automatic boundaries are within the observer bounda-ries. If the 95% confidence interval (CI) of the WI contains the value 1.0, it implies that the test fails in rejecting the null hypothesis that the agreement between the automatic method and the three operators is not significantly different. We test the level of agreement between the automatic and manual seg-mentations based on the metrics defined in Sec.2.4.
2.6 Clinical Impact
The dimension of the levator hiatus on ultrasound is a biometric measurement used to assess the status of the levator hiatus and is associated both with symptoms and signs of prolapse as well as with recurrence after surgical treatment.2Therefore, we extend
the analysis to include the area measurement from the manual and automatic segmentations, to provide further clinical rel-evance in assessing the segmentation algorithms. Evaluation is performed by grouping the images in the three different stages: during rest, Valsalva, and contraction. WI is again used to test the level of agreement between the automatic and manual labels.
3
Experiments
3.1 Imaging
A dataset containing 91 ultrasound images, corresponding to the oblique axial plane at the level of minimal anteroposterior hiatal (C-plane), from 35 patients was used for validation.5 All C-planes were selected by the same operator. The dataset had 35 images acquired during Valsalva, 20 images during contrac-tion, and 36 images at rest to cover all the stages during a stan-dard diagnosis with some extreme cases and large anatomical variability. Images had a mean pixel size and standard devia-tion (SD) of 0.540.07 mm, with variable image sizes [ð199−286Þ×ð176−223Þ pixels, for width and length, respectively]. All 91 images were manually segmented by 3 dif-ferent operators with at least 6 months of experience in
evaluating pelvic floor 3-D ultrasound images. Each operator segmented each image only once. More details on the dataset can be found in the work of Sindhwani et al.5
3.2 Implementation Details
For the purpose of this study, all original US images were auto-matically cropped or padded to214×262 pixelsprimarily for normalization and removing unnecessary background. In train-ing, for the SU-Net and U-Net, we used a mini-batch size of 32 images, and we linearly resized the data to107×131 pixelsand used a data augmentation strategy by applying an affine trans-formation with 6 degrees-of-freedom. The number of channels was fixed to 64. For the SU-Net with SELU-dropout, a dropout rate of 0.5 was used. During training, the images and labels from the three operators were both shuffled before feeding into respective mini-batches. The networks were implemented in TensorFlow33 and trained with an Adam optimizer34 with a learning rate of 0.0001, on a desktop with a 24-GB NVIDIA Quadro P6000. For each automatic segmentation obtained, post-processing morphological operators to fill holes (i.e., flood fill of pixels that cannot be reached from the boundary of the image) and remove unconnected regions by selecting the region with the largest area were also applied. For the U-Net + DC and ResNet, we used a mini-batch size of 10, 128 initial channels, and a learning rate of 0.001 (all the rest of hyperparameters, pre-and postprocessing were kept the same).
4
Results
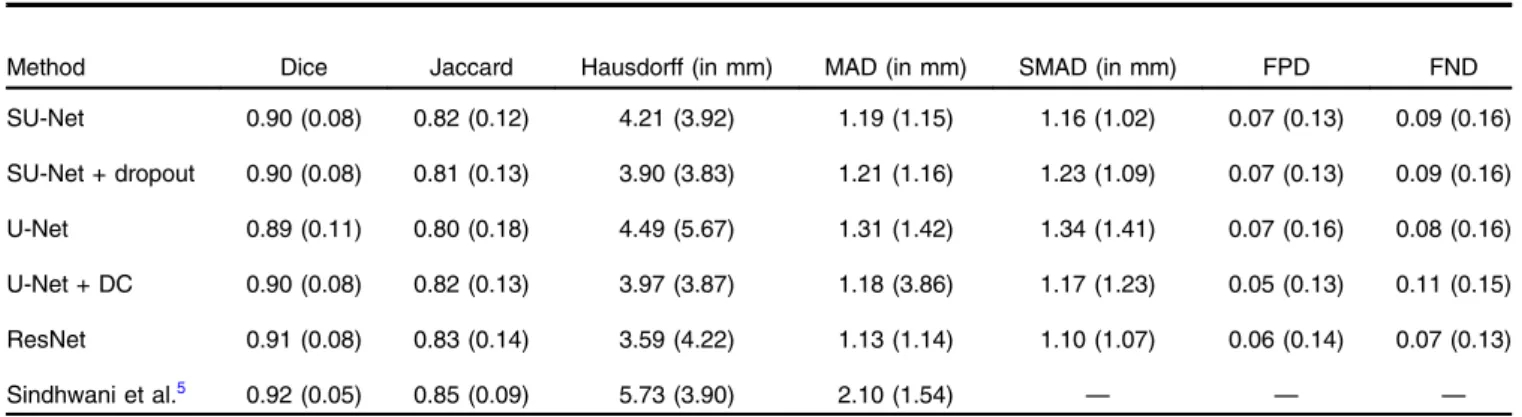
First, using the three manual labels available for each image as a ground truth, we evaluated the performance of the proposed network using the pairwise comparison strategy defined in Sec.2.5with the metrics described in Sec.2.4. For comparison purposes, we also report the results obtained with the baseline U-Net architecture, and the U-Net + DC and ResNet architec-tures. Median values and interquartile ranges for each metric are shown in Table1. Statistical analysis comparing the mean values for each image (average of the operators) obtained with the U-Net and the SU-U-Net showed a statistically significant difference for the Dice, Jaccard, Hausdorff, SMAD, and FPD metrics (p-values¼0.030, 0.022, 0.004, 0.027, and 0.031, respec-tively) and no significant difference for MAD and FND metrics (p-values¼0.064 and 0.183, respectively). However, when comparing the values of all metrics using SELU-dropout and without SELU-dropout, no statistically significant difference Table 1 Performance of the SU-Net, SU-Net + dropout, U-Net, U-Net + DC, and ResNet networks by employing a pairwise comparison with the three manual labels available for each ultrasound image. This table also contains results from a previous study (Sindhwani et al.5). Results are
reported using median (interquartile range).
Method Dice Jaccard Hausdorff (in mm) MAD (in mm) SMAD (in mm) FPD FND SU-Net 0.90 (0.08) 0.82 (0.12) 4.21 (3.92) 1.19 (1.15) 1.16 (1.02) 0.07 (0.13) 0.09 (0.16) SU-Net + dropout 0.90 (0.08) 0.81 (0.13) 3.90 (3.83) 1.21 (1.16) 1.23 (1.09) 0.07 (0.13) 0.09 (0.16) U-Net 0.89 (0.11) 0.80 (0.18) 4.49 (5.67) 1.31 (1.42) 1.34 (1.41) 0.07 (0.16) 0.08 (0.16) U-Net + DC 0.90 (0.08) 0.82 (0.13) 3.97 (3.87) 1.18 (3.86) 1.17 (1.23) 0.05 (0.13) 0.11 (0.15) ResNet 0.91 (0.08) 0.83 (0.14) 3.59 (4.22) 1.13 (1.14) 1.10 (1.07) 0.06 (0.14) 0.07 (0.13) Sindhwani et al.5 0.92 (0.05) 0.85 (0.09) 5.73 (3.90) 2.10 (1.54) — — —
was found (all p-values>0.37). Furthermore, no statistically significant difference was found when comparing the SU-Net and U-Net + DC (all p-values>0.30) or when comparing the SU-Net with ResNet (all p-values>0.08). Differences between the three operators (i.e., interoperator differences), not
considering the automatic segmentations, are reported using the same metrics and shown in Table2. WIs are reported in Table3
to compare the agreement between automatic and manual seg-mentations with the agreement among manual segseg-mentations using the metrics described in Sec.2.4.
Table4shows the mean differences in area of the segmented regions in terms of computer-to-operator differences and inter-operator differences during the three different stages and with the corresponding WIs testing the performances.
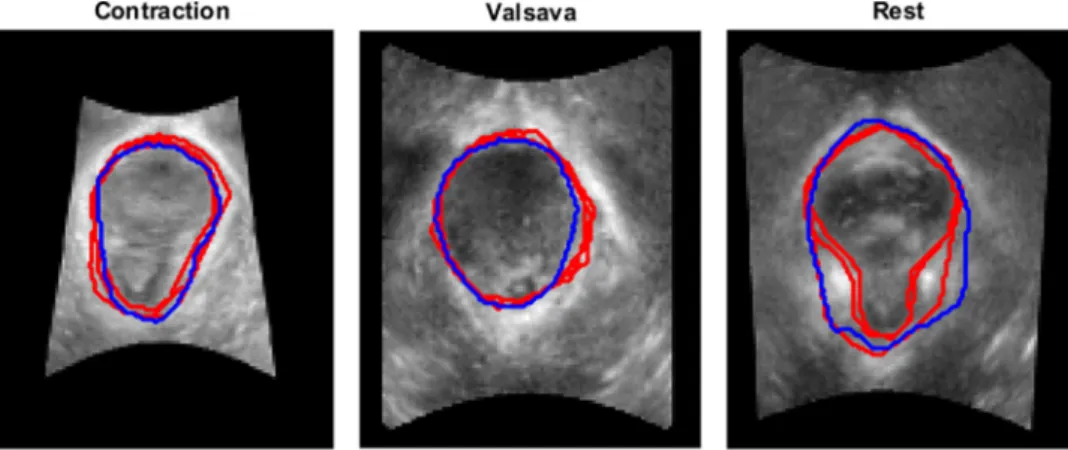
Figure3shows examples of original images with the corre-sponding segmentation results obtained with the automatic method together with the three manual labels used as a ground truth, and Fig.4shows examples at the three different stages: rest, Valsalva, and during contraction.
Figure5shows the histogram of the values obtained after the last SELU at different iterations. Figure6shows how the dice coefficient converges using the U-Net and SU-Net architectures, and Fig.7shows the learning curves of the training loss for the U-Net and SU-Net methods.
Table 2 Differences between the manual labels from the three operators (i.e., IOD). Results are reported using median (interquartile range). Dice Jaccard Hausdorff (in mm) MAD (in mm) SMAD (in mm) FPD FND 0.92 (0.06) 0.85 (0.10) 3.05 (2.33) 1.01 (0.85) 1.01 (0.81) 0.03 (0.08) 0.08 (0.15)
Table 3 WIs (95% CI) for the SU-Net, SU-Net + dropout, U-Net, U-Net + DC, and ResNet architectures for each evaluation metric. A CI containing the value 1.0 indicates a good agreement between the automatic method and the three operators.
Method WI Dice WI Jaccard
WI Hausdorff
(in mm) WI MAD (in mm) WI SMAD (in mm) WI FPD WI FND SU-Net 1.032 (1.03, 1.03) 1.052 (1.05, 1.06) 0.677 (0.67, 0.69) 0.738 (0.73, 0.75) 0.776 (0.77, 0.79) 0.425 (0.40, 0.45) 0.588 (0.57, 0.61) SU-Net + dropout 1.032 (1.03, 1.03) 1.051 (1.05, 1.05) 0.701 (0.69, 0.71) 0.751 (0.74, 0.76) 0.784 (0.77, 0.80) 0.420 (0.40, 0.44) 0.591 (0.57, 0.62) U-Net 1.085 (1.08, 1.09) 1.111 (1.10, 1.12) 0.530 (0.52, 0.54) 0.577 (0.56, 0.59) 0.538 (0.52, 0.56) 0.281 (0.26, 0.30) 0.439 (0.42, 0.46) U-Net + DC 1.033 (1.03, 1.04) 1.053 (1.05, 1.06) 0.712 (0.70, 0.72) 0.723 (0.71, 0.74) 0.756 (0.74, 0.77) 0.395 (0.37, 0.42) 0.706 (0.69, 0.72) ResNet 1.037 (1.03, 1.04) 1.061 (1.06, 1.07) 0.717 (0.71, 0.73) 0.726 (0.71, 0.74) 0.731 (0.72, 0.74) 0.533 (0.50, 0.57) 0.52 (0.5, 0.54)
Table 4 COD and IOD using SU-Net with the corresponding WIs and the 95% CI. Results are reported using mean (SD).
Stage Contraction Valsalva Rest COD 0.620.91 0.861.89 0.601.22 IOD 0.520.70 0.621.03 0.610.92 WI 0.80 0.72 0.85 (95% CI) (0.72, 0.89) (0.68, 0.76) (0.80, 0.90)
Fig. 3 Segmentation of the levator hiatus using with the SU-Net architecture (blue) compared with the three manual labels (red) for the following percentiles of the Dice coefficient: (a) 0th, (b) 25th, (c) 50th, (d) 75th, and (e) 100th.
5
Discussion
The task of segmenting ultrasound images can be challenging and often results in high variability between operators. In this work, we have presented a fully automatic method, using a CNN, to segment the pelvic floor levator hiatus on a 2-D image plane extracted from a 3-D ultrasound volume. A large
number of female patients may potentially benefit globally from this approach. We have adopted a recently proposed SNN, which for the first time has been applied in medical imaging to tackle a clinically important application, obtaining either superior or equivalent segmentation results compared to a num-ber of state-of the-art network architectures with clear additional benefits in terms of complexity and memory requirements. Furthermore, based on a set of rigorous statistical tests with real clinical image data, the proposed fully automatic method achieved an equivalent accurate segmentation result compared Fig. 4 Segmentation examples of the levator hiatus at the three different stages (contraction, Valsalva,
and rest) using the proposed method (blue) compared to the outlines provided by the operators (red). Cases were chosen at the 75th percentile of the mean Dice coefficient considering the three operators.
Fig. 5Histogram of the SELU activations at the last block after (a) 500, (b) 1000, (c) 1500, (d) 2000, (e) 2500, and (f) 3000 iterations.
Fig. 6 Overlap at different iterations (0 to 3000) for the U-Net (blue) and SU-Net (orange) architectures during testing for the first fold and for the three operators.
Fig. 7 Learning curves of the training loss for the U-Net (blue) and SU-Net (orange) architectures averaged for all folds at different iter-ations (0 to 3000).
to the only previous (semiautomated) study presented by Sindhwani et al.5
The state-of-the-art deep-learning architectures have been shown to perform well in the task of segmentation. To the best of our knowledge, this is the first work in medical imaging to replace the batch normalization with a SELU unit. SNN net-works are able to retain many layers with stable training, par-ticularly with a strong regularization that is advantageous for ultrasound image segmentation. Furthermore, using SELU has the opportunity of reducing the GPU memory requirement and relaxes the dependency of mini-batch.
We show that the method presented outperformed the U-Net-based architecture by considering region- and contour-U-Net-based metrics and confirmed by statistical tests. Although the effective difference, i.e., effect size, is relatively small and subject to fur-ther investigation in determining the clinical relevance, SELU may have provided a faster convergence (Figs. 6 and 7). Furthermore, although it is difficult to draw quantitative conclu-sion on the efficacy of the SELU units, the activation output distributions shown in Fig.5illustrate the desirably stable varia-tion during training.19On the other hand, no statistical significant difference was found when SELU-dropout, U-Net + DC, or ResNet was used. Therefore, SELU can potentially provide equiv-alent or improved results without the mini-batch size limitation. Comparing the COD (Table1) with interoperator differences (Table2), we show highly similar results on the median values, however, WIs CIs show that the automatic method strongly agrees with the observers in terms of Dice and Jaccard coeffi-cient with a value very close to 1, but it is not the case for the distance metrics. This result may be due to a disagreement on local parts of the boundaries as shown in Fig.3(c), which gives a higher Hausdorff distance value, or due to a larger part of the boundary in disagreement with the operators as shown in Fig.3(b), which results in a higher SMAD value.
As a clinically relevant metric, we evaluated the differences in area at three different stages (contraction, Valsalva, and rest). In this case, WIs were smaller than 1, showing some level of disagreement with the operators (Table 4). We believe that the results can be further improved by increasing the number of images during training, as the current dataset size is limited and contains some extreme cases with a high variability.
Compared to a previous study,5in which at least three
ana-tomical points have to be manually identified on the C-plane, we proposed a fully automatic segmentation algorithm that is able to segment the pelvic floor on the C-plane without operator input of any form, achieving comparable accuracy. Note that, the previous study already achieved competitive results obtaining a good agreement with the three operators (Tables1
and 2) and demonstrated to be clinically useful. Furthermore, compared to a solution that requires human interaction (i.e., manual definition of several anatomical landmarks), fully auto-matic methods, such as the one proposed in this work, have sig-nificant advantages, including minimizing subjective factors due to intra- and interobserver variations, simpler clinical workflow with minimal uncertainty and quantifiable, repeatable procedure outcome.
The limitation of this work, from a clinical application per-spective, is the need to identify the C-plane from a 3-D ultra-sound volume, which is currently done manually. We have focused on the task of automatically segmenting the pelvic floor on the C-plane mainly for three reasons: (1) the levator hiatus is a mostly flat structure and there is no envisaged clinical
benefit of performing a 3-D segmentation rather than a 2-D one in the C-plane; (2) validation of 2-D segmentation results in the same volume but on different C-planes is problematic as it requires comparison of manual contours on potentially different images; and (3) the proposed method is meant to be one step of a minimally interactive workflow for pelvic floor disorder analy-sis. The current work aims at demonstrating the performance of the proposed automatic method in a controlled problem domain (i.e., where the C-plane is provided), before pursuing more end-to-end solutions. After the successful development reported in this work, we plan to investigate the feasibility of implementing the complete analysis pipeline in which (a) the identification of the C-plane would be automated but potentially refined by the user; (b) the proposed automated deep-learning-based segmen-tation could be possibly manually refined using an approach similar to that of Wang et al.12,13but requiring less user-time than that of Sindhwani et al.;5and (c) an automated prediction
of clinically relevant measurements and decision support infor-mation would be performed based on the user-validated C-plane and levator hiatus.
6
Conclusion
In this work, we present a deep-learning method based on an SNN to automate the process of segmenting the pelvic floor levator hiatus in a 2-D plane extracted from an ultrasound vol-ume, which outperforms the equivalent U-Net architecture and foregoes the need for batch normalization. Compared to pre-vious work, this method is fully automatic with equivalent oper-ator performance in terms of Dice metrics.
Disclosures
The authors have no conflict of interest to declare. Acknowledgments
The authors would like to thank Dr. Friyan Tuyrel and Dr. Ixora Atan for providing the data and the manual ground truth labels used in this study. This work was supported by the Wellcome/ EPSRC (Nos. 203145Z/16/Z, WT101957, and NS/A000027/1) and the Royal Society (No. RG160569).
References
1. S. L. Hendrix et al.,“Pelvic organ prolapse in the women’s health ini-tiative: gravity and gravidity,”Am. J. Obstet. Gynecol.186(6), 1160– 1166 (2002).
2. H. P. Dietz, C. Shek, and B. Clarke,“Biometry of the pubovisceral muscle and levator hiatus by three-dimensional pelvic floor ultrasound,”
Ultrasound Obstet. Gynecol.25(6), 580–585 (2005).
3. Z. Abdool, K. L. Shek, and H. P. Dietz,“The effect of levator avulsion on hiatal dimension and function,”Am. J. Obstet. Gynecol.201(1), 89. e1–89.e5 (2009).
4. H. P. Dietz, V. Chantarasorn, and K. L. Shek,“Levator avulsion is a risk factor for cystocele recurrence,”Ultrasound Obstet. Gynecol.36(1), 76– 80 (2010).
5. N. Sindhwani et al., “Semi-automatic outlining of levator hiatus,”
Ultrasound Obstet. Gynecol.48(1), 98–105 (2016).
6. E. Gibson et al.,“NiftyNet: a deep-learning platform for medical im-aging,”arxiv.org/abs/1709.03485 (2017).
7. G. Litjens et al.,“A survey on deep learning in medical image analysis,”
Med. Image Anal.42, 60–88 (2017).
8. P. V. Tran,“A fully convolutional neural network for cardiac segmen-tation in short-axis MRI,”arxiv.org/abs/1604.00494 (2016). 9. W. Li et al.,“Automatic segmentation of liver tumor in CT images with
deep convolutional neural networks,”J. Comput. Commun.3(11), 146– 151 (2015).
10. K. Kamnitsas,“Efficient multi-scale 3D CNN with fully connected CRF for accurate brain lesion segmentation,”Med. Image Anal.36, 61–78 (2017).
11. F. Lu et al.,“Automatic 3D liver location and segmentation via convolu-tional neural network and graph cut,”Int. J. Comput. Assisted Radiol. Surg.12(2), 171–182 (2017).
12. G. Wang et al.,“Interactive medical image segmentation using deep learning with image-specific fine-tuning,” arxiv.org/abs/1710.04043 (2017).
13. G. Wang et al.,“DeepIGeoS: a deep interactive geodesic framework for medical image segmentation,”arxiv.org/abs/1707.00652 (2017). 14. F. Milletari et al.,“Hough-CNN: deep learning for segmentation of
deep brain regions in MRI and ultrasound,”arxiv.org/abs/1601.07014 (2016).
15. H. Ravishankar et al.,“Hybrid approach for automatic segmentation of fetal abdomen from ultrasound images using deep learning,”inIEEE 13th Int. Symp. on Biomedical Imaging (ISBI), pp. 779–782, IEEE (2016).
16. J. Ma et al.,“Ultrasound image-based thyroid nodule automatic seg-mentation using convolutional neural networks,” Int. J. Comput. Assisted Radiol. Surg.12, 1895–1910 (2017).
17. L. Yu et al.,“Segmentation of fetal left ventricle in echocardiographic sequences based on dynamic convolutional neural networks,” IEEE Trans. Biomed. Eng.64(8), 1886–1895 (2017).
18. E. Smistad and L. Løvstakken,“Vessel detection in ultrasound images using deep convolutional neural networks,”Lect. Notes Comput. Sci.
10008, 30–38 (2016).
19. G. Klambauer et al.,“Self-normalizing neural networks,”inAdvances in
Neural Information Processing Systems(2017).
20. O. Ronneberger, P. Fischer, and T. Brox,“U-Net: convolutional net-works for biomedical image segmentation,”arxiv.org/abs/1505.04597 (2015).
21. D. M. Vigneault et al.,“Feature tracking cardiac magnetic resonance via deep learning and spline optimization,” arxiv.org/abs/1704.03660 (2017).
22. W. Li et al.,“On the compactness, efficiency, and representation of 3D convolutional networks: brain parcellation as a pretext task,”Lect. Notes Comput. Sci.10265, 348–360 (2017).
23. S. Ioffe and C. Szegedy,“Batch normalization: accelerating deep net-work training by reducing internal covariate shift,” arxiv.org/abs/ 1502.03167 (2015).
24. D. Nouri and A. Rothberg,“Liver ultrasound tracking using a learned distance metric,” in Proc. MICCAI Workshop: Challenge on Liver
Ultrasound Tracking, pp. 5–12 (2015).
25. D. M. Vigneault et al.,“Feature tracking cardiac magnetic resonance via deep learning and spline optimization,”Lect. Notes Comput. Sci.10263, 183–194 (2017).
26. G. Pereyra et al.,“Regularizing neural networks by penalizing confident output distributions,”arxiv.org/abs/1701.06548 (2017).
27. F. Milletari, N. Navab, and S.-A. Ahmadi,“V-Net: fully convolutional neural networks for volumetric medical image segmentation,”arxiv.org/ abs/1606.04797 (2016).
28. L. R. Dice,“Measures of the amount of ecologic association between species,”Ecology26(3), 297–302 (1945).
29. P. Jaccard,“The distribution of the flora in the alpine zone,”New Phytol.
11(2), 37–50 (1912).
30. K. O. Babalola et al.,“An evaluation of four automatic methods of seg-menting the subcortical structures in the brain,”NeuroImage 47(4), 1435–1447 (2009).
31. V. Chalana and Y. Kim,“A methodology for evaluation of boundary detection algorithms on medical images,”IEEE Trans. Med. Imaging
16(5), 642–652 (1997).
32. G. W. Williams,“Comparing the joint agreement of several raters with another rater,”Biometrics32(3), 619–627 (1976).
33. M. Abadi et al.,“TensorFlow: large-scale machine learning on hetero-geneous distributed systems,”arxiv.org/abs/1603.04467 (2016). 34. D. P. Kingma and J. Ba,“Adam: a method for stochastic optimization,”
arxiv.org/abs/1412.6980 (2014).
Ester Bonmatiis a research associate at the University College London. She received her BSc, MSc, and PhD degrees from the University of Girona. Her current research interests include image-guided interventions, medical image processing, and surgical plan-ning and navigation.
Yipeng Huis a senior research associate at the University College London. He received his BEng degree from Sichuan University and his MSc and PhD degrees from the University College London. His current research interests include image-guided interventions and medical image computing.
Nikhil Sindhwaniis a technical product manager at Nobel Biocare, Belgium. He received his BTech degree from SASTRA University, his MS degree from the University of Illinois, and his PhD from KU Leuven.
Hans Peter Dietzis a professor and an obstetrician and gynecologist at the University of Sydney. He has more than 25 years of expertise in pelvic floor assessment and pelvic organ prolapse, being a pioneer in the field. His research interests include the effect of childbirth on the pelvic floor, diagnostic ultrasound imaging techniques in urogynecol-ogy, and the prevention and treatment of pelvic floor disorders.
Jan D’hooge is a professor in the Department of Cardiology, KU Leuven. He received his MS and his PhD degrees from KU Leuven. His current research interests include myocardial tissue characteriza-tion and strain imaging in combinacharacteriza-tion with cardiac patho-physiology.
Dean Barrattholds the position of reader in medical image computing at University College London. He received his undergraduate degree from Oxford University and his MSc and PhD degrees from the Imperial College London. His research interests include technologies to enable image-guided diagnosis and therapy, with a particular inter-est in multimodal image registration, image segmentation, computa-tional organ motion modeling, intervencomputa-tional ultrasound, and cancer.
Jan Deprestis a professor at KU Leuven, head of the Centre for Surgical Technologies, chair of the Department of Development and Regeneration, and head of Organ Systems. His current research interests include fetal and perinatal medicine and image-guided intra-uterine minimally invasive fetal diagnosis and therapy.
Tom Vercauterenis a senior lecturer in interventional imaging at the University College London and the deputy director for the Wellcome/ EPSRC Centre for Interventional and Surgical Sciences. He gradu-ated from Ecole Polytechnique, received his MSc degree from Columbia University, and his PhD from Inria and Ecole des Mines de Paris. His current research interests include medical image com-puting and interventional imaging devices.