Florida International University
FIU Digital Commons
FIU Electronic Theses and Dissertations University Graduate School
11-7-2017
Development of System-Based Methodology to
Support Ramp Metering Deployment Decisions
Homa FartashFlorida International University, [email protected]
DOI:10.25148/etd.FIDC006590
Follow this and additional works at:https://digitalcommons.fiu.edu/etd
Part of theCivil Engineering Commons, and theTransportation Engineering Commons
This work is brought to you for free and open access by the University Graduate School at FIU Digital Commons. It has been accepted for inclusion in FIU Electronic Theses and Dissertations by an authorized administrator of FIU Digital Commons. For more information, please [email protected].
Recommended Citation
Fartash, Homa, "Development of System-Based Methodology to Support Ramp Metering Deployment Decisions" (2017).FIU Electronic Theses and Dissertations. 3648.
FLORIDA INTERNATIONAL UNIVERSITY Miami, Florida
DEVELOPMENT OF SYSTEM-BASED METHODOLOGY TO SUPPORT RAMP METERING DEPLOYMENT DECISIONS
A dissertation submitted in partial fulfillment of the requirements for the degree of
DOCTOR OF PHILOSOPHY in CIVIL ENGINEERING by Homa Fartash 2018
ii
To: Dean John L. Volakis
College of Engineering and Computing
This dissertation, written by Homa Fartash, and entitled Development of System-Based Methodology to Support Ramp Metering Deployment Decisions, having been approved in respect to style and intellectual content, is referred to you for judgment.
We have read this dissertation and recommend that it be approved.
_______________________________________ Albert Gan _______________________________________ Xia Jin _______________________________________ Wensong Wu _______________________________________ L. David Shen _______________________________________ Yan Xiao _______________________________________ Priyanka Alluri _______________________________________ Mohammed Hadi, Major Professor Date of Defense: November 07, 2017
The dissertation of Homa Fartash is approved.
_______________________________________ Dean John L. Volakis College of Engineering and Computing
_______________________________________ Andrés G. Gil Vice President for Research and Economic Development
and Dean of the University Graduate School
iii
© Copyright 2018 by Homa Fartash All rights reserved.
iv DEDICATION
This dissertation is dedicated to my beloved husband, Mohammad Lavasani, for his unbounded support, and to my parents, Shokat and Mohammadreza, for their
v
ACKNOWLEDGMENTS
I would like to take this opportunity to acknowledge everyone who supported me during my Ph.D. study. First and foremost, I would like to express my sincere gratitude to my advisor Dr. Mohammed Hadi for his kindness, motivation, immense knowledge and most importantly, his trust in my work. He believed in me more than I believed in myself.
I am grateful to my committee members, Dr. Albert Gan, Dr. L. David Shen, Dr. Xia Jin, Dr. Wensong Wu, Dr. Yan Xiao and Dr. Priyanka Alluri for serving on my dissertation committee and for their insightful comments and encouragement.
I would like to express my deepest gratitude to my classmate, colleague, mentor, best friend and soulmate, my beloved husband, Dr. Mohammad Lavasani. He provided the greatest support one could ask for in all aspects of my life. His love and support made every hardship disappear. Words cannot express how grateful I am to my family, my parents and lovely brother, Hamidreza who dreamed for this day since I was a little girl. Thank you for all the love and sacrifices you have made for me to follow my dreams.
I am also grateful to my friends and colleagues Dr. Eazaz Sadeghvaziri, Mr. Seyedmirsajad Mokhtarimousavi and Mr. Md Asif Raihan for their support and encouragement.
I will forever be thankful to the entire FIU family for providing the opportunity for me to pursue my Ph.D. degree and making this challenging journey an enjoyable adventure.
vi
ABSTRACT OF THE DISSERTATION
DEVELOPMENT OF SYSTEM-BASED METHODOLOGY TO SUPPORT RAMP METERING DEPLOYMENT DECISIONS
by Homa Fartash
Florida International University, 2018 Miami, Florida
Professor Mohammed Hadi, Major Professor
Ramp metering is an effective management strategy, which helps to keep traffic density below the critical value, preventing breakdowns and thus maintaining the full capacity of the freeway. Warrants for ramp metering installation have been developed by a number of states around the nation. These warrants are generally simple and are based on the traffic, geometry, and safety conditions in the immediate vicinity of each ramp (local conditions). However, advanced applications of ramp metering utilize system-based metering algorithms that involve metering a number of on-ramps to address system bottleneck locations. These algorithms have been proven to perform better compared to local ramp metering algorithms. This has created a disconnection between existing agency metering warrants to install the meters and the subsequent management and operations of the ramp metering. Moreover, the existing local warrants only consider recurrent conditions to justify ramp metering installation with no consideration of the benefits of metering during non-recurrent events such as incidents and adverse weather.
vii
This dissertation proposed a methodology to identify the ramps to meter based on system-wide recurrent and non-recurrent traffic conditions. The methodology incorporates the stochastic nature of the demand and capacity and the impacts of incidents and weather using Monte Carlo simulation and a ramp selection procedure based on a linear programming formulation. The results of the Monte Carlo simulation are demand and capacity values that are used as inputs to the linear programming formulation to identify the ramps to be metered for each of the Monte Carlo experiments. This method allows the identification of the minimum number of ramps that need to be metered to keep the flows below capacities on the freeway mainline segment, while keeping the on-ramp queues from spilling back to the upstream arterial street segments. The methodology can be used in conjunction with the existing local warrants to identify the ramps that need to be metered. In addition, it can be used in benefit-cost analyses of ramp metering deployments and associated decisions, such as which ramps to meter and when to activate in real-time. The methodology is extended to address incidents and rainfall events, which result in non-recurrent congestion. For this purpose, the impacts of non-non-recurrent events on capacity and demand distributions are incorporated in the methodology.
viii
TABLE OF CONTENTS
CHAPTER PAGE
CHAPTER 1 INTRODUCTION ... 1
1.1 Problem Statement ... 4
1.2 Research Objectives and Scope ... 6
1.3 Dissertation Organization ... 7
CHAPTER 2 LITERATURE REVIEW ... 8
2.1 Ramp Metering Warrants ... 8
2.1.1 Manual on Uniform Traffic Control Devices (MUTCD) ... 8
2.1.2 Arizona ... 9 2.1.3 California ... 10 2.1.4 Colorado ... 11 2.1.5 Florida ... 12 2.1.6 Nevada ... 15 2.1.7 New York ... 18 2.1.8 Texas ... 19 2.1.9 Utah ... 20 2.1.10 Virginia ... 21 2.1.11 Wisconsin ... 22
2.1.12 Summary of Existing Warrants ... 23
2.2 Ramp Metering Strategies ... 25
2.2.1 Metering Rate Selection Mode ... 25
2.2.2 Metering Activation Strategies ... 26
2.2.3 Ramp Metering Extent and Associated Algorithms ... 26
2.2.3.1 Local Ramp Metering Algorithms ... 30
2.2.3.2 System-Wide Ramp Metering Algorithms ... 34
2.2.4 Useful Concepts from Metering Algorithms ... 47
2.3Additional Considerations for Ramp Metering ... 48
2.3.1 Incidents ... 48 2.3.2 Adverse Weather ... 50 2.3.3 Diversion ... 52 2.3.4 Vehicle Class ... 54 2.4Summary ... 54 CHAPTER 3 METHODOLOGY ... 56 3.1 Methodology Outline ... 56
3.2 Introduction of the Study Area and Required Data ... 57
3.2.1 Case Study ... 57
3.2.2 Traffic Data ... 58
3.2.3 Incident and Adverse Weather Data ... 59
3.3Assessment of the Need for Developing System-Based Methodology ... 59
ix
3.3.2 Selecting Ramps Based on System Bottlenecks ... 60
3.3.2.1 Stochastic Capacity Analysis ... 60
3.3.2.2 Selecting Ramps for Metering based on System Bottlenecks... 63
3.3.3 Comparison Based on Simulation ... 65
3.4Developed Methodology for Identification of Ramps for Metering ... 66
3.4.1 Off-Line Ramp Selection for Recurrent Conditions ... 70
3.4.1.1 Stochastic Demand Analysis ... 71
3.4.1.2 Generating Analysis Scenarios Using Monte Carlo Simulation .... 73
3.4.2 Off-Line Ramp Selection for Non-Recurrent Conditions ... 74
3.4.2.1 Incident Impact on Capacity ... 74
3.4.2.2 Incident Impact on Demands ... 75
3.4.2.3 Rainfall Impact on Capacity ... 76
3.4.3 Benefit-Cost Analysis for Ramp Metering Deployment ... 78
3.4.4 Real-Time Ramp Selection for Activation ... 79
3.5 Summary ... 82
CHAPTER 4RESULTS ... 84
4.1 Assessment of the Need to Develop System-Based Warrants ... 84
4.2Off-Line Ramp Selection for Recurrent and Non-Recurrent Conditions ... 92
4.2.1 Application of Monte Carlo Simulation... 93
4.2.2 Demand to Capacity Ratio Distributions Derived Based on Monte Carlo Results ... 93
4.2.3Determining the Number of Ramps to Meter ... 96
4.2.4Estimation of Ramp Queue Lengths ... 97
4.2.5Benefit-Cost Analysis of Ramp Metering Deployment ... 98
4.3 Real-Time Ramp Selection for Application ... 100
4.4 Summary ... 106
CHAPTER 5 CONCLUSIONS ... 109
5.1 Summary and Conclusions ... 109
5.2 Research Contributions ... 113
5.3 Study Limitations and Recommendations for Future Research ... 113
REFERENCES ... 115
x
LIST OF TABLES
TABLE PAGE
Table 2-1: UDOT Total Mainline and Ramp Volume Thresholds (TransCore, 2001) .... 20 Table 2-2: UDOT Ramp Volume Thresholds (TransCore, 2001) ... 21 Table 2-3: Summary of Ramp Metering Warrants for Traffic Criteria ... 24 Table 2-4: Comparison of Pre-Timed and Traffic Responsive Ramp Metering
Algorithms (Cambridge Systematics, 2001) ... 28 Table 2-5: Summary of Ramp Metering Algorithms (Atkins, 2013) ... 29 Table 2-6: Metering Algorithms Summary ... 46 Table 3-1: Remaining Capacity Ratio for Open Lanes after Closure due to Incident Occurrence (HCM, 2016) ... 75 Table 3-2: Estimated Diversion Rates due to Incident Occurrence (Hadi et al., 2013) .... 76 Table 3-3: Remaining Capacity Ratio for Rainfall (HCM, 2016) ... 77 Table 3-4: Diversion and Capacity Adjustment Coefficients for Non-Recurrent
Senarios on a 4-Lane Freeway Segment ... 77 Table 4-1: List of Warranted Ramp Metering Based on Existing Florida Warrants and System-Wide Consideration ... 86 Table 4-2: Delay Savings due to System Justified vs. Locally Justified Ramp Metering and the Associated Benefit-Cost Analysis ... 92 Table 4-3: Total Number of Ramps to Meter for Recurrent and Non-Recurrent
Conditions ... 96 Table 4-4: Cumulative Probability of Average Queue Length (Feet) for Recurrent and Non-Recurrent Conditions ... 98 Table 4-5: Delay Savings due to Ramp Metering with Recurrent and Non-Recurrent Conditions and the Associated Benefit-Cost Analysis ... 100 Table 4-6: Look-Up Table for Real-Time Activation of the Ramps ... 103 Table 4-7: Real-Time Activation Results for the Morning ... 104
xi
xii
LIST OF FIGURES
FIGURE PAGE
Figure 1-1: Schematic Illustration of Ramp Metering ... 1
Figure 1-2: Fundamental Flow-Density Diagram ... 2
Figure 2-1: FDOT Ramp Metering Warrants Flowchart (Gan et al., 2011) ... 14
Figure 2-2: NDOT Ramp Metering Warrants Analysis (Jacobs, 2013) ... 15
Figure 2-3: Ramp Metering Categories (Kristeleit, 2014) ... 25
Figure 2-4: Zone and Layer Structure in SZM (Elefteriadou et al., 2009) ... 38
Figure 2-5: Fuzzy Logic Ramp Metering Structure (Bogenberger et al., 2001) ... 44
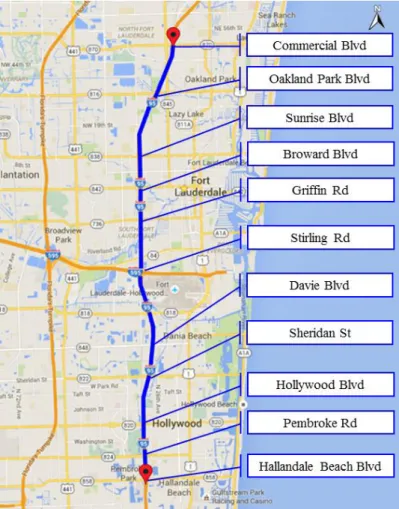
Figure 3-1: Study Area, I-95 Northbound in Broward County, Florida ... 58
Figure 3-2: Schematic Demonstration for the Variables of Linear Programming Formulation ………. ... 63
Figure 3-3: Main Steps of the Developed Methodology ... 70
Figure 3-4: Breakdown Probability Model for I-95 NB ramp from 103rd St. (Elefteriadou et al., 2009) ……. ... 80
Figure4-1: Stochastic Capacity Distribution for Bottleneck Location and VISSIM Calibration Results…….. ... 85
Figure 4-2: Speed Contours for Freeway Mainline (95th and 80th Percentile Capacity at the Bottleneck) ………. ... 87
Figure 4-3: Speed Contours for Freeway Mainline (50th and 30th Percentile Capacity at the Bottleneck) ………. ... 88
Figure 4-4: Travel Time on the Freeway Mainline with Different Percentiles of Bottleneck Capacity and Metering Scenarios ... 89
Figure 4-5: Travel Time on the On-ramps ... 91
Figure 4-6: Demand Distribution for the Morning and Afternoon Peaks ... 93 Figure 4-7: Cumulative Probability of the D/C Ratios for the Morning and Afternoon
xiii
Peaks during Recurrent Conditions ... 94 Figure 4-8: Simulated D/C Histogram for the Morning Peak during Recurrent
Conditions ... 95 Figure 4-9: Simulated D/C Histogram for the Afternoon Peak during Recurrent
Conditions ... 95 Figure 4-10: Historical Demand Distribution for the Morning Peak Period ... 101 Figure 4-11: Historical Demand Distribution for the Afternoon Peak Period ... 101
xiv
LIST OF ACRONYMS
AASHTO American Association of State Highway and Transportation Officials ACCEZZ Adaptive and Coordinated Control of Entrance Ramps with Fuzzy Logic
ADOT Arizona Department of Transportation
ALINEA Asservissement Linéaire d'Entrée Autoroutière
ARM Annual Reliability Matrix
BII Bottleneck Intensity Index
CBI Congestion and Bottleneck Identification
CCTV Closed-Circuit Television
CDOT Colorado Department of Transportation
DIVE Duration, Intensity, Variability, Extent
FDOT Florida Department of Transportation
FHWA Federal Highway Administration
FTI Florida Transportation Information
HCM Highway Capacity Manual
HOV High Occupancy Vehicle
ITE Institute of Transportation Engineers
ITS Intelligent Transportation Systems
LOS Level of Service
MnDOT Minnesota Department of Transportation
MPC Model Predictive Control
mph Miles per Hour
MUTCD Manual on Uniform Traffic Control Devices
xv
NDOT Nevada Department of Transportation
NYSDOT New York State Department of Transportation
pcphpl Passenger Cars per Hour per Lane
PLM Product Limit Method
RHMVM Rate per Hundred Million Vehicle-Miles
RITIS Regional Integrated Transportation Information System
SDRMS San Diego Ramp Metering System
SWARM System-Wide Area Ramp Metering
SZM Stratified Zone Metering
TMC Traffic Management Centers
TMUTCD Texas Manual on Uniform Traffic Control Devices
TTC Time to Collision
TTI Texas Transportation Institute
TxDOT Texas Department of Transportation
UDOT Utah Department of Transportation
USA United States of America
vph Vehicles per Hour
vphpl Vehicles per Hour per Lane
1
CHAPTER 1 INTRODUCTION
Recurrent congestion during the peak hours and non-recurrent congestion due to incidents, work zones, weather and special events significantly reduce the throughput and operating speed of freeways. Ramp metering is a ramp management strategy, which helps to keep the density below the critical value, preventing breakdown, and thus maintaining the full capacity of the freeway. Ramp metering regulates entering flow to freeway facilities by using traffic signals installed at on-ramps. As illustrated in Figure 1-1, once the ramp metering is activated, a ramp signal alternates between green and red to allow one or two entering vehicles (depending on the metering strategy) to merge into the freeway mainline traffic smoothly and safely (Balke et al., 2009). Basically, ramp meters aim to control the entering flow to the freeway, reduce freeway demand, and break up the entering platoons (Balke et al., 2009).
Figure 1-1: Schematic Illustration of Ramp Metering
In order to better understand the impacts of congestion on traffic operations and how ramp metering can reduce these impacts, it is necessary to reference the macroscopic traffic flow fundamental theory that relates the flow, density, and speed of the uninterrupted
2
flow on freeway facilities. Figure 1-2 illustrates a fundamental Flow-Density Diagram. As shown in this figure, when the traffic density (k), defined as the number of vehicles occupying a certain space (vehicle/mile/lane), reaches a critical value kc, the freeway flow reaches its maximum value of qmax; which is the segment capacity, as defined in the Highway Capacity Manual (HCM). Beyond this point, increasing freeway density due to increased demands leads to a reduction in traffic flow (throughput). When the density reaches its maximum possible value, referred to as jam density (kj), the traffic flow becomes zero and the traffic stops. If the density is lower than the critical value (k<kc), the flow is considered stable (uncongested). When the density exceeds the critical value (k>kc), the flow is considered unstable (congested) and the maximum possible throughput drops.
Figure 1-2: Fundamental Flow-Density Diagram
Ramp metering can help to keep the density as close as possible but below the critical density value to prevent the reduction in flow (throughput), and thus maintain the full capacity of the freeway. It is very important to select a proper metering rate. If the metering rate is too restrictive, the ramp queue spills back to the surface street while part of the freeway capacity may still be unused and indeed wasted. On the other hand, if the
3
metering rate is too permissive, the freeway congestion increases and the capacity drops as the traffic operates in the “unstable region” (Hasan, 1999).
Proper ramp metering can increase freeway throughput and travel speed, which leads to reductions in fuel consumption and emissions. Freeway safety can also be improved with the implementation of ramp metering by smoothing the merging traffic and reducing the stop-and-go patterns. The first ramp metering in the United States was implemented on the Eisenhower Expressway in Chicago in 1963. In Florida, the first ramp signal was installed on an I-95 section in Miami-Dade County in 2009 by the Florida Department of Transportation (FDOT), District Six (Gan et al., 2011).
The performance of ramp metering is highly affected by selecting the geographic extent and specific ramps to meter, ramp metering activation/deactivation, operation strategies, metering strategy and algorithm, metering parameters, queue management and signing (FHWA, 2006). These parameters have to be considered in the decision-making process of ramp metering planning, implementation, operations, and management.
Proper ramp metering can improve safety and mobility, in addition to improving the environmental conditions. A 5% to 37% reduction in crash potential was reported as a result of ramp metering (Gan et al., 2011). Ramp metering can also improve travel speed and throughput by decreasing the probability of traffic breakdown, improving travel time reliability, and diverting local traffic to the arterials for short trips (Shea et al., 2015). Reducing congestion also leads to reductions in fuel consumption and vehicle emissions. Overall, the benefits of ramp metering can be summarized as traffic throughput improvement, travel time and travel time reliability improvements, safety benefits, environmental benefits, and reduction in fuel consumption (Gan et al., 2011).
4
Despite all of the advantages of ramp metering, it may cause long queues on the ramps and spillbacks to upstream intersections. This needs to be addressed by metering rate adjustments. Moreover, the ramp metering may cause traffic diversion to parallel routes, which can result in congestion in the network. However, a successful metering approach can overcome these disadvantages by better selection of implementation parameters (Jacobs, 2013).
1.1 Problem Statement
Although the potential benefits of ramp metering are well recognized, it is crucial to select metering locations, the associated metering rates, and other metering parameters to realize and maximize these benefits (Hasan, 1999). Not all freeway sections can benefit from ramp metering, and the specific ramps to be metered will have to be selected carefully, both off-line and in real-time operations.
Ramp metering can cause long queues on the ramps, which may spill back to upstream intersections. Moreover, ramp metering causes diversion to parallel streets and alternative routes, which can create congestion problems if these routes do not have enough capacity to accommodate the diverted flow. Therefore, there is a need to determine the conditions under which ramp metering is justified to be implemented for improving traffic conditions. To accomplish this, transportation agencies have developed guidelines and warrants to support the decisions to implement ramp metering during the planning stage and procedures to activate/deactivate the meters in real-time operations. The real-time activation decisions have generally been made based on time of day combined with
5
decisions made by operators at traffic management centers based on their observations of the traffic conditions.
A summary of ramp metering installation warrants is presented in the review of the literature section. These existing warrants consider local conditions of the subject ramp and freeway mainline in the vicinity of the on-ramp merge area. However, the most advanced applications of ramp metering utilize system-based metering algorithms that involve metering a set of on-ramps to address a single system bottleneck location. These algorithms have been proven to perform better compared to the local ramp metering algorithm. This has created a disconnection between existing agency metering warrants based on local conditions and the subsequent operations of the ramp meters based on system bottleneck consideration.
Moreover, transportation system management and operation agencies have realized the need to activate metering during non-recurrent events like incidents and adverse weather conditions. Some of these agencies have assigned operators to activate ramp metering during non-recurrent conditions based on their observations of traffic conditions using closed circuit television (CCTV) cameras. Previous studies showed that non-recurrent conditions contribute significantly to the congestion and unreliability of the transportation system. However, the existing ramp metering warrants do not consider non-recurrent events as a contributing factor.
1.2 Research Objectives and Scope
As aforementioned, all of the existing metering warrants are based on local traffic conditions in the vicinity of the on-ramps. On the other hand, system-wide ramp metering
6
algorithms also consider traffic conditions in a broader area around the subject ramp that include downstream bottlenecks, as well as upstream and downstream ramps. This points to the need for developing additional methodology that considers system conditions to bridge the gap between the installation warrants at the planning stage and the actual operations of the meters. In addition, there is a need to provide methodologies to support real-time decisions to activate ramp metering.
This dissertation research focuses on developing methods that can be used in addition to local warrants for ramp metering installation in the planning stage and activation of real-time operations under recurrent and non-recurrent conditions. Such methods will need to be developed to prevent breakdowns at bottleneck locations and improve the performance measures of freeway segments beyond the local ramp locations. The objectives of this dissertation research are as follows:
1. To develop system-based methods under recurrent conditions for ramp metering
installation in the planning stage.
2. To extend the system-based methods to address non-recurrent conditions for ramp
metering installation in the planning stage.
3. To extend the off-line system-based method for real-time selection of the ramps for
activation.
A system is defined as a freeway section with multiple on-ramps and off-ramps.
1.3 Dissertation Organization
This document consists of four chapters. Chapter 2 summarizes the review of the existing literature for ramp metering warrants, as well as ramp metering strategies and
7
algorithms. Chapter 3 describes the proposed methodology for the objectives of the research. Chapter 4 presents the results for the implementation of the proposed methodology. Finally, Chapter 5 presents the summary and conclusions of this dissertation research.
8
CHAPTER 2 LITERATURE REVIEW
This chapter will first review the existing ramp metering warrants that have been used by agencies around the United States. It will then present a review of ramp metering strategies and the associated algorithms to allow better understanding of how the systems actually operate after the warrants have been implemented.
2.1 Ramp Metering Warrants
As previously mentioned, not all freeway sections can benefit from ramp metering despite its advantages as a traffic management strategy. Thus, there is a need to determine the conditions under which ramp metering may be suitable for improving traffic conditions. As a result, agencies have produced guidelines for the implementation of ramp metering. In the remainder of this section, warrants developed by different jurisdictions in the United States of America will be introduced.
2.1.1 Manual on Uniform Traffic Control Devices (MUTCD)
The 2003 version of the Manual on Uniform Traffic Control Devices (MUTCD, 2003) recommended the consideration of ramp metering implementation, if at least one of the following criteria is met:
1. “Congestion recurs on the freeway because traffic demand is in excess of the
capacity, or a high frequency of crashes exists at the freeway entrance because of an inadequate ramp merging area.” According to the MUTCD, a good indicator of recurring freeway congestion is a freeway operating speed less than 50 mph
9
occurring regularly for at least a half-hour period. Freeway operating speeds less than 30 mph for a half-hour period or more indicates severe congestion.
2. “Controlling traffic entering a freeway assists in meeting local transportation
system management objectives identified for freeway traffic flow, such as:
Maintenance of a specific freeway level of service.
Priority treatments with higher levels of service for mass transit and carpools.
Redistribution of freeway access demand to other on-ramps.”
3. “Predictable, sporadic congestion occurs on isolated sections of freeway because
of short period peak traffic loads from special events or from severe peak loads of recreational traffic.”
The latest edition of the MUTCD (2009) refers to the Federal Highway Administration’s (FHWA) Ramp Management and Control Handbook as the guideline for
ramp metering warrants and eliminates the abovementioned warrants (MUTCD, 2009). However, the FHWA’s handbook does not specify any quantitative criteria for considering
ramp metering and generally mentions safety, congestion, convenience, ramp capacity, ramp queues, access, and adjacent facility operations as the justifications to consider ramp
management strategies (FHWA, 2006).
2.1.2 Arizona
The Arizona Department of Transportation (ADOT) identified two ramp metering warrants that should be satisfied simultaneously to warrant the installation of ramp metering. In addition, the acceleration and ramp queue storage distance must be acceptable to recommend a ramp meter. The two warrants are (Simpson and Yasmin, 2013):
10
1. Freeway right lane and entrance ramp flow rate: During a typical 15-minute period,
the combined flow rate of the entrance ramp and the rightmost freeway lane is greater than 2,050 vehicles per hour (vph) and during the same period, the entrance ramp flow rate is greater than 400 vph.
2. During a typical 15-minute period, the speed of the freeway general purpose lanes
(not including HOV, auxiliary, and entrance ramp lanes) is less than 50 miles per hour (mph) due to recurring congestion adjacent to or within two miles downstream of the entrance ramp.
2.1.3 California
The California Ramp Meter Design Manual suggests considering “customization”
for each specific case when using any design advices or guidelines. Given this suggestion, the following warrants are recommended by this manual (Caltrans, 2000):
1. A single-lane ramp meter should be geometrically designed for volumes up to 900
vph. Where truck volumes (three axles or more) are 5% or greater on ascending entrance ramps to freeways with sustained upgrades exceeding 3% (at least throughout the merge area), a minimum 500 feet in length of the auxiliary lane should be provided beyond the ramp merge area. If the volume exceeds 900 vph and/or when a High Occupancy Vehicle (HOV) lane is determined to be necessary, a two- or three-lane ramp meter should be provided.
2. Freeway-to-freeway connectors may also be metered when warranted. The need to
11
3. The storage length for ramp meters have practical lower and upper output limits of
240 and 900 vph per lane, respectively. Ramp meter signals set for flow rates outside of this range tend to have high violation rates and cannot effectively control traffic. Therefore, on a ramp with peak-hour volume between 500 and 900 vph per lane, a two-lane ramp meter may be provided to double the available queue storage area on the ramp. A single-lane ramp meter should be used when the rate is below 500 vph and no HOV preferential lane is provided.
4. Ramp meter installations should operate in conjunction with and complement other
transportation management system elements and transportation modes. As such, ramp meter installations should include preferential treatment of carpools and transit riders. Specific treatment(s) must be tailored to the unique conditions at each ramp location; however, the standard or base treatment upon which other strategies are designed is the HOV preferential lane. An HOV preferential lane shall be provided at all ramp meter locations.
2.1.4 Colorado
The Colorado Department of Transportation (CDOT) considers three conditions for ramp metering to be warranted (Gaisser and DePinto, 2015):
1. The first condition is that the total of the upstream mainline volume and ramp
volume exceeding defined thresholds is as follows:
2,650 vph for two mainline lanes
4,250 vph for three mainline lanes
12
2. The second condition considers ramp volumes of up to 900 vph for single-lane
ramps and above 900 vph for two-lane ramps.
3. The third condition is descriptive and recommends field observation and experience
to justify ramp metering for the considered locations.
2.1.5 Florida
Seven warrants were developed in Florida that consider traffic operation, geometric and safety criteria. According to these warrants, ramp metering is warranted if the following conditions are met (Gan et al., 2011):
1. Mainline Volume: The average mainline volume during the peak hour is higher
than 1,200 vphpl.
2. Mainline Speed: The average mainline speed during the peak hour is below 50 mph.
3. Ramp Volume: Ramp metering is warranted when:
The peak hour on-ramp volume is between 240 vph and 1,200 vph for
single-lane ramps.
The peak hour on-ramp volume is between 400 vph and 1,700 vph for ramps
with multiple lanes.
4. Total Mainline and Ramp Volumes: Ramp metering is warranted when the total
mainline and ramp volume during the peak hour exceeds the following thresholds:
For two mainline lanes, the total volume is greater than 2,650 vph.
For three mainline lanes, the total volume is greater than 4,250 vph.
For four mainline lanes, the total volume is greater than 5,850 vph.
13
For six mainline lanes, the total volume is greater than 9,050 vph.
For more than six mainline lanes, the total volume is greater than 10,650 vph.
The number of lanes in the list above is for one direction, including auxiliary lane(s) that continue for at least 1/3 of a mile downstream from the ramp gore.
5. Peak Hour Volume for the Rightmost Lane: Ramp metering is also warranted when
the peak hour volume of the rightmost lane exceeds 2,050 vph.
6. Acceleration Distance: Ramp metering may be warranted where the acceleration
distance after the stop bar is greater than the required safe merging distance, as estimated by Equation 2-1:
𝐿 = 0.14 𝑉2+ 3 𝑉 + 9.21 (2-1)
where,
𝐿=required minimum acceleration distance (ft), and
𝑉=freeway mainline prevailing speed (mph).
7. Crash Rate: Ramp metering is warranted at a location where the facility or roadway
segment has a crash rate of over 80 crashes per hundred million vehicle miles (HMVM). The rate is calculated using Equation 2-2:
𝑅𝐻𝑀𝑉𝑀 =𝑁𝑢𝑚𝑏𝑒𝑟 𝑜𝑓 𝑐𝑟𝑎𝑠ℎ𝑒𝑠 𝑝𝑒𝑟 𝑦𝑒𝑎𝑟 × 100,000,000 𝐴𝐴𝐷𝑇 × 365 × 𝐷𝑖𝑠𝑡𝑎𝑛𝑐𝑒
where,
RHMVM = crash rate per hundred million vehicle-miles,
AADT = Average Annual Daily Traffic on the facility (vpd), and
Distance = length of roadway segment (mile).
14
The flowchart illustrated in Figure 2-1 presents the steps for applying the Florida warrants.
Figure 2-1: FDOT Ramp Metering Warrants Flowchart (Gan et al., 2011) > Minimum Storage
Length
> Minimum Acceleration Length Table 2-3
15
The warrants shaded in gray are mobility-related warrants. Mobility is the main consideration in this dissertation research.
2.1.6 Nevada
The Nevada Department of Transportation (NDOT) introduced nine warrants for ramp metering installation (Jacobs, 2013). Figure 2-2 illustrates NDOT’s application of these warrants.
16 These nine warrants are as follows:
1. Ramp Volume: The minimum ramp volume during the critical peak hour is higher
than 240 vphpl.
2. Crash Rate: The crash rate within 500 feet of the ramp gore point is higher than the
mean crash rate for similar sections on freeways in the metropolitan area.
3. Speed: For 200 or more days per year, the freeway operates at speeds lower than
50 mph for at least 30 minutes.
4. Level of Service: The peak period level of service (LOS) for the freeway is worse
than LOS D.
5. Mainline Volume and Ramp volume: The total peak period mainline volume in one
direction (excluding the managed lanes volume) and downstream of the gore exceeds:
2,650 vph for two mainline lanes,
4,250 vph for three mainline lanes,
5,850 vph for four mainline lanes,
7,450 vph for five mainline lanes,
9,050 vph for six mainline lanes, and
10,650 vph for more than six mainline lanes.
6. Mainline Right Lane Volume and Ramp Volume: The ramp volume plus mainline
right lane volume downstream of the gore is more than 2,100 vph during the peak hour.
17
7. Platoons from Signalized Intersections: The hourly volume entering from arterials,
based on the highest 30-second volume readings (during the critical peak period) projected to hourly values, is greater than 1,100 vph.
8. Acceleration Length: The available acceleration length after the stop bar is greater
than the required acceleration length. The acceleration length must accommodate enough distance between the stop bar and the convergence point of the ramp and freeway mainline to allow vehicles on the ramp to accelerate within 5 mph of the freeway’s operating speed. Providing inadequate acceleration length is not allowed
under any circumstance.
9. Ramp Storage Length: The available ramp storage length is greater than the
estimated queuing length on the ramp. The queueing length is calculated using the following steps.
Step 1: Obtain a 20-year projected peak hour ramp demand volume.
Step 2: Assume a peak hour factor of 0.8 and calculate the 140-second arrival
rate.
Step 3: If the ramp peak hour volume is between 240-800 vph, consider a
single-lane ramp; if the volume is higher than 800 vph, consider a two-single-lane ramp.
Step 4: Assume a discharge rate of 31 vehicles per 140 seconds for single-lane
ramps, and 62 vehicles per 140 seconds for two-lane ramps. Subtract the discharge rate from the arrival rate calculated in Step 2 to determine the excess number of vehicles per 140 seconds.
Step 5: Calculate the total queue length by multiplying the excess vehicles by a
18
Step 6: Calculate the queue length per lane by dividing the calculated total
queue length by the number of lanes.
Step 7: The required storage lane length is the calculated queue length per lane
plus the minimum storage length. This minimum storage length accounts for platoons of vehicles arriving at the ramp meter. The required minimum storage lengths are 480 feet per lane for a one or two-lane ramp, and 510 feet for a three-lane ramp.
The calculated storage length is to be rounded up to a multiple of 30. Additional storage must be provided if there is a significant number of trucks, buses, or RVs using the ramp.
2.1.7 New York
The New York State Highway Design Manual adopted the following ramp metering warrants from the National Cooperative Highway Research Program (NCHRP) Report 155:
Freeway operating at a level of service worse than LOS D.
Adequate parallel surface routes must be available for the traffic diverted from the
ramps.
Sufficient ramp storage capacity must be available to prevent queues of vehicles
waiting to enter the freeway from blocking local street circulation.
The New York State Department of Transportation (NYSDOT) recommends the following value for the ramp metering rate:
19
Two-lane ramp: metering range from a low of 400 vph to a high of 1,500-1,800 vph
(Gan et al., 2011).
2.1.8 Texas
The Texas Manual on Uniform Traffic Control Devices follows the ramp metering warrants of MUTCD 2003. However, the Texas Department of Transportation (TxDOT) introduced the following ramp metering warrants in 2009:
The freeway regularly operates at speeds of less than 50 mph for at least a half-hour
period during the day (presumably during the peak period).
The ramp sustains a minimum flow rate of at least 300 vph during the peak periods.
The average traffic flow rate of the two rightmost lanes during the peak periods
exceeds 1,600 vphpl for entrance ramps that have acceleration lanes of 500 feet or less. This threshold level increases as the length of the acceleration lane on the ramp increases.
The combined traffic flow rate in the rightmost freeway lane plus the flow rate on
the entrance ramp during peak periods exceeds a minimum of 2,300 vphpl for entrance ramps with acceleration lanes of 500 feet or less. The threshold level increases as the length of the acceleration lane on the ramp increases.
From a safety perspective, TxDOT recommends that the ramp metering application is justified based on the following three criteria:
The rate of crashes in the immediate vicinity of the ramp exceeds the mean crash
20
The acceleration distance permits a vehicle starting from a stop at the signal to reach
the prevailing speed of the freeway traffic in the merge area so as to prevent an unacceptable speed differential in the merge area. The interacting ramp and freeway traffic vehicles must be able to maintain a desirable time to collision (TTC) after the merge. A TTC value lower than a specified threshold indicates an unsafe merge condition at the ramp meter. A sufficient storage length must also exist upstream of the ramp control signal to prevent queues from impeding operations on the frontage road or surface street intersection (Balke et al., 2009).
2.1.9 Utah
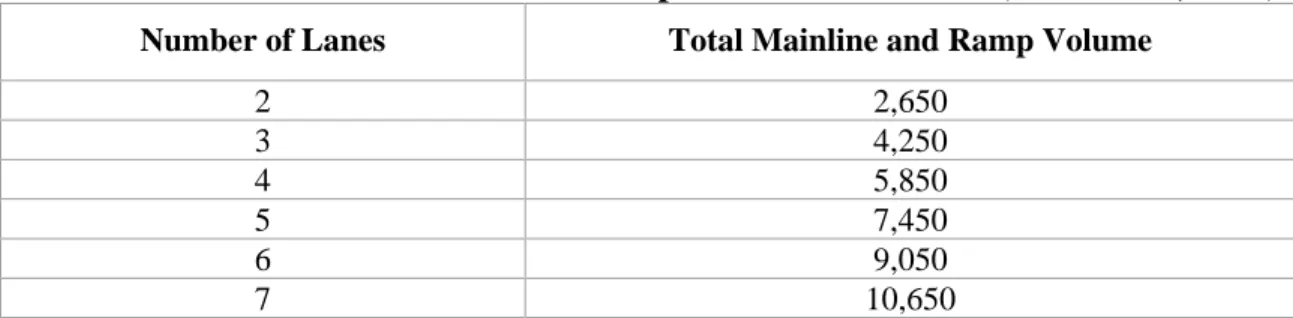
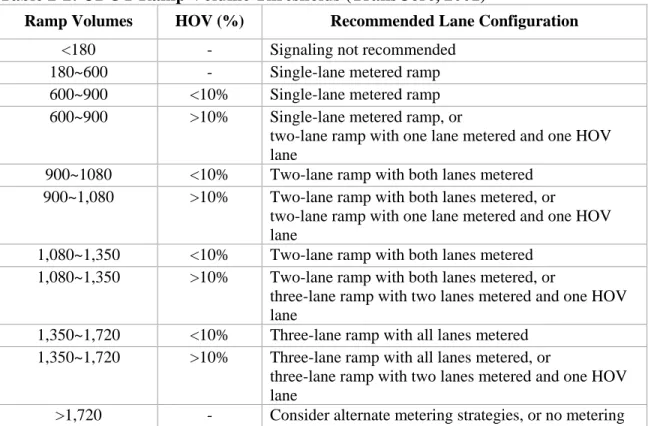
The Utah Department of Transportation (UDOT) specifies thresholds for the total of the mainline and ramp volumes or the individual ramp volume to justify ramp metering. The total of the mainline and ramp volumes threshold depends on the number of lanes on the freeway, while the ramp volume threshold depends on the number of lanes on the ramp and the percentage of HOVs (TransCore, 2001). The thresholds are shown in Tables 2-1 and 2-2.
Table 2-1: UDOT Total Mainline and Ramp Volume Thresholds (TransCore, 2001)
Number of Lanes Total Mainline and Ramp Volume
2 2,650 3 4,250 4 5,850 5 7,450 6 9,050 7 10,650
21
Table 2-2: UDOT Ramp Volume Thresholds (TransCore, 2001)
Ramp Volumes HOV (%) Recommended Lane Configuration
<180 - Signaling not recommended
180~600 - Single-lane metered ramp
600~900 <10% Single-lane metered ramp
600~900 >10% Single-lane metered ramp, or
two-lane ramp with one lane metered and one HOV lane
900~1080 <10% Two-lane ramp with both lanes metered
900~1,080 >10% Two-lane ramp with both lanes metered, or
two-lane ramp with one lane metered and one HOV lane
1,080~1,350 <10% Two-lane ramp with both lanes metered
1,080~1,350 >10% Two-lane ramp with both lanes metered, or
three-lane ramp with two lanes metered and one HOV lane
1,350~1,720 <10% Three-lane ramp with all lanes metered
1,350~1,720 >10% Three-lane ramp with all lanes metered, or
three-lane ramp with two lanes metered and one HOV lane
>1,720 - Consider alternate metering strategies, or no metering
2.1.10 Virginia
The Virginia Transportation Research Council specifies the following warrants to justify ramp metering (Arnold, 1998):
The freeway has poor traffic flow conditions in the peak periods, such as speeds of
less than 30 mph, low throughput per lane, and levels of service of E or F.
There are numerous crashes on the freeway, especially in the weaving areas.
There are obvious merging problems occurring at freeway on-ramps.
Heavy traffic volumes at closely spaced on-ramps.
Feasible metering rate can accommodate the ramp demand volumes from both a
maximum and minimum standpoint.
There is adequate vehicle storage on the ramp.
22 2.1.11 Wisconsin
The Wisconsin Department of Transportation (WisDOT) introduced the following ramp metering warrants (Wilbur Smith Associates, 2006):
Mainline volume flow rates of at least 1,200 vphpl (approximately 20% to 30%
occupancy) coupled with slow-moving traffic along the freeway lanes.
Ramp volume criteria: The ramp should have volumes of at least 240 vph for one
lane and 400 vph for two lanes.
Speed criteria: 30 mph or less is the common minimum freeway speed to warrant
ramp metering.
Safety criteria: A reduction in crashes at the merge should be expected due to
metering. Crash rates in the vicinity of the ramp of 80 crashes or more per hundred million vehicle-miles of travel are recommended as a starting point for further analysis.
Ramp geometric criteria: These include queuing storage space, adequate
acceleration distance and merge area beyond the meter, and sight distance.
Funding criteria: An evaluation of potential funding sources should be completed
to determine if there is sufficient support for the project.
Alternate route criteria: The presence of an alternative route for motorists to avoid
delays on entrance ramps created by a ramp meter may be required.
Corridor criteria: In most implementations, ramp metering is addressed at the
corridor level. It must be determined whether the section under consideration is part of a corridor.
23 2.1.12 Summary of Existing Warrants
Ramp metering installation warrants have been developed by a number of states, as demonstrated above. As with the warrants developed in Florida, most warrants are generally simple and examine the conditions in the immediate vicinity of each ramp (local conditions) to determine if a ramp meter is warranted. Some states have fewer warrants, such as Arizona, which has only two warrants based on mainline and ramp volumes and on speed. Other states, such as Nevada and Florida, have more warrants that also consider safety, the length of acceleration lanes, ramp queue storage, level of service, platoons from intersections, and/or the availability of diversion routes. Some warrants specify LOS D as a criterion to install ramp metering. Other state warrants, such as Wisconsin, specify mainline volume flow rates of at least 1,200 vphpl, with approximately 20% to 30% occupancy and slow-moving traffic along freeway lanes.
Some states like Arizona and Nevada specify speed warrants that justify ramp metering if the traffic speed drops to less than 50 mph for half an hour, possibly reflecting LOS D. On the other hand, other state warrants, like Virginia, specify speed drops below 30 mph and LOS E or LOS F for the consideration of ramp metering. For the safety warrants, quantitative values were included in the Wisconsin and Florida warrants (≥80
crashes per hundred million vehicle-miles of travel). Table 2-3 summarizes the warrants presented in this section.
24
Table 2-3: Summary of Ramp Metering Warrants for Traffic Criteria
Criteria Parameter State Threshold
Freeway Volume Mainline Volume Florida >1,200 vphpl Minnesota >1,200-1,500 vphpl Washington >1,500 vphpl Wisconsin >1,200 vphpl Most Right Lane Florida > 2,050 vphpl Two Most Right Lanes Texas >1,600 vphpl
Volume/Capacity Freeway Mainline California 0.6-0.8 Wisconsin 0.7
Mainline Speed
Duration of at Least Half an Hour MUTCD < 50 mph Duration of at Least 30 minutes for
200 or More Calendar Days per Year Arizona
< 50 mph Average Mainline Speed California < 30 mph Peak Period Speed Minnesota < 30 mph Mainline Speed constantly
Nevada < 50 mph Peak Period Speed < 40 mph Peak Period Speed
Texas < 50 mph Virginia < 30 mph Wisconsin < 30 mph Level of Service Nevada D New York D Virginia E Occupancy Wisconsin > 18-20% # of Mainline Lanes
Mainline and Ramp Volume (Peak Hour) 2 Arizona Colorado Florida Utah > 2650 vph 3 > 4250 vph 4 > 5850 vph 5 > 7450 vph 6 > 9050 vph > 6 > 10650 vph
Two Most Right Lanes of Mainline Plus Ramp Volume (Peak Hour)
Arizona > 2,100 vph California > 1,800 vph Texas > 2,300 vph
# of Ramp Lanes Min (vph) Max (vph)
Ramp Volume 1 California 240 900 Colorado - 900 Florida 240 1,200 Nevada - 1,100 New York Oregon 240 900 240 900 Texas 300 - Utah 180 900 Wisconsin 240 - 2 California 500 900 Colorado 900 - Florida 400 1,700 Nevada 1,200 1,900 New York 4,00 1,800 Oregon - 1,650 Utah 600 1,350 Wisconsin 400 -
25
2.2 Ramp Metering Strategies
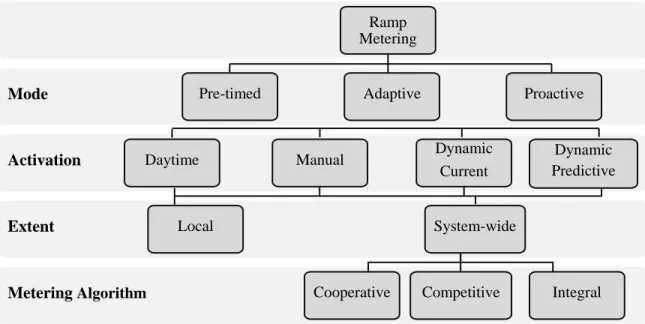
As shown in Figure 2-3, Ramp metering strategies can be classified into different categories depending on the metering selection mode, metering activation strategy, ramp metering extent, and metering algorithms. This section presents a review of these algorithms, which will provide additional information useful for the development of the method in this dissertation research.
Figure 2-3: Ramp Metering Categories (Kristeleit, 2014)
2.2.1 Metering Rate Selection Mode
Metering rate calculations can be static, adaptive, or proactive. In static (time of day) control, the metering rate is calculated using historical data and under the assumption that traffic patterns tend to be the same over time. Adaptive (or traffic responsive) ramp calculates an appropriate ramp metering rate based on actual mainline and ramp traffic measurements. In doing so, this can address non-recurrent congestion, as well as recurrent traffic congestion, if desired. Similarly, the proactive (predictive) mode of control makes
Metering Algorithm Extent Activation Mode Ramp Metering Pre-timed Daytime Local Manual Adaptive Dynamic Current System-wide
Cooperative Competitive Integral Proactive
Dynamic Predictive
26
calculation on real-time data in order to prevent oversaturated conditions and traffic breakdown. Compared to static metering, both adaptive and proactive metering strategies require the installation and maintenance of traffic detectors along the freeway mainline and ramps.
2.2.2 Metering Activation Strategies
Within proactive and adaptive strategies, ramp metering can be activated either based on a schedule, manual inputs, or dynamically in response to current or predicted traffic conditions. The simplest of these activations methods is based on a fixed schedule. An example of this could be that the system is activated every day at 4:00 PM in the northbound direction. The manual strategy is more labor-intensive as it requires an operator to watch live traffic conditions via CCTV cameras and make changes accordingly. Unlike manual activation, the dynamic strategy implements an automated method which utilizes current traffic measurements or predicted traffic conditions to prevent breakdown and congestion; non-recurrent traffic conditions, such as incidents or accidents, can also trigger the activation of dynamic ramp metering. As metering activation strategies become more advanced and increasingly more automated, the need for manual intervention is decreasing. However, these new automated methods require the deployment of more in-field traffic sensing devices, as well as more computational power.
2.2.3 Ramp Metering Extent and Associated Algorithms
Depending on the number of ramps being monitored by a ramp metering algorithm, it can be classified as a local algorithm, which only focuses on one ramp as an isolated element, or a system-wide (coordinated) algorithm, which considers multiple ramps. The
27
objective of system-wide metering is to optimize the metering rate of each ramp in order to improve the system-wide traffic conditions and/or performance; in these types of algorithms, the function may differ based on an agency’s policies.
In both local and system-wide metering, measurements of macroscopic traffic parameters on the freeway mainlines, specifically flow and occupancy and on-ramp queue lengths, are considered in the metering rate selection process to avoid freeway traffic breakdown and queue spillbacks to arterials. However, the system-wide metering requires detectors to be located on ramps and along the entire metering section. Conversely, local metering algorithms, both schedule-based and responsive, only require detectors to be located around the vicinity of a ramp area, including the subject on-ramp and freeway mainline. System-wide metering is more effective due to the fact that it can prevent and/or delay traffic breakdowns at a particular location through metering multiple upstream ramps rather than relying on metering the ramp immediately upstream of the bottleneck. This dependence on one ramp may not be enough to produce the desired effect required from these types of systems.
This section briefly discussed traffic-responsive ramp metering algorithms that have been used to select ramp metering rates. It is important to point out that this review serves to provide a review of literature related to this research’s activities, as well as to explore protocols that will be implemented in the methodology developed in this dissertation. Tables 2-4 and 2-5 present comparisons of various categories of ramp metering algorithms.
28
Table 2-4: Comparison of Pre-Timed and Traffic Responsive Ramp Metering Algorithms (Cambridge Systematics, 2001)
Capabilities and Requirements
Pre-timed Traffic Responsive
Local System-Wide Local System-Wide
Solve Local /System-Wide Issues
Local System-wide Local
System-wide (most useful for corridor applications) Field Detection Devices No No Yes Yes (both upstream and downstream) Communication Devices No No No Yes Maintenance Periodic manual update
High capital and maintenance cost Highest capital and maintenance cost; requires expert calibration and implementation Recurrent and/or Non-Recurrent Effectiveness Recurrent congestion Recurrent congestion Recurrent and non-recurrent conditions
Both recurrent and non-recurrent conditions Traffic Optimization Over-restrictive metering rates Over-restrictive metering rates Reactive improvement; no optimization Optimal rate based on real-world conditions
29
Table 2-5: Summary of Ramp Metering Algorithms (Atkins, 2013)
Ramp Meter
Type Description Required Resources Advantages Disadvantages
Fixed Time
Activated based on time of day
Time of day is based on historical or predicted volumes.
Only vehicle detection on the ramp for queue management or to actuate and terminate the metering cycle.
Traditionally, detection has been
implemented in the form of induction loops.
Simple
Is able to operate even in temporary lack of communications, detectors malfunction or construction.
Does not respond to real-time traffic condition.
Does not respond to non-recurrent traffic conditions such as incidents and adverse weather.
Does not consider the whole system. Local Traffic Responsive Metering rate is adjusted based on current conditions of freeway condition at the vicinity of ramp area.
Demand detectors: located just upstream from the stop bar, detect the presence of a vehicle at the ramp meter and initiate the ramp metering cycle.
Passage Detectors: located just downstream from the stop bar to detect and count the number of vehicles entering the freeway (used to determine the duration of green time)
Ramp queue detectors: located near the ramp intersection and the adjacent arterial.
Mainline: located upstream of the entrance ramp gore point.
Responses to real-time traffic conditions at the vicinity of the ramp area.
Does not require communication to TMC.
Does not respond to traffic conditions in the rest of system.
System-Wide Traffic Responsive
The metering rate of each ramp is optimized in order to improve system-wide conditions.
Demand detectors, passage detectors, ramp queue detectors, (similar to local
algorithms).
Mainline: located upstream of the entrance ramp gore point. System-wide metering operations can use mainline detectors downstream of ramps.
Off-ramp passage detectors
Unmetered on-ramp passage detectors
Responses to real-time traffic conditions throughout the system.
Is able to prevent bottleneck.
Has the most potential benefits among all metering operations.
Requires
communication to TMC.
Has potential to favor some ramps over others, creating inequity issues.
30 2.2.3.1 Local Ramp Metering Algorithms
The three widely referenced local metering algorithms are the demand-capacity, percent-occupancy, and ALINEA algorithms. These three algorithms will be explored in the remainder of this section.
Demand-Capacity Algorithm
The demand-capacity algorithm is one of the initial algorithms used in traffic-responsive ramp metering and can be considered a fundamental basis for other metering algorithms. This algorithm utilizes real-time freeway flow or occupancy measurements from locations up and downstream of the ramp. The metering rate is calculated as the difference between upstream freeway flow and downstream capacity, or as a function of
the difference between upstream occupancy and desired occupancy(Kristeleit, 2014).
The advantage of this algorithm is its simplicity. However, the level of congestion of the freeway may not be determined only using the upstream local freeway occupancy. Another version of this algorithm, developed in the Netherlands, manages the metering rate based on flow and speed data to keep the actual flow below the critical limit.
Smargdis et al. showed that this algorithm can be partially sensitive to non-measurable disturbances such as merging difficulties, shockwaves, and slow vehicles (Smargdis et al., 2004). The National Cooperative Highway Research Program (NCHRP) Report 3-87 suggests improving this algorithm by including the probability of breakdown
for the activation and/or metering rate calculation(Elefteriadou et al., 2009). This means
that the ramp metering rate is set to keep the demand significantly lower than the capacity, as is done with the simple demand-capacity algorithm.
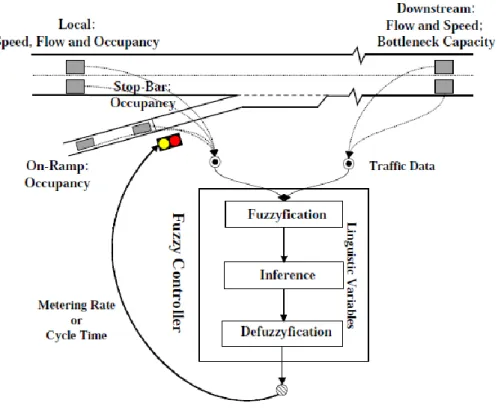
31 Percent-Occupancy Algorithm
This algorithm depends solely on upstream occupancy measurements to determine the level of congestion and, as such, does not require downstream capacity measurements. The algorithm utilizes a linear relationship between the metering rate and upstream occupancy. Equation 2-3 demonstrates the form used to calculate the metering rate. In this
equation, K1is the freeway capacity. K2 is the slope of a straight line that relates occupancy
to flow in the uncongested part of the fundamental diagram. The values of both K1 and K2
are preset values for each location (Hasan, 1999).
𝑟(𝑘) = 𝐾1 − 𝐾2𝑜𝑖𝑛(𝑘 − 1) (2-3)
where,
𝑟(𝑘)=metering rate at time interval k,
𝐾1=a constant value of freeway capacity (veh/hr), and
𝑜𝑖𝑛(𝑘 − 1)=the last measured upstream occupancy value (%).
ALINEA Algorithms
The Asservissement Linéaire d'Entrée Autoroutière (ALINEA) algorithm was developed by Papageorgiou in 1997 and was initially deployed in Paris, Amsterdam and Munich (Kristeleit, 2014). ALINEA is a local traffic-responsive control algorithm with a feedback regulator. The idea of this algorithm is to keep the occupancy under a static, pre-defined critical occupancy value. The calculated metering rate is expected to keep the traffic flow under the capacity level of the downstream segment, as indicated by the occupancy measurements. The metering rate is calculated using Equation 2-4. In this algorithm the critical or desired occupancy can be set by determining the occupancy of the downstream segment, when it approximately reaches its capacity.
32
𝑟(𝑘) = 𝑟(𝑘 − 1) + 𝐾𝑅 [𝑜̂ − 𝑜𝑜𝑢𝑡(𝑘 − 1)] (2-4)
where,
𝑟(𝑘)=metering rate at time interval k,
KR=a constant regulator parameter (veh/hr),
𝑜𝑜𝑢𝑡(𝑘 − 1)=the last measured upstream occupancy value (%),
𝑜̂= the desired value for downstream occupancy (predefined).
The ALINEA algorithm has been frequently referenced and used in many ramp metering studies. Over time, multiple extensions of it have been developed to deal with different issues and overcome challenges. FL-ALINEA, UF-ALINEA, UP-ALINEA, X-ALINEA/Q and MALINEA are some of the more common extensions of the ALINEA algorithm. These extensions will be briefly discussed in this section.
FL-ALINEA
The FL-ALINEA algorithm was developed to overcome possible difficulties with occupancy measurements and selecting appropriate occupancy values. This extension modifies the original ALINEA equation by substituting occupancy with downstream flow measurements. Generally, it has been recommended to keep the critical flow at least 10% below capacity.
UF-ALINEA
This is a modification to the FL-ALINEA algorithm described above, which estimates the downstream flow instead of measuring it. In order to accomplish this, the on-ramp flow and upstream mainline flow are considered.
33 UP-ALINEA
In some conditions, only upstream occupancy is available, and the ALINEA algorithm needs to be modified to calculate downstream occupancy based on the upstream measurements. This is done in an extension of the original algorithm, called the UP-ALINEA algorithm. To calculate downstream occupancy, additional measurements of the entering flow from the on-ramp to the freeway and freeway upstream flow measurements are required.
Assuming 𝑞𝑜𝑢𝑡= 𝑞𝑖𝑛+ 𝑞𝑟𝑎𝑚𝑝, the downstream occupancy is calculated as shown
below, using Equation 2-5:
𝑜𝑜𝑢𝑡(𝑘) = 𝑜𝑖𝑛(𝑘) [1 +𝑞𝑟𝑎𝑚𝑝(𝑘) 𝑞𝑖𝑛(𝑘) ] ×
λ𝑖𝑛
λ𝑜𝑢𝑡 (2-5)
where,
𝑜𝑜𝑢𝑡(𝑘) = downstream occupancy at the time k,
𝑜𝑖𝑛(𝑘) = upstream occupancy at the time k,
𝑞𝑟𝑎𝑚𝑝(𝑘) = measured ramp volume (vph) at the time k,
𝑞𝑖𝑛(𝑘) = upstream measured freeway volume (vph) at the time k, and
λ𝑖𝑛, λ𝑜𝑢𝑡 = the number of mainstream lanes for the upstream and downstream segments.
X-ALINEA/Q
Ramp metering may cause the formation of large queues on the ramp, which in turn may affect the surface street. The X-ALINEA/Q algorithm was developed to account for ramp queues. X-ALINEA/Q requires measuring the ramp demands and queue lengths.
34 MALINEA
The MALINEA algorithm was proposed by Oh and Sisiopiko in 2001 (Oh and Sisiopiku, 2001). MALINEA measures upstream occupancy of the freeway segment and the time lag between upstream and downstream measurements in order to incorporate the upstream conditions in the metering rate calculation. MALINEA uses the following equation (Elefteriadou et al., 2009):
𝑟(𝑡 + 1) = [𝑜𝑢(𝑡 + 1) − 𝑜𝑢(𝑡)] ×
𝐾
𝐴+ 𝑟(𝑡) (2-6) where,
𝑟(𝑡 + 1) = metering rate to be applied in the next time period,
ou(t+ 1) = desirable upstream occupancy in the next time period,
ou(t) = measured occupancy at the upstream detector for the last time period,
r(t) = the current metering rate, and
A, K = slope of occupancy upstream and downstream of the on-ramp, and the parameter used in ALINEA, respectively.
2.2.3.2 System-Wide Ramp Metering Algorithms
As indicated in the literature, system-wide ramp metering algorithms have been categorized as cooperative, competitive, or integral. In cooperative ramp metering, the calculated metering rates are based on local conditions and are adjusted according to system-wide considerations. Competitive algorithms calculate ramp metering rates at both the system-wide and local levels. From these two calculations, the competitive method selects the most restrictive case. Similarly, the integral algorithm calculates both rates and
35
then incorporates them in the metering rate calculation simultaneously to determine the optimal metering rates (Bertini and Ahn, 2006).
Cooperative Algorithms The Helper Algorithm
The helper algorithm was developed in 1981 in Denver, Colorado and includes a local traffic responsive algorithm enhanced with a system override feature (Kristeleit, 2014). In this algorithm, the freeway corridor is divided into groups, with each group containing one to seven metered ramps (Lipp et al., 1991). This algorithm initially determines the metering rate for each of the ramps using a local traffic-responsive algorithm and simultaneously monitors the on-ramp queue using the queue detectors. If the occupancy on a queue detector for a specific on-ramp exceeds the predefined threshold, the subject ramp is identified as a “critical ramp.” Once a critical ramp is identified within
its group, the system override feature of this algorithm is activated. This feature increases the metering rate of the critical ramp while reducing the metering rate of the upstream ramps to mitigate the congestion in the vicinity of the critical ramp (Bertini and Ahn, 2006). The Linked Ramp Algorithm
The linked ramp algorithm was first deployed in San Diego, California in 1968 and is commonly referred to as the San Diego Ramp Metering System (SDRMS). This algorithm utilizes historical traffic flow data to calculate the maximum and minimum metering rates at each ramp. The maximum metering rate is calculated based on the local capacity, which is estimated from historical data, and the metering rate is the difference between the target traffic flow (considering capacity) and upstream traffic flow. Therefore, the algorithm operates as local and once the demands lead to calculating rates that are
36
below the minimum rates, the cooperative feature of the Linked algorithm is activated, resulting in metering upstream ramps (Kristeleit, 2014).
Competitive Algorithms The FLOW Algorithm
The FLOW algorithm is a bottleneck-based algorithm developed by Jacobson et al. in 1989. This algorithm calculates both local and bottleneck metering rates, then selects whichever is more restrictive. The local metering rate is calculated using the percent-occupancy algorithm. The metering rates are selected from a look-up table that relates the upstream occupancy to the metering rate of the ramp. The look-up table is produced from historical volume-occupancy relationships (Jacobson et al., 1989).
To estimate the bottleneck metering rate, the bottleneck locations on the freeway with an influence zone of at least one ramp must first be identified. Then, all of the metered on-ramps within the zone are weighted based on their distances from the bottleneck and historical ramp volumes. This algorithm requires loop detectors upstream and downstream of the influence zone, as well as all metered and unmetered on- and off-ramps. The bottleneck algorithm is activated once both of the following conditions are met:
The downstream occupancy exceeds a predefined threshold.
The total entering volume (sum of upstream freeway and on-ramps volume)
exceeds the total exiting volume (sum of vehicles exiting the section and off-ramps).
Following these conditions, the metering rates are calculated based on the difference of the total entering and exiting volumes, as well as the weighting factors for the ramps.