Identifying Changes of Functional Brain Networks using
Graph Theory
Dissertation
zur Erlangung des akademischen Grades
Dr. rer. med.
an der Medizinischen Fakultät
der Universität Leipzig
eingereicht von:
Diplom Informatiker Alexander Schäfer
geboren am 19.07.1983 in Meiningen/Deutschland
angefertigt am:
Max-Planck-Institut für Kognitions- und Neurowissenschaften
Betreuer:
Prof. Dr. Arno Villringer Dr. Daniel Margulies Gutachter:
Prof. Dr. Karl-Titus Hoffmann, Abteilung für Neuroradiologie, Leipzig
Prof. Dr. Felix Blankenburg, AB Neurocomputation und Neuroimaging, FU Berlin
Einreichungsdatum: 25.04.2014 Verteidigungsdatum: 26.03.2015
“Change is the only constant in life.” ― Heraclitus
Bibliographic description ... 1
List of Symbols ... 3
1 Introduction ... 4
1.1 General Introduction ... 4
1.2 Functional Magnetic Resonance Imaging... 4
1.3 Resting-state fMRI ... 4
1.4 Brain Networks and Graph Theory ... 5
1.5 White-Matter Lesions and Small Vessel Disease ... 8
1.6 Transcranial Direct Current Stimulation ... 8
1.7 Dynamic Functional Connectivity ... 9
2 Publications ...10
2.1 Resting developments: a review of fMRI post-processing methodologies for spontaneous brain activity...10
2.2 Early small vessel disease affects fronto-parietal and cerebellar hubs in close correlation with clinical symptoms – A resting-state fMRI study ...31
2.3 Dynamic modulation of intrinsic functional connectivity by transcranial direct current stimulation ...49
2.4 Three-dimensional mean-shift edge bundling for the visualization of functional connectivity in the brain ...61
2.5 Dynamic network participation of functional connectivity hubs assessed by resting-state fMRI ...72
3 Summary ...93
4 Bibliography ...98
5. Appendix ... 104
5.1 Erklärung über die eigenständige Abfassung der Arbeit ... 104
5.2 Curriculum vitae ... 105
5.3 Publications ... 108
1 Schäfer, Alexander
Identifying Changes of Functional Brain Networks using Graph Theory Universität Leipzig, Dissertation
109 pages, 76 references, 3 figures Articles included in this thesis:
- Margulies D., Böttger J., Long X., Lv Y., Kelly C., Schäfer A., Goldhahn D., Abbushi A., Milham M., Lohmann G. and Villringer A., Resting developments: a review of fMRI post-processing methodologies for spontaneous brain activity, Magnetic Resonance Materials in Physics, Biology and Medicine, 23(5‒6), 289‒307, 2010
- Schaefer A., Quinque E., Kipping J., Arélin K., Frisch S., Roggenhofer E., Villringer A., Mueller K., and Schroeter M., Early small vessel disease affects fronto-parietal and cerebellar hubs in close correlation with clinical symptoms – A resting-state fMRI study, Journal of Cerebral Blood Flow and Metabolism, 34(7), 1091–1095, 2014
- Sehm B.*, Schäfer A.*, Kipping J., Margulies D., Conde V., Villringer A., and Ragert P., Dynamic modulation of intrinsic functional connectivity by transcranial direct current stimulation, Journal of Neurophysiology, 108(12), 3253‒3263, 2012 (*) equally contributing authors
- Böttger J., Schäfer A., Lohmann G., Villringer A., and Margulies D.,
Three-dimensional mean-shift edge bundling for the visualization of functional connectivity in the brain, IEEE Transactions of Visualization and Computer Graphics, 20(3), 471‒ 480, 2014
- Schaefer A., Margulies D., Lohmann G., Gorgolewski K., Smallwood J., Kiebel S., and Villringer A., Dynamic network participation of functional connectivity hubs assessed by resting-state fMRI, Frontiers in Human Neuroscience, 8(15), 2014
Referat:
Brain disorders are seen as one of the main health challenges of the 21st century due to high prevalence and their high burden on the patients and their social environment (Wittchen et al., 2011). In the past 30 years, structural brain imaging such as cranial Computed
Tomography (CT) and Magnetic Resonance Imaging (MRI) have become diagnostic cornerstones of clinical neurology and psychiatry. However, lesions detected with these structural methods are usually already irreversible and therefore great hopes are put into techniques which may detect brain diseases already at an early level with only “functional” and thus reversible changes. Functional Magnetic Resonance Imaging (fMRI) is such a method, however, due to a number of shortcomings (dependence on patients’ cooperation and on specific tasks), its clinical utility is very limited. However, a recently developed variant, resting-state fMRI (rs-fMRI), seems to overcome these limitations providing promising results in health and disease (Reijneveld et al., 2007; Fox and Greicius, 2010) based on a single examination of only few minutes duration. In this thesis, I contribute some further
methodological advances to rs-fMRI to estimate in-vivo changes of functional brain networks in health and disease.
These functional brain networks can be analyzed using various methods. An overview over such methods is given in Study 1 (Margulies et al., 2010).
2
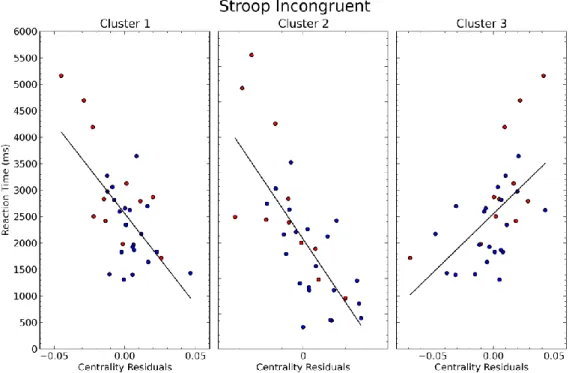
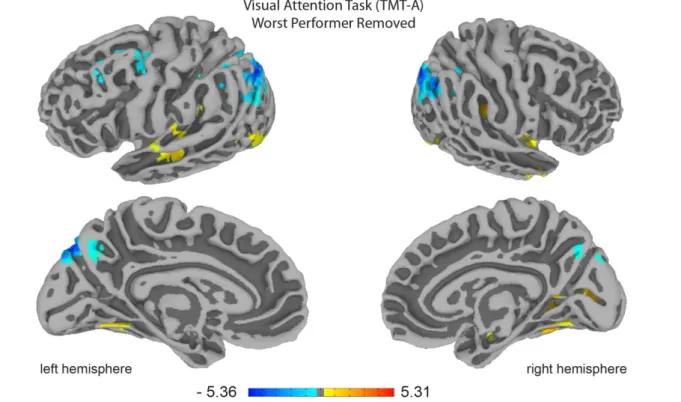
These gray matter regions are connected and communicate through white matter fibers. In Study 2 (Schaefer et al., 2014b) we investigated the impact of small lesions in the white matter onto the communication between functional gray matter regions. We found a severe reduction of cerebral gray matter connectivity (synchronized signal) in subjects with white matter lesions using network centrality analysis. This effect was also reflected in the severity of the lesions. Behaviorally we found a psycho-motor slowing in the patients with white matter lesions.
The excitability of neurons in the gray matter can be influenced by electrical stimulation. The method of transcranial Direct Current Stimulation (tDCS) is a non-invasive electrical brain stimulation technique which has been shown to influence cortical excitability and alter behavior and learning. In Study 3 (Sehm et al., 2012) we analyzed the effects of tDCS to whole brain functional connectivity before, during and after stimulation of the primary motor cortex using network centrality analysis. Besides effects to the functional connectivity of motor and pre-motor areas we also found widespread effects during stimulation as compared to the sham condition.
One drawback of centrality approaches is their inherent reduction of spatial information. This reduction is often done for statistical reasons but also for reasons of visualization. The richness of the data makes it difficult to give a good display of all connections in the original anatomical space as they strongly overlap. A clear display in the anatomical space may be especially relevant in a neurosurgical context. In Study 4 (Böttger et al., 2014a) we
addressed this limitation by bundling connections which connect similar areas in the brain. This approach is able to compress redundant information which reduces unnecessary clutter. As a consequence, this method might enhance the information gained for a human viewer of whole brain functional connectivity.
While the previous studies addressed alterations of functional brain networks between scans, in Study 5 (Schaefer et al., 2014a) we investigated the ongoing changes during the scan. While these ongoing networks dynamics could be of interest for clinical applications, their non-artifactual origin needs to be validated using external measures (Hutchison et al., 2013a). In our analysis we show a relationship between the dynamics of connectivity networks and self-generated-thoughts, as well as age. These results provide support for a non-artifactual origin of functional networks dynamics.
Functional brain networks estimated by resting-state fMRI offer a tool to measure and investigate changes due to brain diseases and therapy. This thesis shows how to estimate these changes and relate them to the severity of the disease. Further, it comprises new methods to investigate changes on even short time scales. The amount of change on these short time scales might offer a new window to characterize and investigate brain diseases.
3 BOLD Blood Oxygenation Level Dependent CT Computed Tomography
EEG Electro EncephaloGraphy EPI Echo Planar Imaging M1 primary motor cortex
MRI Magnetic Resonance Imaging
fMRI functional Magnetic Resonance Imaging
rs-fMRI resting-state functional Magnetic Resonance Imaging SM1 primary sensorimotor cortex
tDCS transcranial Direct Current Stimulation
4
1.1 General Introduction
Brain disorders, comprising mental and neurologic disorders, are described as one of the core health challenges for the 21st century (Wittchen et al., 2011; Collins et al., 2011). While functional Magnetic Resonance Imaging (fMRI) was expected to be a crucial method for the detection and prognosis of brain disorders (Thulborn et al., 1996), it has seen only few successful translations to the clinical realm (Matthews et al., 2006; Bullmore, 2012). fMRI was used for a long time in the framework of specifically designed experiments in which certain brain areas were expected to show atypical activations. This task-based fMRI stands in stark contrast to the significantly more successful structural neuroimaging (e.g. cranial CT, MRI) which provides whole brain images without any patient compliance. However, functional neuroimaging can be crucial for an early detection of pathological brain changes. This thesis will use fMRI and network theory to investigate clinically relevant functional changes of the human brain without regional constraints or the need of a specific task.
1.2 Functional Magnetic Resonance Imaging
While in-vitro studies have enhanced our general knowledge of the brain, a better understanding and detection of brain diseases in humans can only be achieved by in-vivo measurements. The in-vivo study of the human brain has been enabled by recent methodological advances. One very promising method for in-vivo neuroimaging, besides the well-established cranial Computed Tomography (CT) and Magnetic Resonance Imaging (MRI), is functional MRI (fMRI).
Functional Magnetic Resonance Imaging is a widely applied form of non-invasive in-vivo imaging. It is an MRI procedure which aims to provide large-scale images of neuronal population activity. In this thesis it will be used to investigate the human brain and its alterations. The main form of fMRI uses the blood oxygen level dependent (BOLD) contrast developed by Ogawa et al. (2000). fMRI BOLD is an indirect measure of neural activity which is based on the relationship between cerebral blood flow, energy demand and neural activity (Logothetis, 2002). fMRI BOLD uses strong magnetic fields to measure alterations of deoxyhemoglobin concentrations. The deoxyhemoglobin alterations are seen as a reflection of the blood oxygen level and indirectly energy consumption. However, blood oxygenation depends on the dynamics of oxygen consumption, cerebral blood flow and cerebral blood volume (Logothetis, 2002). Despite its indirectness, fMRI has been repeatedly shown to correlate with neuronal activity (Logothetis et al., 2001; Mukamel et al., 2005; Shmuel et al., 2006).
1.3 Resting-state fMRI
Despite its success as a research tool, task-based fMRI has seen little translation into the clinic (Fox and Greicius, 2010). In general, fMRI abnormalities seen in clinical research populations have not translated into the ability to provide practically useful diagnostic or prognostic information in individual patients (Matthews et al., 2006). Vast promise for improving the clinical applicability of fMRI evolves from focusing on intrinsic spontaneous modulations in the BOLD signal that occur during the “resting-state” (Fox and Greicius, 2010).
5
BOLD signal, show correlated signal in functionally coupled networks (Biswal, 1995). These networks resemble task-based co-activation maps (Smith et al., 2009) and persist across various states, such as task performance, wakeful rest, sleep and loss of consciousness (Fox and Raichle, 2007). This property makes resting-state fMRI (rs-fMRI) a power tool to map multiple large-scale functional networks simultaneously. In this context rs-fMRI can serve multiple purposes, as the same dataset enables the investigation of various research questions. Compared to task-based-fMRI, rs-fMRI offers several advantages such as a short acquisition time, a simple acquisition process, a good signal-to-noise ratio, a high reliability (Shehzad et al., 2009) and easier standardization. In recent years, neuroimaging researchers have begun to build up large publicly available data collections to enable exploration and validation of brain networks (Van Essen et al., 2012; Nooner et al., 2012).
Besides identifying the functional architecture of the brain, rs-fMRI has recently also been applied in the research of brain diseases (Fox and Greicius, 2010). The most prominent strategy to identify abnormalities is the comparison of two groups, patients with a neurological pathology and healthy individuals. The relation of an altered synchronization in intrinsic fluctuations with respect to relevant clinical variables provides evidence for the clinical relevance and confidence of the found abnormalities. We follow this idea in Study 2 (Schaefer et al., 2014b). rs-fMRI also enables the clinically crucial identification of acute pathology on a single-subject level (Lv et al., 2013).
1.4 Brain Networks and Graph Theory
As rs-fMRI enables to map out the human brain in a single experiment it has also
strengthened the view of the brain as a complex network. The organization of brain networks can and should be understood in the context of other complex systems as many of the open challenges for science in all disciplines ‒ whether meteorology, sociology or molecular biology ‒ involve understanding and forecasting complex systems. In general, the complexity of these systems does not arise directly from their units or agents (entities which are able to act) but from the dynamic interaction of those agents. While each interaction between a pair of agents might be simple, it opens up a sheer infinite amount of configurations for the system. In the context of fMRI the agents can be brain regions and the interactions can be seen as functional synchronization between these regions.
Graph theory opens up a unified framework to model and investigate complex systems. The interactions between the agents can be described as a graph or network, in which the interactions are formalized as edges and the agents as vertices. The structure of such a network can then inform about the behavior of the complex system.
The functional structure of this large-scale network can be mapped using rs-fMRI (Yeo et al., 2011; Power et al., 2011; Bellec et al., 2010). This network, as any network, can be analyzed with methods developed in the field of graph theory (Diestel, 2005). In graph theory, a graph is defined as a tuple G=(V,E) where V is a set of vertices and E is a set of edges. I will use the terms edges and connections interchangeably throughout the thesis. In the following section, I will explain the different possibilities of defining vertices and edges in graphs derived from fMRI data. The process of graph construction is illustrated in Figure 1.
6 1.4.1 Vertices of an fMRI connectivity graph
The definition of vertices is the first crucial step in a network analysis. In the following section, the four most common approaches of vertex definition in macro-scale neuroimaging will be discussed.
The most straightforward definition of vertices is a voxel-based parcellation. Here every voxel of an fMRI scan becomes a vertex (examples in Lohmann et al., 2010; Zuo et al., 2012). This allows for the highest possible resolution and provides good reliability, given a good registration between the individual images and a common template space. However, its validity as in the question of why the resolution of the MR scanner should be the most informative brain unit remains unclear.
Furthermore, the high resolution of the vertex space makes the analysis computationally very intensive and only very efficient algorithms can be applied. The voxel-based parcellation was used in Studies 2 and 3 (Schaefer et al., 2014b; Sehm et al., 2012).
A more coarse definition of vertices is an anatomical parcellation of the brain. Here every anatomical region of the brain becomes a vertex (Tzourio-Mazoyer et al., 2002). These parcellations are highly reliable and fast to compute given an anatomical atlas. Given the lower number of vertices also more computationally expensive algorithms can be applied. However, the lower resolution can also be regarded as a limitation as it reduces sensitivity. The validity is unclear as the functional brain organization might not be limited by its underlying structure (Koch et al., 2002; Deco et al., 2011). Furthermore, the strong variation in the volumetric size of the vertices might be confounding.
Random parcellations split a brain into coherent regions of uniform size (Cammoun et al., 2012). By iteratively splitting these regions they offer multiple resolutions of the same brain. While random parcellations reduce the vertex size variations their validity and reliability are
Figure 1 Overview of graph construction. (a) Random parcellation of a human brain in 463 cortical and subcortical areas (section 1.4.1). (b) Correlation of average signal from the areas results in a matrix. (c) Thresholded matrix where connections with low correlation values are eliminated. (d) Visualization of resulting network in anatomical space. Figure adopted from Study 4 (Böttger et al., 2014a), © 2014 IEEE.
7 in Figure 1a.
Functional parcellations aim to define functional units as vertices. The parcellation is based on prior functional information and can either be derived from a meta-analysis (Dosenbach et al., 2010) or from functional homogeneity analyses (Smith et al., 2009; Varoquaux et al., 2011; Craddock et al., 2012). Functional parcellations offer good reliability and validity. However, they may miss some regions and are difficult to apply to structural data. A functional parcellation (Craddock et al., 2012) was used in Study 5 (Schaefer et al., 2014a). 1.4.2 Edges of an fMRI connectivity graph
To construct a graph the definition of the edges remains to be carried out. Currently the relationship between regions is often characterized by the synchrony of their temporal signals. However, the best way to define connectivity is still debated in the field (Smith et al., 2011). In the following three different measures of connectivity will be discussed.
The most common approach to define edges is the Pearson’s correlation coefficient r, which is defined as: 𝑟 = ∑ (𝑋𝑖− 𝑋)̅̅̅(𝑌𝑖− 𝑌)̅̅̅ 𝑛 𝑖=1 ∑ (𝑋𝑖− 𝑋)̅̅̅2∑ (𝑌 𝑖− 𝑌̅)2 𝑛 𝑖=1 𝑛 𝑖=1
where Xi is the i-th timepoint in the timeseries of vertex x and 𝑋̅ is the mean of timeseries X.
This holds for Y respectively. All edges in a network are estimated by computing the Pearson’s correlation coefficients between the time series of every pair of regions (Figure 1b). Often only the highest correlation values are used as edges to construct a graph (Figure 1c). The reasoning is that lower correlation values are noise as they show an overall lower test-retest reliability (Schwarz and McGonigle, 2011; Patriat et al., 2013). We followed this idea in Study 4 and 5 (Böttger et al., 2014a; Schaefer et al., 2014a). While Pearson`s correlation is simple to compute it performs surprisingly well (Smith et al., 2011). However, its major problem is to induce indirect edges, so called trianglular edges. For example, if A is connected with B and B is connected with C then there is a high likelihood that A and C will be connected. The edge between A and C can arise from the variance that is unique for B and is considered as a false positive.
An approach to overcome this limitation is to exclude the unwanted variance using partial correlation: Before estimating the correlation between A and C, the variance from B will be subtracted out to remove indirect connections. However, regressing out a variable removes a degree of freedom and becomes problematic when the number of data points (degrees of freedom) in the rs-fMRI signal is smaller than the number of edges. The degrees of freedom in the resting state signal are limited as the majority of the power is between 0.01‒0.05 Hz (Schölvinck et al., 2010) and the relatively short scanning time of 15 minutes or less. Therefore, partial correlation is often not applicable to networks with more than 50 vertices. The problem of high dimensional data with a low number of data-points is not unique to neuroscience. One approach to address this problem is the assumption of a sparse network. In other words, only a few connections are necessary to explain the data. As it is difficult to find this sparse representation approximation algorithms are often employed (Friedman et al., 2008). In the neuroimaging community sparse approaches are beginning to be used but are far from being common (Varoquaux and Craddock, 2013).
8
analysis section in Study 1 (Margulies et al., 2010) and to other more recent reviews (Varoquaux and Craddock, 2013; Fornito et al., 2013).
1.5 White-Matter Lesions and Small Vessel Disease
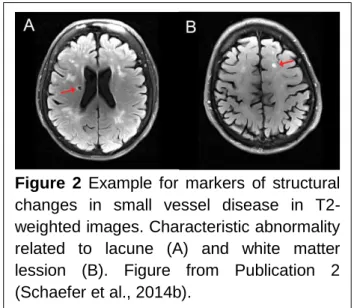
Functional brain networks are gray matter areas which communicate through white matter axons. Both white and gray matter can be damaged by vascular infarcts or lesions. MRI white matter abnormalities reflect lesions of subcortical and periventricular white matter as lacunes reflect cerebrospinal fluid (CSF)-filled cavities (Selnes and Vinters, 2006). White matter lesions may provide a good model to study the relationship between white matter connections and gray matter functional connectivity. In Study 2 (Schaefer et al., 2014b) we addressed the impact of white matter lesions on gray matter functional connectivity. Subsequently, we assessed the relevance of the connectivity changes to altered task performances in order to demonstrate the behavioral significance of our results.
Vascular white and gray matter lesions are also highly relevant in the clinical context. White matter hyper-intensities and lacunar infarcts are considered as evidence for small vessel disease. It is known that white matter lesions can lead to cognitive impairment which worsens with increasing lesion load (Longstreth et al., 2005). Accordingly, the presence of white matter lesions doubles the risk of a later dementia (Vermeer et al., 2003). Until recently the effect of white matter lesions onto brain function has been mainly assessed using task-based activation studies (Venkatraman et al., 2010; Aizenstein and Andreescu, 2011).
1.6 Transcranial Direct Current Stimulation
Changes in functional brain networks cannot only occur as a result of vascular lesions; they can also be induced by external stimulation. tDCS is a non-invasive brain stimulation technique which uses low currents delivered directly to a brain area via surface electrodes. The effect of tDCS onto brain function depends on depolarization or hyperpolarization in the neuronal membrane potential (Creutzfeldt et al., 1962; Nitsche et al., 2003a). Unilateral tDCS can be used to facilitate motor learning (Nitsche et al., 2003b). Recently, bilateral or bihemispheric tDCS over M1 has been suggested (Vines et al., 2008) and employed as an additional therapeutic tool for neurorehabilitation in stroke patients with motor deficits (Lindenberg et al., 2010; Bolognini et al., 2011). Bilateral tDCS of M1 might not only facilitate neural activity in the damaged hemisphere but additionally help to rebalance maladaptive interhemispheric interactions by inhibition of the contralesional motor cortex.
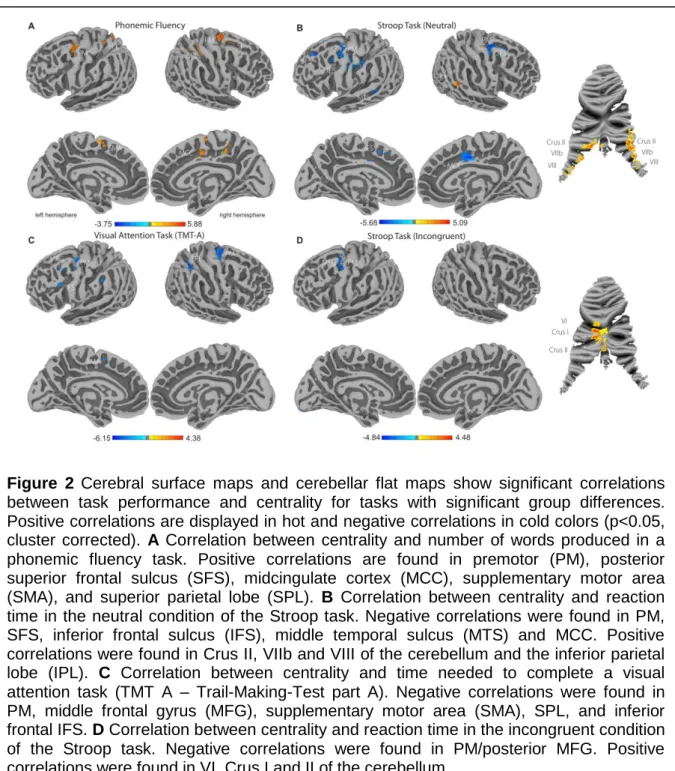
Figure 2 Example for markers of structural changes in small vessel disease in T2-weighted images. Characteristic abnormality related to lacune (A) and white matter lession (B). Figure from Publication 2 (Schaefer et al., 2014b).
9
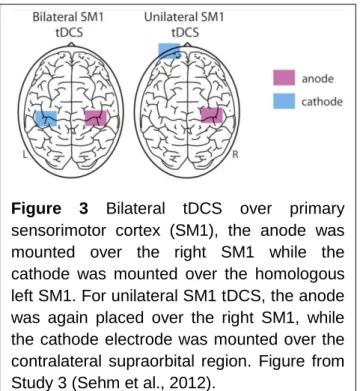
also be used as a tool to investigate brain function in healthy humans. In this context prefrontal tDCS has been shown to modulate the connectivity between large scale functional brain networks (Keeser et al., 2011). In Study 3 (Sehm et al., 2012) we investigated the effects of such stimulation on the supplementary motor cortex (Figure 3). We have used a data-driven whole brain graph-theoretical approach to analyze the impact of bilateral and unilateral tDCS (Figure 3) applied to the motor cortex during resting-state fMRI scans.
1.7 Dynamic Functional Connectivity
Until recently it was implicitly assumed that the functional connectivity during a task-free fMRI scan is constant. However, recent studies challenged this view by showing variations in the fMRI synchronization over the scan (Chang and Glover, 2010). These variations of connectivity were shown to be related to the electro encephalography (EEG) signal (Britz et al., 2010; Musso et al., 2010; Tagliazucchi et al., 2012) and are present in the absence of any head motion (Hutchison et al., 2013b). While dynamic connectivity could be a valuable tool for clinical applications its non artifactual origin needs to be validated by external measures (Hutchison et al., 2013a). Possible strategies are relating dynamic functional connectivity to ongoing electrophysiological measures (Tagliazucchi et al., 2012; Chang et al., 2013) or behavior (Thompson et al., 2013). In our analysis in Study 5 (Schaefer et al., 2014a) we show a relationship between the dynamic functional connectivity and ongoing self-generated-thoughts, as well as age.
In this thesis I want to show the applicability of the graph theoretic methods described in Publication 1 (Margulies et al., 2010) to investigate clinically relevant changes of functional brain networks. Further, we developed these methods further to enhance the relevance to the clinical realm and address changes of brain networks on even shorter time scales.
Figure 3 Bilateral tDCS over primary sensorimotor cortex (SM1), the anode was mounted over the right SM1 while the cathode was mounted over the homologous left SM1. For unilateral SM1 tDCS, the anode was again placed over the right SM1, while the cathode electrode was mounted over the contralateral supraorbital region. Figure from Study 3 (Sehm et al., 2012).
10
2.1 Resting developments: a review of fMRI post-processing methodologies for spontaneous brain activity
Margulies D., Böttger J., Long X., Lv Y., Kelly C., Schäfer A., Goldhahn D., Abbushi A., Milham M., Lohmann G. and Villringer A., Resting developments: a review of fMRI post-processing methodologies for spontaneous brain activity, Magnetic Resonance Materials in Physics, Biology and Medicine, 23(5‒6), 289‒307, 2010. The final publication is available at http://link.springer.com/article/10.1007%2Fs10334-010-0228-5.
(will be inserted by the editor)
Resting Developments
A review of fMRI post-processing methodologies for spontaneous brain activity Daniel S Margulies∗ · Joachim B¨ottger∗ · Xiangyu Long · Yating Lv ·
Clare Kelly · Alexander Sch¨afer · Dirk Goldhahn · Alexander Abbushi · Michael P Milham · Gabriele Lohmann · Arno Villringer
Received: date / Accepted: date
Abstract Analytic tools for addressing spontaneous brain activity, as acquired with fMRI during the “resting-state,” have grown dramatically over the past decade. Along with each new technique, novel hypotheses about the functional organization of the brain are also avail-able to researchers. We review six prominent categories of resting-state fMRI data analysis: seed-based func-tional connectivity, independent component analysis, clustering, pattern classification, graph theory, and two “local” methods. In surveying these methods, we ad-dress their underlying assumptions, methodologies, and novel applications.
Keywords resting state · functional connectivity · brain networks
Introduction
Entering a cocktail party with three friends, each of us might intermingle—meet new people, loiter by the hors d’œuvres—but throughout the evening we would ∗Authors contributed equally.
D.S. Margulies·X. Long·Y. Lv·A. Sch¨afer·D. Goldhahn·G. Lohmann·A. Villringer
Max Planck Institute for Human Cognitive and Brain Sciences Stephanstrasse 1a 04103 Leipzig, Germany Tel.: +49 341 9940-2256 Fax: +49 341 9940-2221 E-mail: [email protected] URL: http://www.cbs.mpg.de J. B¨ottger·A. Abbushi Department of Neurosurgery Charit´e – Universit¨atsmedizin Berlin C. Kelly·M.P. Milham
P. Green and R. C¯owen Institute for Pediatric Neuroscience New York University School of Medicine
no doubt exchange glances, watch for indications that all is well, or subtly communicate that it may be time to leave.
Upon exiting, the traditional mapping of new social connections might be discussed as we recount the peo-ple we met and the new connections that were formed. However, a much less tangible aspect of the social dy-namic is the intermittent communication that main-tained the link throughout the party.
These two facets of social connectedness find corre-lates in models of brain connectivity, which have been roughly categorized as either anatomical or functional. While anatomical connectivity may be understood as the concrete pathways of potential information exchange (such as collected phone numbers and email addresses in the social realm), functional connectivity may be bet-ter defined as the inbet-termittent inbet-teractions maintaining those lines of communication.
But how would we summarize and describe these dynamic connections? One early definition established functional connectivity as “the temporal correlation of a neurophysiological index measured in different brain areas” [1]; however, over the past two decades, the shift in focus beyond mere correlation has led to the devel-opment of increasingly complex frameworks to describe functional relationships between brain regions
In the case of our party, how would we describe the dynamic interactions throughout the evening? Would we chose an individual, perhaps a central figure such as the host, and describe her interactions with each of the guests (seed-based functional connectivity)? Would we map out the predominant lines of conversation (inde-pendent component analysis) or the cliques that formed and disassembled throughout the evening(clustering)? Would it be more appropriate to map and abstract the lines of communication (graph theory) or search for
de-lineating patterns of activity (pattern classification)? Or would we disregard the question of connectivity and simply describe the behavior of the guests individu-ally (“local” approaches)? Each of these approaches re-quires a unique methodology, each is based in specific assumptions about the structure of social interactions, and each implies an optimal description. Before begin-ning an analysis, it would be advantageous to consider these aspects—likewise, with respect to the brain.
Over the past decade, researchers examining func-tional connectivity using “resting-state” functional magnetic resonance imaging (fMRI) data have witnessed a dramatic increase in the analytic options for describing and summarizing the functional organi-zation of the brain. Although, by convention, we will of-ten use the term “resting-state” to denote the data for which these analyses have been largely developed, we also recognize the controversies surrounding this desig-nation [2, 3]. While other terms have been adopted to supplant “resting-state” (e.g., “intrinsic” and “sponta-neous” [4]), and, when contextually appropriate, have become practically interchangeable, we will maintain the convention of “resting-state” due to its referential role within the field’s literature. Nevertheless, it is cru-cial to recognize that the methods described here are not limited to data acquired during a “resting” condi-tion, and can equally be used as amodel-freeanalysis for anysteady-state fMRI data set (e.g., [5]).
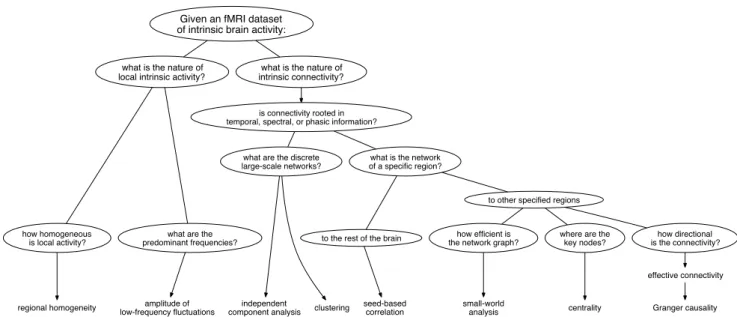
Numerous studies and reviews have explored the implications of various pre-processing steps (e.g., [6– 11]); however, only a few to date have broadly ad-dressed post-processing techniques (for a recent review of functional connectivity methodologies with empha-sis on the computational aspects, see: [12, 13,?]; or for emphasis on clinical applications, see: [14, 15]). In the following review, we will address the diverse array of post-procesing techniques available, with a focus on the theoretical presuppositions of each for exploring brain organization and function (see Fig. 1).
We will identify six analytic categories as they are applied to resting-state fMRI data:
1. seed-based functional connectivity 2. independent component analysis 3. clustering
4. pattern classification 5. graph theory
6. “local” methods1
We will discuss their different underlying theoretical as-sumptions and provide a basic methodological review 1 We use the term “local” to denote methods that do not ad-dress long-distance functional connectivity, but rather assess local voxelwise activity.
for their implementation. Such a framework may also help to highlight analytic techniques that could be fur-ther explored and developed. Given the wide scope of this review, we will only attempt a general intuition for the different measures. Thus, the aim of the cur-rent review will be to offer an introduction to analytic methodologies of resting-state fMRI data.
1 Seed-Based Functional Connectivity
Seed-based functional connectivity analysis is the corre-lation between activity in ana prioriregion-of-interest (ROI), or “seed region”, and activity in all other vox-els in the brain. Another widely used approach is to correlate the activity of several distributed ROIs.
The technique was initially applied to resting-state fMRI data by Bharat Biswal and colleagues in 1995 [16]. Using a seed region in the motor cortex, resting-state functional connectivity was shown to replicate patterns of motor task activation.
The straightforward statistics and comprehensible results have made seed-based functional connectivity a popular technique. But despite the statistical trans-parency, the technique suffers from the primary draw-back of requiring a priori selection of seed regions or reduction to a limited number of ROIs. Among the predominant techniques for determining functional con-nectivity, seed-based procedures are the most explicitly model-based [12].
1.1 Techniques
Seed-based analysis comprises two basic steps:
1. extraction of a model time-series from a specified area; and,
2. quantifying the similarity between the model time-series with the time-time-series from other voxels or ROIs. In its simplest form, the correlation of an averaged ROI time-series with all other voxels is clear-cut and easily implemented. Long-facilitated by general fMRI data processing software such as AFNI2 and SPM3, other software packages have recently emerged focusing specifically on streamlined processing of resting-state functional connectivity using MATLAB in conjunction with SPM: “REST”4and “MATLAB Toolbox for Func-tional Connectivity”5 [17]). 2 http://afni.nimh.nih.gov/afni/ 3 http://www.fil.ion.ucl.ac.uk/spm/ 4 http://sourceforge.net/projects/resting-fMRI/ 5 http://groups.google.com/group/fc-toolbox
Granger causality centrality small-world analysis seed-based correlation amplitude of
low-frequency fluctuations component analysisindependent clustering regional homogeneity
how efficient is the network graph?
where are the key nodes? how directional is the connectivity? effective connectivity how homogeneous is local activity?
what are the predominant frequencies?
what are the discrete
large-scale networks? of a specific region?what is the network
to the rest of the brain
to other specified regions what is the nature of
local intrinsic activity?
what is the nature of intrinsic connectivity?
is connectivity rooted in temporal, spectral, or phasic information?
Given an fMRI dataset of intrinsic brain activity:
Fig. 1 A flowchart of possible questions that could be addressed with current methodologies given a resting-state fMRI data set.
Over the past decade, assessing functional connec-tivity with seed-based approaches has expanded to in-clude assorted signal processing and statistical tech-niques aimed at extracting more refined and considered relationships between regions. The following overview will address several of the innovations developed for both steps of the seed-based analysis.
Time-series extractionfor a seed region raises is-sues regarding the most viable method to purify signal from a set of contiguous voxels. The conceptually basal method is averaging the value at each time point, thus cancelling out extraneous noise. A novel interactive implementation has recently been made available with the aforementioned analysis package AFNI. InstaCorr allows the selection of a seed region to be virtually si-multaneous with the mapping of the correlation map. It is possible to modify the radius of the seed region and the degree of spatial smoothing (traditionally im-plemented by defining the size of a Gaussian filter that assigns a value to each voxel based on the weighted av-erage of surrounding voxels), thus facilitating the explo-ration of these decisions on resultant correlation maps. The significance of seed size and spatial smoothing de-cisions becomes relevant when considering the signal-to-noise ratio of the data, assumptions about hemody-namic response throughout the brain, and the desired anatomical specificity of the resultant functional con-nectivity maps.
More computationally advanced alternatives, such asprincipal component analysis (PCA) have also been implemented for time-series extraction. Essentially, PCA transforms the seed region time-series into a set of “components” that successively account for the greatest
amount of variance in the data. Zhong and colleagues recently demonstrated that using PCA to extract the signal from an ROI for regression-based functional con-nectivity analysis could improve the accuracy and true positive rate for detecting the default-mode6and motor networks, when compared to averaging over the seed re-gion [21]. Their method has the advantage of combin-ing data-driven optimization of the model time-series with statistically straightforward model-driven regres-sion, thus capitalizing on the strengths of both tech-niques.
After a model time-series has been extracted, myr-iad statistical techniques are available for quantify-ing the relationship between the seed region and other voxels or ROIs. As each addresses different as-pects of the signal, each also implies specific hypotheses about the mode of communication assessed with func-tional connectivity. Theblood oxygen-level depen-dent (BOLD) signalreflects the response of deoxy-hemoglobin (deoxy-Hb) concentration to changes in local neuronal activity and is determined by vascu-lar (blood velocity, blood volume: “neurovascuvascu-lar cou-pling”) and metabolic (oxygen consumption: “neuro-metabolic coupling”) factors. The analytic tool employed inherently makes certain assumptions about the tempo-ral dynamics of the deoxy-Hb response across the entire brain.
6 The “default-mode network” consists of medial prefrontal, posteromedial, and inferior lateral parietal cortex, and received its name due to greater activity during the baseline “resting” condition [18, 19]. For a recent review, see: [20].
For instance, temporal correlation (or covari-ance) can describe synchronous fluctuations, whereas cross-correlationcan accommodate lags in communi-cation between areas. These approaches would be ap-propriate if neurovascular coupling were globally con-sistent; however, if we cannot make that assumption, then a statistical method which is insensitive to the temporal domain might be more suitable.
While cross-correlation quantifies the relation be-tween two signals in the time-domain, coherence op-erates equivalently in the frequency-domain. Coherence thus provides a means for assessing functional connec-tivity that is insensitive to inter-regional differences in neurovascular coupling dynamics [22, 23]. Shifts in the frequency spectrum do not alter the degree of coher-ence (just as lags in the time-domain do not alter cross-correlation coefficients), considering the low-frequency spectral band in which functional connectivity is de-tected [16, 24, 25], low-pass filtering at 0.1 Hz, or even lower, is an essential preprocessing step for this method. Higher frequencies due to cardiac or respiratory arti-facts would otherwise interfere in coherence analyses. Furthermore, different networks have been shown to correlate at distinct low-frequency bands at rest [26, 27], and are modulated in the low-frequency domain during motor task-involved [28] and cognitive effort [29].
Another approach, rather than looking at the mag-nitude of the spectral information, is to explore the phase-spectrum delaybetween regions. Sun and col-leagues developed a novel method of addressing latency between regions in conjunction with connectivity through the combined analysis of phase-delay and coherence [30].
When more than one seed region is analyzed, the specificity of functional connectivity to only one of the regions is a critical issue.Partial correlation(or mul-tiple regression) reveals the functional connectivity between a pair of regions, removing influences from others [31]. For example, partial correlation has been used to parcellate the thalamus with respect to cor-tical regions, by eliminating the influence of all other cortical regions [32]. The influential role of the postero-medial component of the default-mode network in the networks functioning has also been demonstrated using such methods [33].
The definition of functional connectivity is often de-scribed within the neuroimaging literature in contrast to effective connectivity, which addresses the direc-tionality of influence between regions. While numerous techniques have been developed to address causal inter-actions in fMRI data, one popular approach in resting-state analysis is Granger causality [34]. The analy-sis assumes that better prediction is an indication of
influence, and tests whether past values of time-series A better predict future values of time-series B than past values of time-series B alone. It has been used to address control of the default-mode network [35, 36] and the changing influences between networks with respect to age [37]. Nonetheless, due in part to tem-poral blurring induced by the hemodynamic response, the potential utility of effective connectivity to resting-state fMRI data, without experimental manipulation, remains a source of debate (see the sectionCorrelation and Causality in [13]) and methodological innovation (e.g., [38]). The rest of the current review, however, will focus on methods for the analysis of functional connec-tivity.
1.2 Applications
Early studies of resting-state functional connectivity fo-cused on describing well-charted neural systems from the cognitive neuroscience literature, such as the mo-tor cortical network [39, 40], visual network [41–43], a language network, including Broca’s and Wernicke’s ar-eas [44], a cerebellar-prefrontal network [45], and net-works based in the amydgala and hippocampus [40]. Of interest to the emergence of the“resting-state” fMRI re-search field, Greicius and colleagues were the first to use seed-based functional connectivity to map the default-mode network in 2003 [46], thus effectively linking the resting-state functional connectivity literature (whose lineage is traced to Bharat Biswal et al., 1995 [16]) with the “resting-state” of cognitive neuroscience (which emer-ged from Shulman et al., 1997 [18] and several publi-cations in 2001 by Marcus Raichle, Deborah Gusnard, and colleagues [47, 48]).
While a significant concern of these initial studies was to establish the validity of studying functional con-nectivity in the absence of an attributable cognitive or behavioral state, more recent research into resting-state functional connectivity has taken advantage of its strengths in order to address topics that are beyond the practical scope of task-based fMRI. For instance, the detection of functional subdivisions within com-plex regions usually requires large-scale meta-analysis (e.g., striatum [49], anterior cingulate [50], and cebellum [51]); however, systematic placement of seed re-gions throughout such rere-gions has revealed similar sub-divisions in striatum [52, 53], anterior cingulate [54], and cerebellum [55, 56], as well as amygdala [57, 58], me-dial temporal cortex [59], cross-modal auditory-visual connectivity during rest [60], and the red nucleus [61]. Other studies have observed the presence of novel sub-divisions with the precuneus [62] and the default-mode
network [36], somatotopic organization within the mo-tor cortex [63], differentiation of the dorsal and ventral attention streams [64], a hippocampal-parietal memory network [65], and a fronto-parietal control network [66]. The efficiency of these approaches for exploring func-tional neuroanatomy with data sets comprising merely dozens of participants, rather than a meta-analysis of an equal number of studies, is evident.
Furthermore, these approaches have been fruitful in cross-species animal research. The default-mode net-work is found in the anesthetized macaque monkey [67], as well as the posterior parahippocampal network [68], and posteromedial subdivisions reflecting the anatomi-cal tracing literature [62]. In the rat, the sensorimotor and visual networks have been mapped [69, 70]. The general flexibility of resting-state scanning has enabled rapid innovation for addressing cross-species questions using parallel non-invasive techniques.
Amidst these advances, the issue of how to best op-timize ROI-selection persists as the most evident weak-ness of seed-based approaches. Meta-analyses have pro-vided an effective strategy for probing specific distributed systems. For instance, in order to examine the test-retest reliability of resting-state data, Shehzad and col-leagues [71] specified 3 sets of regions of interest (ROIs), derived from four different and representative studies [72– 75]. However, the further development of computationally-oriented, a priori-free selection criteria is still much needed.
1.3 Discussion
In summary, seed-based approaches constitute one of the primary analytic strategies for resting-state data, and offer an unambiguous means of quantifying func-tional connectivity. The limitations ofa priori seed re-gion selection, size, and shape, are a substantial draw-back, as these choices can alter findings, and may bias the results. Furthermore, proper delineation of subdivi-sions becomes a methodological question in itself.
Potential solutions to these issues take the form of several other prominent methodologies (ICA, cluster analyses), which will be discussed in the following sec-tions.
2 Independent Component Analysis
Assuming the brain is organized into a number of func-tionally discrete networks, an optimal analytic tech-nique would determine the signals utech-nique to each net-work from the data alone.Blind source separation (ordecomposition) techniques address the problem of
determining distinct components within a set of signals with minimala prioriassumptions. Rather than requir-ing the specification of seed regions to derive networks, independent component analysis (ICA)has gained prominence in resting-state fMRI data analysis as a method to determine the spatial distribution of distinct functional connectivity networks [76–79]. In comparison with the aforementioned seed-based approaches, ICA offers several advantages:
– It does not require assumptions about locations of networks.
– Networks can be distributed, without a focal seed region.
– It can be conducted with minimal preprocessing, as noise is extracted as components during the analy-sis.
Nonetheless, ICA is not the perfect answer to functional connectivity analysis, as will become clear from a closer inspection of the methods.
2.1 Technique
The aim of ICA is to delineate maximally independent spatial or temporal components. As fMRI data gener-ally consists of more spatial than temporal data points, spatial ICA is more widely applied. Thus, ICA assumes that an fMRI data set consists of a mix of independent signals from a number of spatially distributed sources, and decomposes the data into several such independent components.
Many software tools are available to implement ICA. For example, probablistic ICA with MELODIC7is avail-able with FSL; GIFT and FIT8 can be applied using
SPM; cortex-based ICA can be conducted in BrainVoy-ager 20009; and ICASSO offers ICA reliability analy-sis10[80].
Although ICA claims to require no initial assump-tions, the approach does require specification of the number of components. While toolboxes such as MELO-DIC can automatically estimate this number through prior PCA-based estimation, in practice, the dimen-sions are often estimated by the user.
In deriving independent components, ICA extracts components due to “artifactual” signal such as scan-ner noise, head movement, and physiological “artifacts” (e.g., cardiac and respiratory signal) alongside function-ally meaningful networks. While the extraction of these
7
www.fMRIb.ox.ac.uk/fsl/melodic/index.html
8 http://icatb.sourceforge.net/
9 http://www.brainvoyager.com/BrainVoyager.htm 10 http://www.cis.hut.fi/projects/ica/icasso/
“noise” components is advantageous—such artifact ex-traction has even been proposed as a preprocessing step for seed-based correlation analysis [81]—it requires that the user exercises judgment in separating meaningful networks from noise components [82–85], or develop classification techniques [86], [84]. Thus, while minimal a priori assumptions are required, ICA does require substantial a posteriori selection of valid components, whether though visual inspection or automated meth-ods.
Group-level ICA analysisis a substantially more complicated issue due to the difficulty of selecting cor-responding components across individuals [87, 88]. The order of ICA components is unconstrained, and can-not be used for selection. One approach for classifying a network consistently across individuals is template matching [89, 90]. Individual-level independent com-ponents are first discarded based on temporal criteria (e.g., valid components must consist of characteristic low-frequencies). Then, all remaining individual-level components are compared to a set of researcher-defined spatial templates for “goodness of fit”. Although tem-plate matching is an effective means for consistent selec-tion of analogous networks across individuals, it relies on assuming appropriate templates.
Group-level ICA would seem like the obvious choice for their derivation; however, it too presents signifi-cant complications. One proposed solution is to conduct group-level ICA on co-registered and concatenated individual datasets. The group-level results of tempo-ral concatenation ICA (TC-ICA)can then be used as templates in order to derive individual-level maps. Such approaches have been fruitful in discerning dis-tinct cortico-cerebellar networks [91].
Dual-regression ICAhas recently been developed as a method to derive more accurate group-level com-parisons based on TC-ICA templates. After creating the templates, spatial regression is conducted on the individual level to extract a temporal model for a sec-ond temporal regression. The resultant statistical maps are then used for group-level analysis [92, 25, 93].
An alternative, proposed by Calhoun and collea-gues [94], addresses the problem of combining compo-nents across individuals. Rather than use a template-matching scheme, the individual data sets are entered into a single ICA analysis, and then back-reconstr-ucted. This procedure ensures that the components are consistently ordered across individuals.
Other automated group-level approaches aim to clus-ter components across subjects based on spatial config-urations (e.g.,partner-matching[95]).
2.2 Applications
ICA has been responsible for a significant shift in un-derstanding large-scale network structure in the brain. Owing to its exploratory, data-driven procedure, sev-eral networks were consistently classified across stud-ies and subject groups [78, 79, 96, 97]. ICA-derived net-works are consistent across participants [79] and scan sessions [98, 99], with the default-mode network demon-strating particularly robust reproducibility and cross-research selection reliability [100, 101]. ICA has been applied to infants as young as 24 weeks [102] and has also been widely used to study clinical populations (e.g., Alzheimer’s disease [89, 103], mild cognitive impairm-ent [104], depression [105], schizophrenia [106], Hunt-ington’s disease [107], lateral sclerosis [108], temporal lobe epilepsy [109], and non-communicative brain dam-aged patients [110]).
The impact of data-driven approaches such as ICA was demonstrated in a recent paper by Stephen Smith and colleagues [111]: 20 ICA components were extracted from resting-state data from 36 individuals, as well as 7,342 peak coordinates from the collection of functional studies contained in the BrainMap database. The sets of components were highly consistent, demonstrating the structural persistence of these functional networks at rest, and suggesting that these networks may provide a foundation for discerning the modular building-blocks of cognitive functions.
2.3 Discussion
Blind-source analysis methods are data driven, and do not require specification of seed-regions. However, they are nonetheless hypothesis driven, because the “true” number of components present in the data is not known, and has to be more or less empirically chosen (tech-niques for the automatic calculation of the number of components exist, and have demonstated high test-retest reliability, but there is poor concordance across the var-ious estimation algorithms [99]). The reproducibility of ICA is another significant challenge. The ICA algorithm begins with a random assumption with each iteration, thus producing results that are variable across analyses. Secondly, following component identification, the se-lection of meaningful components remains a problem. Manual selection through visual inspection is prone to human error. While automated methods are promising, they either rely on preexisting templates (i.e., template-matching) or are computationally intensive (i.e., back-reconstruction). Novel methods for automated ICA di-mensionality and group-level analysis is an area of on-going development. Nevertheless, the automaticity and
model-independence of ICA makes it a convenient tool for whole-brain functional connectivity analysis.
One fundamentally dubious assumption of ICA is the independence of network signals in the brain. Con-sidering the extraordinary degree of interconnectivity between the entire brain, striving to derive independent networks would not seem to be an effective method at generating a physiological plausible model of functional organization. Daubechies and colleagues have recently suggested that the ICA algorithms used in fMRI data analysis are tuned to detect sparsity, rather than inde-pendence [112], a more likely model.
3 Clustering
Although model-free approaches to resting-state func-tional connectivity, such as ICA, overcome one of the greatest problems associated with model-based (i.e., seed-based) approaches, namely, the dependence of findings on the initial selection of seed ROIs, these model-free approaches still entail a degree of subjectivity and hu-man judgment both in dimensionality estimation and in the selection of “meaningful” components or networks. One approach that is gaining popularity in the attempt to overcome these issues is the application of clustering techniques to resting-state data.
Clustering is essentially a family of mathematical techniques that searches for patterns in data. More spec-ifically, clustering is the unsupervised partitioning (clas-sification) of data into subsets (clusters) so that obser-vations assigned to the same cluster are more similar to one another than they are to observations assigned to another cluster.
In the context of resting-state functional connectiv-ity analysis, clustering algorithms have been used to partition the brain into groups (clusters) of voxels or regions that are functionally connected with one an-other [113], or that exhibit similar patterns of func-tional connectivity with the rest of the brain [115]. The former represents a method akin to ICA, aimed at de-tecting distinct large-scale resting state networks, while the latter is an emerging approach aimed at break-ing the brain down into its smallest detectable distinct functional units. The main results of these studies are briefly reviewed below, but it is worth noting that neu-roimaging applications of clustering approaches are not restricted to resting-state studies, as clustering has been applied to structural connectivity (e.g., diffusion ten-sor imaging), task activation and neurotransmitter re-ceptor data with equally impressive results (e.g., [124– 129]).
3.1 Technique
As we have noted, clustering is a family of techniques, and researchers face a plethora of options with regard to the specific clustering approach to apply to their data. In RSFC applications, those most commonly employed include:
– hierarchical clustering approaches, which start by treating each data point as a singleton cluster, then, as K decreases, successively merge previously established clusters (visualized as a dendrogram or tree) (e.g., [115, 130, 131, 114]);
– partitional clustering (such ask-means), which determine all K clusters at once, typically by at-tempting to minimize intra-cluster variance (e.g., [130, 132];
– spectral clustering approaches, which perform an eigendecomposition of (the graph Laplacian of) the similarity matrix as an initial data reduction step, then use one of the more standard clustering algorithms (e.g.,k-means) to perform the final par-tition of the data on the basis of the resultant matrix of eigenvectors (the data’s spectrum) (e.g., [113]). There are, of course, many other clustering techniques (e.g., non-metric clustering [133]), and the development and improvement of clustering methods is a topic of intense research in fields such as machine learning (e.g., [116]), which will be addressed in the following section onpattern classification.
3.2 Applications
In the first application of clustering techniques to resting-state functional connectivity data, Cordes and collea-gues [131] appliedhierarchical clustering using sin-gle linkage to frequency-specific inter-voxel correlations. Due to the computational complexity involved, the anal-ysis was limited to four slices covering auditory, mo-tor and visual cortex (1300-2400 voxels). They detected several, mostly bilateral clusters that were readily iden-tifiable as functionally distinct areas, including sensori-motor cortex, auditory cortex, fusiform gyrus and pri-mary visual cortex, as well as a number of “nuisance” clusters corresponding to CSF or other artifacts. Fur-thermore, they demonstrated that, for the majority of clusters detected, cardiac, respiratory and motion-related contributions to functional connectivity between the voxels were minimal.
Salvador and colleagues [114] used hierarchical clus-tering and multidimensional scalingto identify six networks. However, their methods formed clusters that grouped regions according to anatomical location (e.g.,
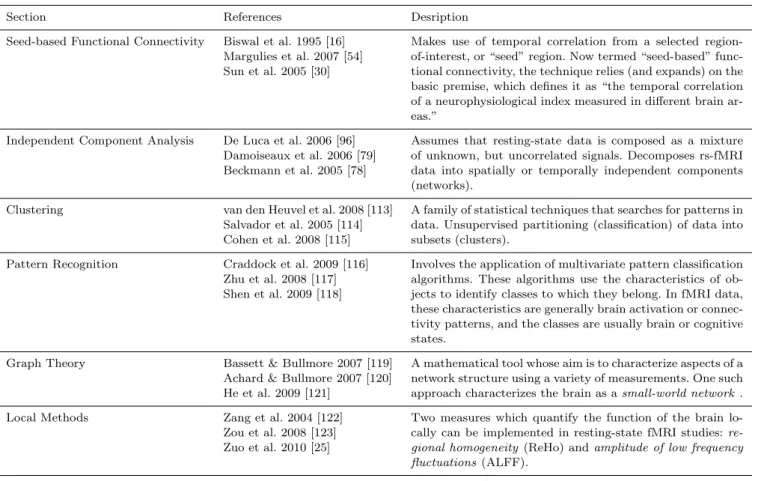
Table 1 A digest of some representative “resting-state” research articles for each section.
Section References Desription
Seed-based Functional Connectivity Biswal et al. 1995 [16] Margulies et al. 2007 [54] Sun et al. 2005 [30]
Makes use of temporal correlation from a selected region-of-interest, or “seed” region. Now termed “seed-based” func-tional connectivity, the technique relies (and expands) on the basic premise, which defines it as “the temporal correlation of a neurophysiological index measured in different brain ar-eas.”
Independent Component Analysis De Luca et al. 2006 [96] Damoiseaux et al. 2006 [79] Beckmann et al. 2005 [78]
Assumes that resting-state data is composed as a mixture of unknown, but uncorrelated signals. Decomposes rs-fMRI data into spatially or temporally independent components (networks).
Clustering van den Heuvel et al. 2008 [113]
Salvador et al. 2005 [114] Cohen et al. 2008 [115]
A family of statistical techniques that searches for patterns in data. Unsupervised partitioning (classification) of data into subsets (clusters).
Pattern Recognition Craddock et al. 2009 [116] Zhu et al. 2008 [117] Shen et al. 2009 [118]
Involves the application of multivariate pattern classification algorithms. These algorithms use the characteristics of ob-jects to identify classes to which they belong. In fMRI data, these characteristics are generally brain activation or connec-tivity patterns, and the classes are usually brain or cognitive states.
Graph Theory Bassett & Bullmore 2007 [119] Achard & Bullmore 2007 [120] He et al. 2009 [121]
A mathematical tool whose aim is to characterize aspects of a network structure using a variety of measurements. One such approach characterizes the brain as asmall-world network.
Local Methods Zang et al. 2004 [122]
Zou et al. 2008 [123] Zuo et al. 2010 [25]
Two measures which quantify the function of the brain lo-cally can be implemented in resting-state fMRI studies: re-gional homogeneity (ReHo) andamplitude of low frequency fluctuations(ALFF).
frontal, temporal, subcortical), and thus the resultant networks differ from the resting-state networks with which we are now more familiar. In contrast, Thirion and colleaguees [134] clustered coherence measures of resting-state data usingGaussian Mixture Models, and observed several plausible networks, including me-dial and lateral visual networks, and a bilateral fronto-parietal network, although consistency across the small subject sample was low.
Of course, many of these early clustering studies were limited by the computational capabilities avail-able at the time. As a result, researchers were required to reduce the volume of data entered into their analy-ses, either by acquiring data from only a limited num-ber of slices, rather than the whole brain [131], or by resampling the brain according to a parcellation scheme (e.g., [114, 134]).
More recently however, vast improvements in com-putational resources have made it possible to perform clustering analyses at the voxel level, permitting the performance of analyses at a finer scale that remains close to that of the original data. Consequently, there is increasing sophistication in the methods employed and,
most important, increasing convergence with the results of other resting-state analysis methods (e.g., ICA).
Two exemplars of this increased sophistication and convergence are provided by Van den Heuvel and col-leagues [113] and Bellec and colcol-leagues [130]. The first of these studies, by Van den Heuvel and colleagues, used spectral clustering, specifically, the Ncut method de-vised by Shi and Malik [135], to partition whole-brain grey matter on the basis of voxelwise functional connec-tivity (expressed as temporal correlation) in 26 partici-pants. One notable methodological advance detailed in their paper was the computation of a consistency ma-trix, which quantifies the frequency with which vox-els were assigned to the same cluster across partici-pants. In order to determine group-level clustering solu-tions, spectral clustering was performed on this consis-tency matrix, the result being a set of cluster solutions (networks) exhibiting the most consistent (stable) func-tional connectivity across subjects. Their analysis pro-duced seven networks, strikingly similar to those identi-fied using both seed-based analyses and ICA, including the default mode network, right and left fronto-parietal networks, and a sensorimotor/visual network.
In their paper, Bellec and colleagues [130] also made use of consistency matrices, in the context of a boot-strap approach to k-means clustering of resting state time series, which sought to identify the most stable large-scale networks (clusters) detectable at both the single-subject and group levels. Interestingly, this ap-proach, named “bootstrap analysis of stable clus-ters (BASC),” also identified seven networks that were remarkably similar to those identified in other studies, including the default mode, sensorimotor, visual and fronto-parietal networks. In addition, the authors drew attention to the fact that good stability was observ-able at finer spatial scales (i.e., larger numbers of clus-ters), and the likelihood of good agreement between solutions at these finer scales and the results of high dimensional ICA analyses, such as that those of Smith and colleagues [111] and Kiviniemi and colleagues [97]. Several other papers have directly focused on clus-tering at finer spatial scales. These studies have demon-strated the ability of clustering methods to identify the organization of the brain at the local level, in terms of its division into functionally distinct regions, rather than at the global level of large-scale networks.
For example, Mezer and colleagues [132] applied the k-means clustering algorithm to time-dependent mea-sures of functional connectivity to identify clusters in grey matter, white matter and thalamus that closely matched known anatomical distinctions in terms of cy-toarchitecture/microstructure (e.g., Brodmann’s areas) and morphology. Interestingly, Mezer and colleagues concluded that their results were primarily driven by non-functional contributions to the BOLD signal, such as head motion, a suggestion that seems overly-pessimistic in the context of their consistency with the resting-state literature.
A more optimistic tone is struck in work by Co-hen and colleagues [115], who performed voxelwise hi-erarchical clustering on the basis of the eta2 index,
which quantifies the pairwise similarity between voxels’ functional connectivity profiles. Cohen and colleagues showed that, in a single participant, hierarchical clus-tering was highly successful at partitioning regions ex-hibiting different functional connectivity profiles, thus likely constituting functionally distinct areas.
3.3 Discussion
In summary, clustering approaches applied to resting state data have proved highly successful at detecting known functional, anatomical and architectonic subdi-visions in the brain. They are not without their flaws however, with the most significant stumbling block be-ing that almost all available techniques require the user
to define a number of clusters (K) into which to par-tition the data. Because the true number of clusters is often unknown (referred to as the“cluster validity” problem), researchers typically compute multiple solu-tions, then use some metric of “goodness” to determine the “optimal” cluster solution from those produced. Un-fortunately, however, there is no single or best measure of solution optimality, and different studies have em-ployed different methods or sets of methods (e.g., sil-houette distance; linkage threshold; between-group sim-ilarity of clustering solutions; minimized Ncut cost; in-formation criteria). Ultimately, it is unlikely that clus-tering will escape the involvement of human judgment, as users have to assess the suitability of the cluster-ing results against known or hypothesized networks or functional subdivisions. However, the advantage of clus-tering approaches (as well as ICA approaches), is that this human judgment is incorporated at a high percep-tional cluster- or network-level, rather than during the early-stage ROI selection, as is required in seed-based approaches.
4 Pattern Classification
In recent yearsmultivariate pattern analysis (MVPA) (also referred to as multi-voxel pattern analysis) has gained increasing importance in fMRI data analy-sis (for reviews, see [136, 137]). Like other multivariate approaches (e.g., ICA, clustering) MVPA takes into ac-count multi-voxel patterns of brain activity or connec-tivity. Information contained in these patterns can then be decoded by applying powerful pattern-classification algorithms. This method thus incorporates spatially dis-tributed patterns of activity into the analysis, unlike univariate methods which treat every brain voxel inde-pendently.
MVPA has become a valuable fMRI data analy-sis method for classifying cognitive states and drawing relationships between neural activity (or connectivity) and these states. MVPA was mainly initiated in the do-main of visual perception [138–140], but was extended to other types of mental states as well [141]. MVPA has also been applied to the study of neural coding [137, 142], and utilized in the field of memory research [143].
4.1 Technique
In MVPA, pattern classification algorithms assign objects toclassesusing specificfeatures. In the anal-ysis of fMRI data, these characteristics are generally patterns of brain activation or connectivity and the