by
SANELISIWE THINASONKE DUZE BSc. (Hons) Genetics
Submitted in fulfillment of the academic requirements for the degree of Master of Science in The School of Life Sciences
University of KwaZulu-Natal Pietermaritzburg campus
November 2016
As the candidate’s supervisor I have approved this dissertation for submission.
Signed: Name: Dr S. Willows-Munro Date: 29 September 2016
Signed: Name: Dr C.Eardley Date: 29 September 2016
ADVISORY COMMITTEE
Supervisor
Dr Sandi Willows-Munro
School of Life Sciences Department of Genetics University of KwaZulu-Natal
Co-supervisor 1 Dr Connal Eardley
Plant Protection Research Institute Agricultural Research Council
Co-supervisor 2 Dr Dirk Swanevelder
Biotechnology Platform Agricultural Research Council
PREFACE
The experimental work described in this dissertation was carried out at the University of KwaZulu-Natal, Pietermaritzburg, in the Discipline of Genetics under the School of Life Sciences from March 2013 under the supervision of Dr S. Willows-Munro.
The study represents original work by the author and has not been submitted in any form to another University. Work done by other authors mentioned in this study has been duly acknowledged in the text.
DECLARATION OF PLAGIARISM
I, Sanelisiwe Thinasonke Duze declare that:
1. The research reported in this thesis, except where otherwise indicated, is my original research. 2. This thesis has not been submitted for any degree or examination at any other university. 3. This thesis does not contain other persons’ data, pictures, graphs or other information, unless specifically acknowledged as being sourced from other persons.
4. This thesis does not contain other persons' writing, unless specifically acknowledged as being sourced from other researchers. Where other written sources have been quoted, then:
a. Their words have been re-written but the general information attributed to them has been referenced
b. Where their exact words have been used, then their writing has been placed in italics and inside quotation marks, and referenced.
5. This thesis does not contain text, graphics or tables copied and pasted from the Internet, unless specifically acknowledged, and the source being detailed in the thesis and in the References sections.
ABSTRACT
DNA barcoding is an exciting tool that provides a way of identifying species effectively and rapidly. It involves the use of a short, standardized DNA sequence to assign species name to unknown specimens. For animals, a 658 bp long fragment of the mitochondrial gene, the cytochrome c oxidase subunit I (COI) is used as the standard barcode region. The success of
DNA barcoding is dependent on the absence of overlap between intraspecific and interspecific variation, i.e. barcoding gap. Although DNA barcoding has been successfully used across a number of insects; its adequacy in identifying Diptera species is still questioned. Also, many of the DNA studies on Diptera don’t include any African taxa, thus, it is unknown how successful DNA barcoding will be on our native Southern African taxa. In this study, the efficacy of using the COI gene as a barcode for the identification of Diptera species within eThekwini was
evaluated by examining the existence of the DNA barcoding gap for the South African Diptera and by testing the identification efficacy of this marker on Dipteran species using three distance-based methods: Near Neighbor (NN), Best Close Match (BCM) and BOLD Identification Criteria (BIC). A total of 844 barcodes from 1060 Diptera specimens collected from 14 localities within the eThekwini and surrounding areas were successfully sequenced. No barcoding gap was observed when intraspecific and interspecific sequence divergences were compared. Furthermore, the identification success of the three distance-based methods was low, ranging between 62% and 68%. The low identification success and the lack of barcoding gap in Diptera suggest that COI gene is not a good marker to use for species delimitation in Diptera. The MiSeq
sequencer from Illumina was then used in this study to construct a complete mitochondrial genome of one of the Diptera species (Lucilia cuprina: Calliphoridae) collected in eThekwini.
This complete mitochondrial genome together with 48 complete mitochondrial genomes of other Diptera species obtained from the National Center for Biotechnology Information (NCBI) Genome Database were used to explore other potential mitochondrial genes that can be used as DNA barcodes for the identification of Diptera species. Thirteen mitochondrial protein coding genes from 49 Diptera species were evaluated as potential DNA barcodes that can be used for the identification of Diptera species. The COI and the ATPase subunits 6 (ATP6) genes are potential
ACKNOWLEDGEMENTS
I thank God Almighty for His love and His grace toward me. “For since the creation of the world God’s invisible qualities, His eternal power and divine nature have been clearly seen, being understood from what has been made, so that people are without excuse, Romans 1: 20”.
Writing this dissertation has been one of the most significant academic challenges I’ve ever faced. This study would not have been completed without the support, guidance and encouragement of the following people; it is to them that I owe my deepest gratitude.
I owe my deepest gratitude to my supervisor, Dr. Sandi Willows-Munro. Thank you for not giving up on me and for your wise kind words and encouragement. Thank you for your guidance, motivation and making time for me. I really appreciated the quick feedback, the shouting but mostly encouragement.
Thank you to my co-supervisors Dr Connal Eardely and Dr Dirk Swanevelder
I acknowledge the National Research Foundation (NRF) and the University of KwaZulu-Natal for funding this project, the University of Guelph in Canada for their assistance and the eThekwini KwaZulu-Natal sandstone sourveld for providing support and guidance.
Cornerstone Assemblies of God church for making my stay in Pietermaritzburg fun and most memorable and for helping me grow spiritually and teaching me the ways of the Lord.
The past and present members of the UKZN Conservation Genetics Laboratory: Sohana Singh, Qiniso and Sihle Mthetwa, Andrinajoro Rakotoarivelo, Riel Coetzee and Ashreene Govender for making the lab a fun and a warm environment to be in and for their willingness to help.
Data collection for this project would not have been easy without the help of the SANBI interns. Thank you to Matabara, Patrick, Lorika and Vince for their assistance with field work and sorting of the insects.
Finally, I would like to thank the staff of the Department of Genetics at the University of KwaZulu-Natal – Dr. Pillay, Dr. Meusel, Mr. Dzomba, Mrs. Brunkhorst and Mr. Zondi for their support and assistance.
TABLE OF CONTENT
PREFACE ... iii
DECLARATION OF PLAGIARISM ... iv
ABSTRACT ... v
ACKNOWLEDGEMENTS ... vi
TABLE OF CONTENT ... vii
LIST OF ABBREVIATIONS ... x
LIST OF TABLES ... xii
LIST OF FIGURES ... xiv
LIST OF APPENDICES ... xvii
CHAPTER ONE: LITERATURE REVIEW ... 1
DNA BARCODING: A RAPID ASSESSMENT METHOD OF BIODIVERSITY FOR CONSERVATION ... 1
Abstract ... 1
1.1 Introduction ... 2
1.1.1 Biodiversity assessment ... 2
1.1.2 DNA barcoding ... 3
1.1.3 COI gene as a standard fragment for DNA barcoding ... 4
1.1.4 Methodology of DNA barcoding ... 4
1.1.5 Next generation sequencing and DNA barcoding ... 6
1.1.6 Prospects and problems of DNA barcoding... 7
1.2 References ... 8
CHAPTER TWO ... 17
THE UTILITY OF DNA BARCODING ON DIPTERA OF ETHEKWINI ... 17
Abstract ... 17
2.1 Introduction ... 18
2.2 Materials and methods ... 20
2.2.1 Study area: The eThekwini municipality ... 20
2.2.2 DNA extraction and COI amplification ... 23
2.2.3 Data analysis ... 24
2.3 Results ... 29
2.3.1 DNA Barcode Library for eThekwini Diptera ... 29
2.3.2 Sequence analysis ... 32
2.3.3 Barcoding gap ... 33
2.3.4 Species identification ... 36
2.4 Discussion ... 40
2.4.1 DNA barcode library for eThekwini Diptera ... 40
2.4.2 DNA barcoding gap ... 40
2.4.3 Distance-based species identification approach ... 41
2.4.4 Tree-based species identification approach: Phylogenetic analysis ... 43
2.5 Conclusion ... 43
2.6 References ... 44
CHAPTER THREE ... 51
DIPTERA MITOCHONDRIAL GENOME RECONSTRUCTION USING NEXT GENERATION SEQUENCING ... 51
Abstract ... 51
3.1 Introduction ... 51
3.2 Materials and methods ... 53
3.2.1 Specimen selection and DNA extraction ... 53
3.2.2 Nextera DNA sample preparation ... 54
3.2.3 Analysis of the next generation sequencing data ... 55
3.2.4 Mapping of sequence reads to a reference sequence ... 55
3.2.5 De novo assembly of the sequence reads ... 55
3.2.6 Annotation of the MtDNA ... 56
3.2.7 Nucleotide composition, strand asymmetry and codon usage ... 56
3.2.8 Secondary structure prediction for tRNA genes ... 57
3.2.9 Control region ... 57
3.3 Results ... 58
3.3.1 Sequencing, quality check and merging of overlapping sequence reads ... 58
3.3.2 Mapping Sequence Reads to a Reference Sequence ... 58
3.3.4 Features of assembled MtDNA (Contig 13) ... 60
3.3.5 Gene order, nucleotide composition and asymmetry of MtDNA (Contig 13) ... 61
3.3.6 Protein-coding genes ... 62
3.3.7 Codon usage ... 65
3.3.8 Transfer RNAs and ribosomal RNAs ... 66
3.3.9 Non-coding elements ... 69
3.4 Discussion ... 71
3.4.1 Consensus sequence generation ... 71
3.4.2 Species identification using the consensus sequence ... 72
3.4.3 Organization and characteristics of the MtDNA of PalGr3Dipt0701 ... 72
3.5 Conclusion ... 74
3.6 References ... 75
CHAPTER FOUR ... 79
EVALUATION OF MITOCHONDRIAL GENES AS POTENTIAL DNA BARCODES FOR DIPTERA ... 79
Abstract ... 79
4.1 Introduction ... 79
4.2 Materials and methods ... 81
4.2.1 Recovery of MtDNA sequences and protein-coding genes ... 81
4.2.2 Sequence alignment and phylogenetics ... 84
4.2.3 DNA barcoding gap for each protein-coding gene ... 84
4.3 Results ... 85
4.3.1 Sequence analysis ... 85
4.3.2 Phylogenetic analysis ... 86
4.3.3 DNA barcoding gap ... 93
4.4 Discussion ... 97
4.4.1 Phylogenetic analysis ... 97
4.4.2 DNA barcoding gap ... 98
4.5 Conclusion ... 99
LIST OF ABBREVIATIONS
AIC - Akaike Information Criterion ATP 6 – ATPase Subunit 6
ATP 8 – ATPase Subunit 8 BCM - Best Close Match BI - Bayesian Inference
BOLD - Barcode of Life Data System BIC - BOLD Identification Criteria BIN - Barcode Index Number
iBOL - International Barcode of Life
COI - Cytochrome C Oxidase Subunit I COII – Cytochrome C Oxidase Subunit II COIII - Cytochrome C Oxidase Subunit III Cytb - Cytochrome B Subunit
CR – Control Region DHU - Dihydrouridine
DNA - Deoxyribonucleic Acid
D’MOSS - Durban Metropolitan Open Space System ESS - Effective Sample Size
GTR + I+ G - Generalized-time Reversible + Invariant Sites + Gamma JM – Jeffries-Matusita
K2P – Kimura-Two-Parameter
matK - Megakaryocyte-associated Tyrosine Kinase MCMC - Markov Chain Monte Carlo
Mt – Mitochondrial
ML - Maximum Likelihood
NAD - NADH Dehydrogenase Subunits
NCBI - National Center for Biotechnology Information NGS- Next Generation Sequencing
NN - Nearest Neighbor NJ - Neighbor Joining
OUTs - Operational Taxonomic Units PCR - Polymerase Chain Reaction PCGs- Protein Coding Genes QC – Quality Check
rRNA- Ribosomal Ribonucleic Acid rbcL - Ribulose-bisphosphate Carboxylase SPIDER - Species Identity and Evolution, tRNA - Transfer Ribonucleic Acid
LIST OF TABLES
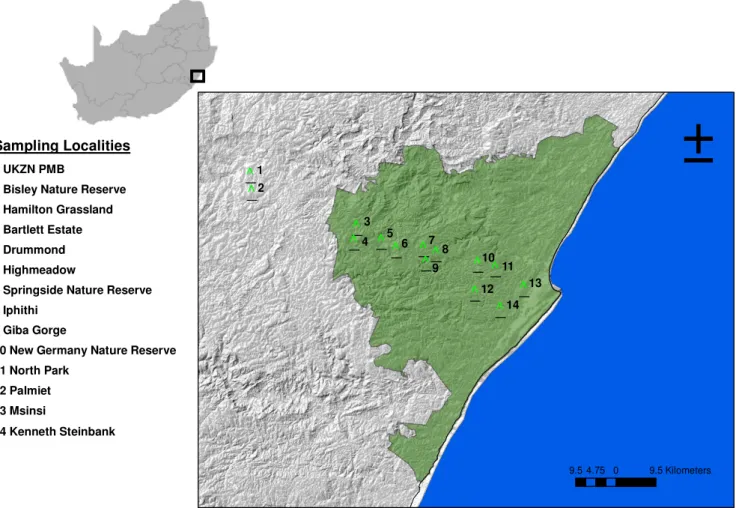
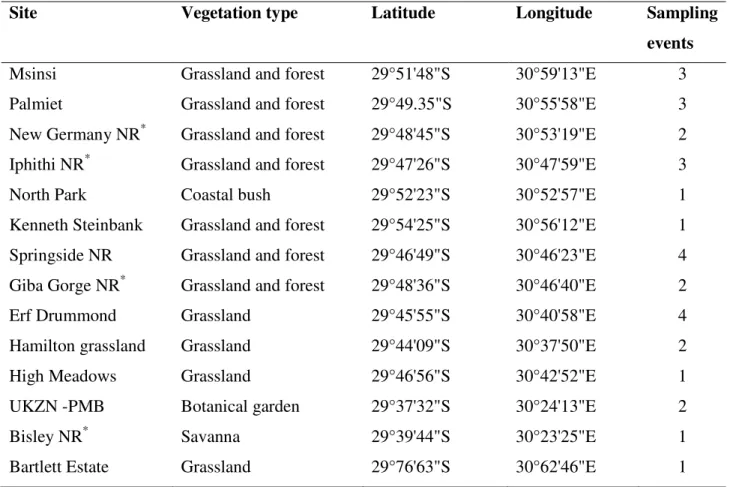
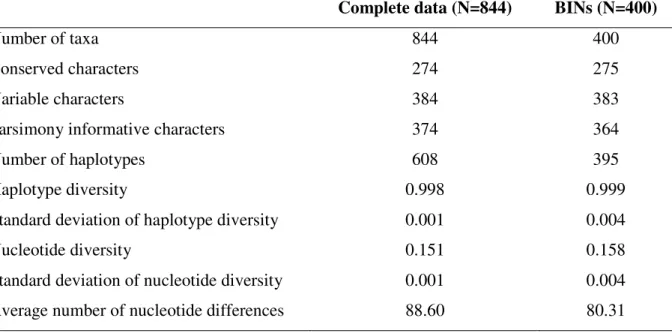
Table 2.1 List of sampled localities included in the study. Details of prominent vegetation type and number of separate sampling events are provided. NR – Nature Reserve………..23 Table 2.2 Taxonomic assignments for BINs that have a sequence similarity match greater than 95% based on searches on BOLD identification search engine………29 Table 2.3 Summary sequence statistics and diversity indices for alignment 844 Diptera of COI
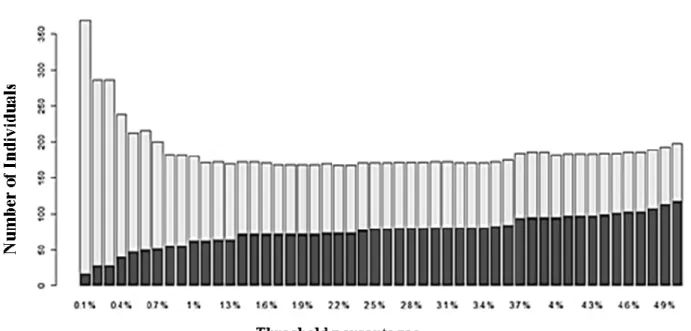
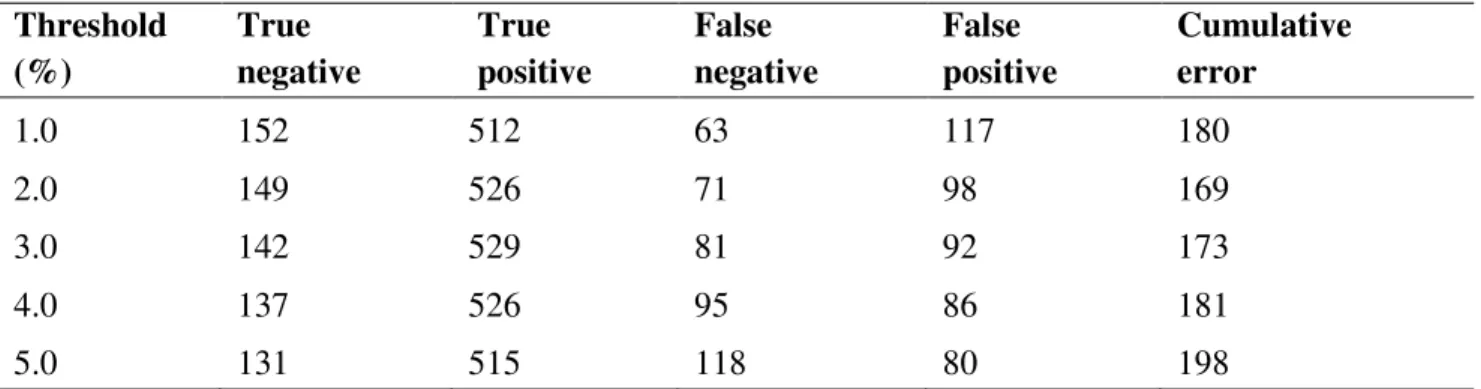
sequences as well as the sequence alignment comprising one representative of each BIN (400 BINs)………..32 Table 2.4 Threshold optimization analysis of the Diptera COI sequences at a range of thresholds
(1 – 5%)………..37 Table 2.5 Comparison between the three distance-based methods for measuring the identification success of the COI in discriminating against Diptera species. The numbers in bold
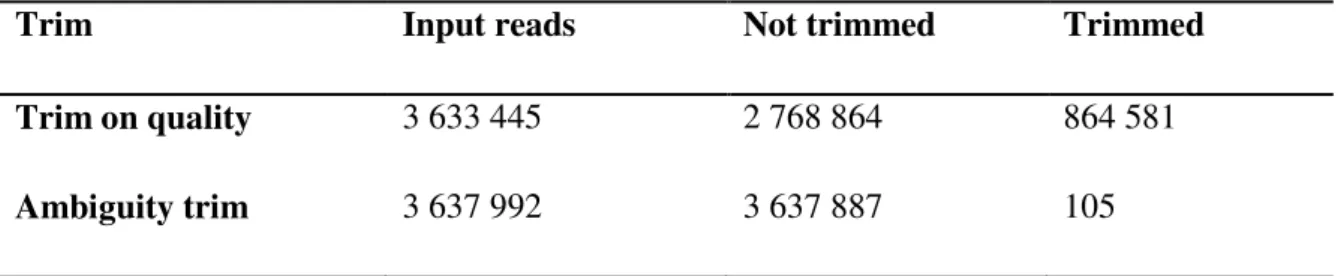
are the number of correctly identified individuals.………37 Table 3.1 DNA concentrations measured using both the Nanodrop 2000 spectrophotometer (Thermo Scientific) and the Qubit fluorometer (Thermo Fisher). The fly specimen highlighted in green was the specimen used for NGS since it had the highest DNA concentration. The asterisk (*) is the DNA concentration of PalGr3Dipt0701, measured using the Qubit………..54 Table 3.2 Number of paired-end sequence reads trimmed based on the quality check (QC). Removal of low quality sequences (limit =0.05) and removal of ambiguous nucleotides: maximal 2 nucleotides allowed. About 24% of the sequence reads were trimmed on quality, while 0.003% of the sequence reads were trimmed for ambiguity………..………….58 Table 3.3 Contig measurements generated in CLC genomics workbench, after the de novo assembly of all the trimmed and merged sequence reads. *N25 summarises the length of the biggest contigs until you reach 25% of the total contig length, N50 summarises the length of the biggest contigs until you reach 50% of the total contig length, and N75 summarises the length of the biggest contigs until you reach 75% of the total contig length………59
Table 3.4 Comparison of Contig 13 and four published Lucilia cuprina strains
(DI213.2-5)………...…….62 Table 3.5 Summary of all the genes found in Contig 13 and how they are arranged in the actual
genome. * Incomplete stop codon of NAD4. The “+” is the positive strand and “-” is the negative strand of the MtDNA of Contig 13………....63
Table 3.6 Codon usage of each amino acid in protein synthesis. The percentages for each amino acid are the percentages of the amino acids found among all the proteins (3636 a.a). This analysis also includes stop codons………...65 Table 3.7 Mitochondrial genome comparison of tRNA genes and rRNA genes between Contig 13 and four published Lucilia cuprina strains……….…..69
Table 3.8 Intergenic spacers found between the genes of the newly sequenced MtDNA (Contig 13) and their respective sizes. The genes surrounding the intergenic spacers are indicated with
the spacer region represented by a “………..………..…..70 Table 3.9 Nucleotide composition of the control region of Contig 13 compared to four published
Lucilia cuprina strains.………..71
Table 4.1 List of the Diptera species with complete and annotated mitochondrial genomes retrieved from the NCBI database……….………82 Table 4.2 Sequence lengths, number of conserved characters, variable characters and parsimony informative characters for each of the 13 PCGs extracted from the 49 Diptera species. The conserved characters, variable characters and parsimony informative characters are expressed as percentages in order to compare the differences between the genes……….86 Table 4.3 Total number of monophyletic relationship recovered for each of the 13 protein-coding genes Total number of monophyletic relationship recovered for each of the 13 protein coding genes. Currently the 49 MtDNA sequences used in the comparisons represent 11 families, 10 genera and 49 species.………...…………88
LIST OF FIGURES
Figure 2.1 Geographic distribution of sampling localities used in current study. The eThekwini municipal area is highlighted in green. The GPS coordinates of sites are listed in Table 2.1……….………..22 Figure 2.2 Results for the presence of the barcoding gap on the eThekwini data (left panel) and South Africa data (right panel). Density distributions of intraspecific and interspecific genetic divergences were calculated using K2P model (A) and GTR + I + G model (B) for both datasets ………34 Figure 2.3 Density distributions of intraspecific and interspecific divergences of ten Diptera families. These families were chosen as they have at least 20 COI
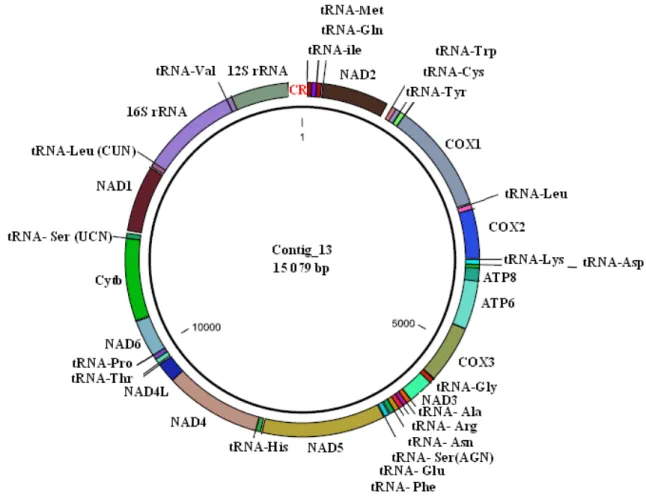
sequences……….……….……….35 Figure 2.4 Bar-plot showing the false positive (light grey) and false negative (dark grey) rate of identification success for Diptera species collected in eThekwini as the threshold is changed……….……….36 Figure 2.5 Bar-plots of the identification success accuracy measured using the BIC (A) and the BCM (B) at a range of thresholds (1 – 5%)………...38 Figure 2.6 Maximum likelihood tree of one representative individual per BIN, only the major families are colour coded on the tree. The branches in black represent Diptera families that had less than three representatives and families that were not monophyletic. The tree was rooted at midpoint……….39 Figure 3.1 Map of the mitochondrial genome of Lucilia cuprina (Contig 13). All 13
protein-coding, 2 ribosomal and 22 transfer RNA genes are present. The control region is located between 12S rRNA and tRNA-ile……….….60 Figure 3.2 Figure 3.2 Alignment of Contig 13 and Lucilia cuprina D213.5 to compare the order
annotated in Contig 13. The arrows on the genes indicate the direction of
transcription………...61 Figure 3.3 Illustration of how the start and stop codons of all the protein-coding genes were identified in DOGMA. [A] is the actual illustration of what is seen in DOGMA, [B] is the enlarged circled segment of [A], to show clearly the start codon of NAD2 and [C] is the NAD2
sequence of MtDNA. As seen in the diagram, the start codon of NAD2 is ATT (green colour).
The species name in [B] shows the NAD2 protein sequences that matched the NAD2 sequence of
the MtDNA………...……….……….…...…63 Figure 3.4 Putative secondary structure folds for the tRNAs of Contig 13 MtDNA using ARWEN software. Watson-Crick base pairs designated by “–“ or “!” and G–T base pairs by “+”………..67 Figure 3.5 Alignment of the nucleotide sequences of the CR of Contig 13 and four of the
published Lucilia cuprina strains (DI213.2-5)………...70
Figure 4.1 Maximum likelihood tree of the COI gene. Only bootstrap values above 50 and
Bayesian posterior probabilities above 0.5 are shown………...89 Figure 4.2 Maximum likelihood tree of the COII gene. Only bootstrap values above 50% and
Bayesian posterior probabilities above 0.5 are shown………...90 Figure 4.3 Maximum likelihood tree of the ATP6 gene. Only bootstrap values above 50% and
Bayesian posterior probabilities above 0.5 are shown………...91 Figure 4.4 Maximum likelihood tree of the NAD2 gene. Only bootstrap values above 50% and
Bayesian posterior probabilities above 0.5 are shown………...92 Figure 4.5 Maximum likelihood [A] and Bayesian tree [B] of the NAD4L gene. Only bootstrap
values above 50% and Bayesian posterior probabilities above 0.5 are shown………...…..93 Figure 4.6 Line plot of the barcode gap for the ATP 6 and the COI genes. The grey lines
represent the furthest intraspecific distance (bottom of line value), and the closest interspecific distance (top of the line value). The red lines show where this relationship is reversed………..94
Figure 4.7 Line plot of the barcode gap for the ATP8, COII, COIII and Cytb genes. The grey
lines represent the furthest intraspecific distance (bottom of line value), and the closest interspecific distance (top of the line value). The red lines show where this relationship is reversed………. 95 Figure 4.8 Line plot of the barcode gap for the six NADH dehydrogenase subunits (NAD1 to NAD6, NAD4L). The grey lines represent the furthest intraspecific distance (bottom of line
value), and the closest interspecific distance (top of the line value). The red lines show where this relationship is reversed………..96
LIST OF APPENDICES
Appendix 1 Neighbour-joining tree (K2P) of all 844 specimens of Diptera represented in the DNA barcode library for eThekwini………104 Appendix 2 Annotated phylogenetic tree of one individual per BIN, the major families are colour coded on the tree. The annotations on the tree are Diptera ID numbers assigned in BOLD. The red coloured taxa had sequence similarities >95%...114 Appendix 4.1 Maximum likelihood tree of the ATP8 gene. Only bootstrap values above 50%
and Bayesian posterior probabilities above 0.5 are shown………..115 Appendix 4.2 Maximum likelihood tree of the Cytb gene. Only bootstrap values above 50% and
Bayesian posterior probabilities above 0.5 are shown……….116 Appendix 4.3 Maximum likelihood tree of the COIII gene. Only bootstrap values above 50%
and Bayesian posterior probabilities above 0.5 are shown……….….117 Appendix 4.4 Maximum likelihood tree of the NAD1 gene. Only bootstrap values above 50%
and Bayesian posterior probabilities above 0.5 are shown………..…118 Appendix 4.5 Maximum likelihood tree of the NAD3 gene. Only bootstrap values above 50%
and Bayesian posterior probabilities above 0.5 are shown………..119 Appendix 4.6 Maximum likelihood tree of the NAD4 gene. Only bootstrap values above 50%
and Bayesian posterior probabilities above 0.5 are shown………..……120 Appendix 4.7 Maximum likelihood tree of the NAD5 gene. Only bootstrap values above 50%
and Bayesian posterior probabilities above 0.5 are shown………..121 Appendix 4.8 Maximum likelihood tree of the NAD6 gene. Only bootstrap values above 50%
CHAPTER ONE: LITERATURE REVIEW
DNA BARCODING: A RAPID ASSESSMENT METHOD OF
BIODIVERSITY FOR CONSERVATION
Abstract
The earth’s biodiversity is vanishing at an accelerated rate, this increases the need to protect and catalogue biodiversity. Conservation planning begins with an inclusive evaluation of regional biodiversity. The knowledge of species richness in a particular habitat and understanding the life history, endemism, range of morphological and genetic variability as well as the evolutionary history of the species are all part of biodiversity assessment. Thus, species inventories have become an important factor for conservation planning. The use of key morphological characters has in the past been the main method for species identification. However, this method has a number of limitations and often relies on well-trained taxonomists. DNA barcoding is a method that can be used to facilitate species identification, which can complement the traditional morphology-based approach. DNA barcoding has been successfully used in a number of species and has proven its utility as a tool for a rapid assessment of animal and plant diversity. In animals, a short, standardized mitochondrial cytochrome c oxidase subunit I (COI) gene is used
as the DNA “barcode” to rapidly and effectively identify species. In plants, barcoding concentrates on the chloroplast’s large subunit of the ribulose-bisphosphate carboxylase (rbcL)
and the megakaryocyte-associated tyrosine kinase (matK) genes. This literature review will
summarize the protocols involved in DNA barcoding. The review will focus on the COI gene as
the standard gene for DNA barcoding animals, the methodology of DNA barcoding, the role of next generation sequencing on DNA barcoding as well as the prospects and problems associated with using DNA barcoding in the identification of insects, in particular Diptera.
1.1
Introduction
1.1.1 Biodiversity assessment
An overwhelming proportion of the earth’s biodiversity is vanishing (Pimm et al. 2014; Ceballos et al. 2015) with taxa facing the challenges of habitat destruction, fragmentation and degradation,
and also biological invasions (Iii et al. 2000; deVere 2008; Butchart et al. 2010; Pimm et al.
2014; Ceballos et al. 2015). All these factors lead to a decrease in biodiversity. This is
particularly true for endemic species with small distribution ranges.
Species are the essential building block of natural history (Goerge & Mayden 2001). Therefore, species inventories are an important component of most conservation strategies. Often in conservation related fields, “species” are regarded as the “smallest unit” of biodiversity (Goerge & Mayden 2001; Agapow et al. 2004), making it important to correctly identify species.
Taxonomic knowledge and identification tools are still limited or absent for many groups, especially in the hyper diverse groups such as arthropoda. Therefore, methods that will accelerate and simplify the process of species identification are required to protect native and threatened species and preserve the natural biodiversity of the ecosystem (Waugh 2007; Renaud
et al. 2012).
Traditionally, species identification is based on key morphological characters that are taxon specific. These are often presented in the so called taxonomic identification keys, for specific levels. However, this method is usually time consuming and requires well-trained and experienced taxonomists – often with experts focusing only on a specific group of taxa. In addition, there are a number of limitations associated with the use of only morphological characters in taxonomy. First, phenotypic plasticity in some morphological features used for species identification can easily lead to identification errors (Hebert et al. 2003a; Waugh 2007).
Second, this method often overlooks morphologically cryptic taxa (Jarman & Elliott 2000). Third, the morphological keys used in traditional morphology-based species identification are often effective only for a particular life stage or gender of a species hence many individuals cannot be identified (Hebert et al. 2003a; Pili et al. 2010). Finally, the taxonomy of many taxa
technology has introduced the possibility of using variations in short sequences of DNA as “labels” or “tags” for species identification, a concept known as DNA barcoding (Hebert et al.
2003a).
1.1.2 DNA barcoding
DNA barcoding is a molecular method that uses short, standardized genomic fragments to facilitate species identification and discovery. The standard sequence region is called a DNA barcode because, like a “barcode tag” for products in a supermarket, they are unique identifiers for a particular species (Jinbo et al. 2011). This method was first proposed by Hebert et al.
(2003a) where a “universal” primer set was used to amplify a 648 bp region of the mitochondrial cytochrome c oxidase subunit I (COI) gene in a group of moths. This small section of the
mitochondrial genome has been found to be useful for species level identifications in animals over a broad range of biological specimens (Hebert et al. 2003a).
To promote DNA barcoding as a global standard for sequence-based species identification of eukaryotes, the International Barcode of Life (iBOL) proposed and initiated the Barcode of Life
project in 2004. This international barcode of life project seeks to develop a standard protocol for DNA barcoding and to construct a comprehensive DNA barcode reference library of all life on earth (Dasmahapatra & Mallet 2006; Hajibabaei et al. 2007; Ratnasingham & Hebert 2007). An
online database, the Barcode of Life Data System (BOLD; www.barcodinglife.org) is available to
acquire, store, analyse and manage DNA barcode records (Ratnasingham & Hebert 2007).
The efficiency of DNA barcoding as well as the need to have a panel of reference species barcodes to which one can compare unidentified specimens has prompted efforts to construct DNA barcode reference libraries for various animal groups (Ekrem et al. 2007; Lee et al. 2011;
Zhou et al. 2011; Webb et al. 2012). These DNA barcode libraries not only aid the
documentation of biodiversity (Janzen et al. 2005) including endangered species (Elmeer et al.
1.1.3 COI gene as a standard fragment for DNA barcoding
The ability of DNA barcoding to distinguish between species is largely dependent on the gene region being used as the barcode. This gene region must have a slow enough mutation rate to minimize intraspecific (between individual of the same species) variation but be sufficiently variable to highlight interspecific (between different species) variation (Hebert et al. 2003a).
Moreover, it must be easy to amplify in a range of taxonomically distinct taxa and should have few insertions and deletions to facilitate sequence alignment (Hebert et al. 2003a).
The mitochondrial COI gene was identified as a suitable region to be used in DNA barcoding of
animals. Present in every eukaryotic organism, it is diverse enough to be able to differentiate between most animal taxa at the species level. Additionally, it can be easily amplified and sequenced using a universal primer set (Hebert et al. 2003a). The priming sites of the region are
located within highly conserved amino acid sequences, which in turn ensures that primers will be broadly applicable (Moritz & Cicero 2004). The COI gene is protein-coding gene and contains
few indels which makes it easy to align (Jinbo et al. 2011).
1.1.4 Methodology of DNA barcoding
The methodology used for DNA barcoding is fairly simple. Genomic DNA is extracted from the organism of interest. The barcode region (i.e. COI gene) is then amplified using polymerase
chain reaction (PCR) with barcode targeting primers. The amplified barcode is then sequenced, usually using Sanger sequencing. The barcode of the organism of interest is then compared to barcode sequences in a reference library, which were derived from individuals of known species. The unknown organism is identified if its sequence closely matches one in the barcode reference library (Hajibabaei et al. 2007; Ratnasingham & Hebert 2007).
The comparison of an unknown barcode with sequences from the reference library is done through the construction of a multiple sequence alignment which is then used to construct a cladogram using the distance-based neighbor-joining (NJ) or similar method (Ratnasingham & Hebert 2007). This method usually uses the Kimura-2-Parameter (K2P) model to calculate genetic distance between taxa. Related individuals are clustered together (Hajibabaei et al. 2007;
values can still be used to assign the specimen to a genus or a family (Ratnasingham & Hebert 2007).
The success of DNA barcoding is ultimately dependent on completeness of the DNA reference library and on the absence of overlap between intraspecific and interspecific divergence, a concept known as the “barcoding gap” (Meyer & Paulay 2005; Aliabadian et al. 2009). For a
DNA barcoding gap to occur, the amount of genetic variation within species should be much smaller than the amount of variation between species and this allows species to be easily distinguished (Meyer & Paulay 2005). The DNA barcoding gap is essential for accurate species discrimination and underlies both specimen identification and species discovery (Chapple & Ritchie 2013). The more overlap there is between intraspecific and interspecific divergences the less effective barcoding becomes (Meyer & Paulay 2005).
An overlap between intraspecific and interspecific divergence could be attributed to recent speciation and interspecific hybridization of taxa (van Velzen et al. 2012b). Recently diverged
species share similar DNA barcode sequence, which could prevent accurate identification by barcoding using COI alone (Nichols 2001; Chapple et al. 2012; van Velzen et al. 2012a). This
situation is not often observed in insects and most studies focused on insect taxa have successfully used DNA barcoding for the molecular identification of a broad variety of insect taxa, including Ephemeroptera (Ball & Hebert 2005; Ebert & Ebb 2005), Trichoptera (Zhou et al. 2011), Lepidoptera (Hausmann et al. 2011; Strutzenberger et al. 2011), Hymenoptera (Smith
& Fisher 2009; Zaldívar-riverón et al. 2011), Hemiptera (Deister et al. 2014; Tembe et al. 2014),
Coleoptera (Raupach et al. 2010; Woodcock et al. 2013), Arachnida (Blagoev et al. 2013;
Blagoev et al. 2016) and Diptera (Jordaens et al. 2015; Pinto et al. 2015). However, very few of
these studies have actually checked for the presence of a DNA barcoding gap.
The success of DNA barcoding is also affected by the sequence divergence threshold used to delimit species (Smith et al. 2005; Chapple & Ritchie 2013). The use of sequence divergence
thresholds is usually effective for species identification because levels of barcode variation within species are highly conserved while deep sequence divergence usually occurs between different species (Hebert et al. 2003b). For separating species, sequence divergence thresholds
between 1-3% have usually been used (Hebert et al. 2003a; Hebert et al. 2003b). The BOLD
species. However, different thresholds can be used to identify species in different taxonomic groups. For example,Hebert et al. (2003b) was able to correctly identify approximately 98% of
Lepidopteran species identified through conventional morphological taxonomy at a threshold of 3%, while a 2.7% threshold correctly assigned 90% of the 260 recognized bird species from North America (Hebert et al. 2004). Furthermore, Smith et al. (2005) suggested a 2–3%
threshold as suitable for ant species. In some animal groups the use of COI sequence divergence
threshold has been less successfully applied. This is due to the fact that in some animal groups the mutational rate of the COI is either too slow i.e Cnidarian and sponges (Shearer et al. 2002;
Park et al. 2007) or too fast e.g. aves, gastropods and amphibians (Remigio & Hebert 2003) to
accurately delimit species.
1.1.5 Next generation sequencing and DNA barcoding
The current protocol used in DNA barcoding is based on the PCR amplification of the COI gene
followed by Sanger sequencing. This approach has proven robust and effective when applied to a few samples (Galan & Page 2012) and has been successfully used for the construction of sequence libraries such as BOLD (Hajibabaei et al. 2011). However, Sanger sequencing
becomes inefficient and expensive when scaled up to thousands of samples. Moreover, difficulties such as heteroplasmy (several mitochondrial genomes co-existing within the same cell) or Numts (copies of MtDNA that integrated into nuclear genome) further complicate the task of species identification using the Sanger sequencing techniques (Richly & Leister 2004; Rubinoff et al. 2006; Galan & Page 2012).
The introduction of high throughput Next Generation Sequencing (NGS) technology has revolutionized molecular biology in recent years. These technologies allow researchers to generate vast amounts of sequence data in a relatively short space of time (Bybee et al. 2011).
More importantly, NGS technology has led to the development of a novel barcoding methods, for a fast and accurate identification of large number of species (Hajibabaei et al. 2011; Galan &
Page 2012). There are currently two major NGS technologies available: SOLiD technology (Life Technologies, USA) and Illumina technology (Illumina, USA) The SOLiD technology was introduced by Applied Biosystems in 2007 as their NGS platform and it utilizes a sequence-by oligo-ligation-technology. Two versions of the SOLiD platform are commercially available: the
5500 system and the 5500xl system with 100 Gb and 250 Gb sequencing capacity respectively (Shokralla et al. 2012).
The Illumina sequencing platform was also introduced in 2007. This technology utilizes a sequence-by-synthesis approach, coupled with bridge amplification on the surface of a flow cell. There are currently five versions of the Illumina sequencer commercially available: The MiniSeq, MiSeq, NestSeq, HiSeq and HiSeq X. These Illumina platforms can generate sequence output ranging between 8 Gb to 1800 Gb per run (Shokralla et al. 2012). These technologies
provide billions of sequence reads in a single experiment, while the traditional Sanger sequencing utilizing a single capillary per sample (Taberlet & Coissac 2012).
Recent increases in fragment sizes amplified using Illumina platforms have made them acceptable for barcode studies. Currently, Illumina (MiSeq) can produce 300 bp paired-end reads with a maximum output of 15 Gb per run. Furthermore, the MiSeq system is cost effective, offers an easy, fast sequencing workflow and turn-around, it has high yields as well as datasets with high quality scores (Illumina 2014).
1.1.6 Prospects and problems of DNA barcoding
Several studies have demonstrated the efficiency of DNA barcoding in different animal groups (Hebert et al. 2003a; Hebert et al. 2003b; Hebert et al. 2004; Ward et al. 2005; Hajibabaei et al.
2006; Cander & Kuntner 2015; Dona et al. 2015). In particular, DNA barcoding has been
successfully used to identify various insect species and other animal species including mites (Cander & Kuntner 2015), cryptic bee species (Murray et al. 2007), mosquito species in
Colombia (Rozo-Lopez & Mengual 2015), sand flies in India and Colombia (Kumar et al. 2012;
Gutierrez et al. 2014) and Nearctic black flies (Rivera & Currie 2009). Moreover, DNA
barcoding has been used to enhance taxonomic investigations (Droege et al. 2010) and
investigate the validity of morphological keys (Carolan et al. 2012). However, the adequacy of
DNA barcoding in the identification of Diptera is still in question (Meier et al. 2006; Virgilio et al. 2010). In particular, Meier et al. (2006) reported a remarkably low identification success in
Diptera (<70% identification success). Furthermore, DNA barcoding has been criticized as it relies on a single mitochondrial gene region for identification and can be misleading especially in
the face of widespread mitochondrial paraphyly and polyphyly (Blaxter 2004; Will & Rubinoff 2004). Failure of the barcode marker to accurately discriminate species could be attributed to factors such as recent speciation (Nichols 2001; van Velzen et al. 2012a), interspecific
hybridization (Chapple et al. 2012) and incomplete DNA barcode reference libraries (Hebert et al. 2004).
The current study will begin the construction of the DNA barcode library of the Diptera of eThekwini. The DNA barcode library will be used to test the efficiency of the COI region as a
DNA barcode for the identification of the South African Diptera species by examining the existence of a barcoding gap as well as testing the identification efficacy on Diptera species using three distance-based methods: Near Neighbor (NN), Best Close Match (BCM) and Bold Identification Criteria (BIC). The study will also use NGS technology to construct a complete mitochondrial genome of a Diptera species (Lucilia cuprina: Calliphoridae). This complete
mitochondrial genome together with 48 complete mitochondrial genomes of other Diptera species obtained from the National Center for Biotechnology Information (NCBI) Genome Database will be used to explore other potential mitochondrial genes that can be used as DNA barcodes for the identification of Diptera species.
1.2
References
Agapow P.M., Binind-Emonds O.R.P., Crandall K.A., Gittleman J.L., Mace G.M., Marshall J.C. & Purvis A. (2004) The impact of species on biodiversity studies. The Quarterly Review of Biology 79, 161-79.
Aliabadian M., Kaboli M., Nijman V. & Vences M. (2009) Molecular identification of birds: performance of distance based DNA barcoding in three genes to delimit parapatric species. PLoS ONE 4, 1-8.
Ball S.L. & Hebert P.D.N. (2005) Biological identification of mayflies (Ephemeroptera) using DNA barcodes. Journal of North American Benthological Society 24, 508-24.
Blagoev G.A., Dewaard J.R., Ratnasingham S., Stephanie L., Lu L., Robertson J. & Telfer A.C. (2016) Untangling taxonomy: a DNA barcode reference library for Canadian spiders.
Molecular Ecology Resources 16, 325-41.
Blagoev G.A., Nikolova N.I., Sobel C.N., Hebert P.D.N. & Adamowicz S.J. (2013) Spiders (Araneae) of Churchill, Manitoba: DNA barcodes and morphology reveal high species diversity and new Canadian records. BMC Ecology 13, 1-17.
Blaxter M.L. (2004) The promise of a DNA taxonomy. Philosophical Transactions of the Royal Society, Biological Sciences 359, 669-79.
Bossuyt F., Meegaskumbura M., Beenaerts N., Gower D.J., Pethiyagoda R., Roelants K., Mannaert A., Wilkinson M., Bahir M.M., Manamendra-arachchi K., Oommen O.V. & Milinkovitch M.C. (2004) Local endemism within the Western Ghats – Sri Lanka biodiversity hotspot. Science 306, 479-82.
Butchart S.H.M., Walpole W., Collen B., Strien A.V., Scharlemann J.P.W., Almond R.E.A., Baillie J.E., Bomhard B., Brown C., Bruno J., Carpenter K.E., Carr G.M., Chanson J., Chenery A.M., Csirke J., Davidson N.C., Dentener F., Foster M., Galli A., Galloway J.N., Genovesi P., Leverington F., Loh J., McGeoch M.A., McRae L., Minasyan A., Morcillo M.H., Oldfield T.E.E., Pauly D., Quader S., Revenga C., Sauer J.R., Skolnik B., Spear D., Stanwell-Smith D., Stuart S.N., Symes A., Tierney M., Tyrrell T.D., Vie J.C. & Watson R. (2010) Global Biodiversity: indicators of recent declines. Science 328, 1164-8.
Bybee S.M., Bracken-Grissom H.D., Hermansen R.A., Clement M.J., Crandall K.A. & Felder D.L. (2011) Directed next generation sequencing for phylogenetics: an example using Decapoda (Crustacea). Journal of Comparative Zoology 250, 497-506.
Cander K. & Kuntner M. (2015) DNA barcoding gap: reliable species identification over morphological and geographical scales. Molecular Ecology Resources 15, 268-77.
Carolan J.C., Murray T.E., Fitzpatrick Ú., Crossley J., Schmidt H., Cederberg B., McNally L., Paxton R.J., Williams P.H. & Brown M.J.F. (2012) Colour patterns do not diagnose
species: quantitative evaluation of a DNA barcoded cryptic bumblebee complex. PLoS ONE 7, 1-11.
Ceballos G., Ehrlch P.R., Barnosky A.D., García A., Pringle R.M. & Palmer T.M. (2015) Accelerated modern human-induced species losses: Entering the sixth mass extinction.
Science Advances 19, e1400253.
Chapple D.G., Birkett A., Miller K.A., Daugherty C.H. & Gleeson D.M. (2012) Phylogeography of the endangered Otago Skink, Oligosoma otagense: population structure, hybridisation
and genetic diversity in captive populations. PLoS ONE 7, 1-11.
Chapple D.G. & Ritchie P.A. (2013) A retrospective approach to testing the DNA barcoding method. PLoS ONE 8, 1-12.
Dasmahapatra K.K. & Mallet J. (2006) DNA barcodes: recent successes and future prospects.
Heredity 97, 254-5.
Deister F., Raupach M.J., Hendrich L., Ku S.M. & Gossner M.M. (2014) Building up of a DNA barcode library for true bugs (Insecta: Hemiptera: Heteroptera) of Germany reveals taxonomic uncertainties and surprises. PLoS ONE 9, 1-13.
deVere N. (2008) Biodiversity. Modern Taxonomy and Fieldwork, 1-12.
Dona J., Diaz-Real J., Mironov S., Bazaga P., Serrano D. & Jovani R. (2015) DNA Barcoding and minibarcoding as a powerful took for feather mites studies. Molecular Ecology Resources, 1-10.
Droege S.A.M., Rightmyer M.G., Sheffield C.S. & Brady S.G. (2010) New synonymies in the bee genus Nomada from North America (Hymenoptera: Apidae). Zootaxa 32, 1-32.
Ebert P.A.U.L.D.N.H. & Ebb J.E.M.W. (2005) Biological identifications of mayflies
(Ephemeroptera) using DNA barcodes. Journal of North American Benthological Society
Ekrem T., Willassen E. & Stur E. (2007) A comprehensive DNA sequence library is essential for identification with DNA barcodes. Molecular Phylogenetics and Evolution 43, 530-42.
Elmeer K., Almalki A. & Mohran K.A. (2012) DNA barcoding of Oryx leucoryx using the
mitochondrial cytochrome c oxidase I gene. Genetics and Molecular Research 11,
539-47.
Galan M. & Page M. (2012) Next generation sequencing for rodent barcoding: species identification from fresh, degraded and environmental samples. PLoS ONE 7, 1-13.
Goerge A. & Mayden R.L. (2001) Species concepts and the endangered species act: how a valid biological definition of species enhances the legal protection of biodiversity. Natural Resoures Journal 32, 371-405.
Gutierrez M.A.C., Vivero R.J., Velez I.D., Porter C.H. & Uribe S. (2014) DNA barcoding for the identification of snad fly species (Dipera, Psychodidae, Phlebotominae) in Colombia.
PLoS ONE, 1-9.
Hajibabaei M., Janzen D.H., Burns J.M., Hallwachs W. & Hebert P.D.N. (2006) DNA barcodes distinguish species of tropical Lepidoptera. PNAS 103, 968-71.
Hajibabaei M., Shokralla S., Zhou X., Singer G.A.C. & Baird D.J. (2011) Environmental barcoding: a next generation sequencing approach for biomonitoring applications using river benthos. PLoS ONE 6, 1-7.
Hajibabaei M., Singer G.A.C., Hebert P.D.N. & Hickey D.A. (2007) DNA barcoding: how it complements taxonomy, molecular phylogenetics and population genetics. Trends in Genetics 23, 167-72.
Hausmann A., Haszprunar G. & Hebert P.D.N. (2011) DNA Barcoding the Geometrid fauna of Bavaria (Lepidoptera): Successes, Surprises and Questions. PLoS ONE 6, 1-9.
Hebert P.D.N., Cywinska A., Ball S.L. & Waard J.R.D. (2003a) Biological identifications through DNA barcodes. Proceedings of the Royal Society, Biological Sciences 270,
Hebert P.D.N., Ratnasingham S. & deWaard J.R. (2003b) Barcoding animal life: cytochrome c oxidase subunit I divergences among closely related species. Proceedings of the Royal Society, Biological Sciences 270, 1-4.
Hebert P.D.N., Stoeckle M.Y., Zemlak T.S. & Francis C.M. (2004) Identification of birds through DNA barcodes. PLoS Biology 2, 1-7.
Iii F.S.C., Zavaleta E.S., Eviner V.T., Naylor R.L., Vitousek P.M., Reynolds H.L., Hooper D.U., Lavorel S., Sala O.E., Hobbie S.E., Mack M.C. & Díaz S. (2000) Consequences of changing biodiversity. Nature 405, 234-42.
Illumina (2014) http://www.illumina.com/systems/miseq/system.ilmn.
Janzen D.H., Hajibabaei M., Burns J.M., Hallwachs W., Remigio E. & Hebert P.D.N. (2005) Wedding biodiversity inventory of a large and complex Lepidoptera fauna with DNA barcoding. Philosophical Transactions of the Royal Society, Biological Sciences 360,
1835-45.
Jarman S.N. & Elliott N.G. (2000) DNA evidence for morphological and cryptic Cenozoic speciations in the Anaspididae, ‘living fossils’ from the Triassic. Journal of Evolutionary Biology 13, 624-33.
Jinbo U., Kato T. & Ito M. (2011) Current progress in DNA barcoding and future implications for entomology. Entomological Science 14, 107-24.
Jordaens K., Goergen G., Virgilio M. & Backeljau T. (2015) DNA barcoding to improve the taxonomy of the Afrotropical hoverflies (Insecta: Diptera: Syrphidae). PLoS ONE, 1-15.
Kumar N.P., Srinivasan R. & Jambulingam P. (2012) DNA barcoding for identification of sand flies (Diptera: Psychodidae) in India. Molecular Ecology Resources 12, 414-20.
Lee W., Kim H., Lim J., Choi H.R., Kim Y., Kim Y.S., Ji J.Y., Foottit R.G. & Lee S. (2011) Barcoding aphids (Hemiptera: Aphididae) of the Korean Peninsula: updating the global data set. Molecular Ecology Resources 11, 32-7.
Meier R., Shiyang K., Vaidya G. & Ng P.K.L. (2006) DNA barcoding and taxonomy in Diptera: a tale of high intraspecific variability and low identification success. Systematic Biology
55, 715-28.
Meyer C.P. & Paulay G. (2005) DNA barcoding: error rates based on comprehensive sampling.
PLoS Biology 3, 422-5.
Moritz C. & Cicero C. (2004) DNA barcoding: promise and pitfalls. PLoS Biology 2, e354-e.
Murray T.E., Fitzpatrick Ú., Brown M.J.F. & Paxton R.J. (2007) Cryptic species diversity in a widespread bumble bee complex revealed using mitochondrial DNA RFLPs.
Conservation Genetics 9, 653-66.
Nichols R. (2001) Gene trees and species trees are not the same. Trends in Ecology and Evolution 16, 358-64.
Park M.H., Sim C.J., Baek J. & Min G.S. (2007) Molecules and identification of genes suitable for DNA barcoding of morphologically indistinguishable Korean Halichondriidae sponges. Molecules and Cells 23, 220-7.
Pili E., Carcangiu L., Oppo M. & Marchi a. (2010) Genetic structure and population dynamics of the biting midges Culicoides obsoletus and Culicoides scoticus: implications for the
transmission and maintenance of bluetongue. Medical and Veterinary Entomology 24,
441-8.
Pimm S.L., Jenkins C.N., Abell R., Brooks T.M., Gittleman J.L., Joppa L.N., Raven P.H., Roberts C.M. & Sexton J. (2014) The biodiversity of species and their rates of extinction, distribution, and protection. Science. 201344:1246752
Pinto I.D.S., Dias B., Alencastre A., Rodrigues F., Ferreira A.L., Rezende H.R., Bruno R.V., Falqueto A., Andrade-filho J.D., Aparecida E., Galati B., Helena P., Shimabukuro F., Brazil R.P. & Peixoto A.A. (2015) DNA barcoding of Neotropical sand flies species identification and discovery PLoS ONE, 1-18.
Ratnasingham S. & Hebert P.N.D. (2007) BOLD: The Barcode of Life Data System (www.barcodinglife.org). Molecular Ecology Notes 7, 355-64.
Raupach M.J., Astrin J.J., Hannig K., Peters M.K., Stoeckle M.Y. & Wägele J.-w. (2010) Molecular species identification of Central European ground beetles (Coleoptera: Carabidae) using nuclear rDNA expansion segments and DNA barcodes. Frontiers in Zoology 7, 1-15.
Remigio E. & Hebert P.N.D. (2003) Testing the utility of partial COI sequences for phylogenetic
estimates of gastropod relationships. Molecular Phylogenetics and Evolution 29, 641-7.
Renaud A.K., Savage J. & Adamowicz S.J. (2012) DNA barcoding of Northern Nearctic Muscidae (Diptera) reveals high correspondence between morphological and molecular species limits. BMC Ecology 12, 1-15.
Richly E. & Leister D. (2004) NUMTs in sequenced eukaryotic genomes. Molecular Biology and Evolution 21, 1081-4.
Rivera J. & Currie D.C. (2009) Identification of Nearctic black flies using DNA barcodes (Diptera: Simuliidae). Molecular Ecology Resources 9 224-36.
Rozo-Lopez P. & Mengual X. (2015) Mosquito species (Diptera, Culicidae) in three ecosystems from Colombian Andes: identification through DNA barcoding and adult morphology.
ZooKeys 513, 39-64.
Rubinoff D., Cameron S. & Will K. (2006) A genomic perspective on the shortcomings of mitochondrial DNA for "barcoding" identification. Journal of Heredity 97, 581-94.
Shearer T.L., Van Oppen M.J.H., Romano S.L. & Wrheide G. (2002) Slow mitochondrial DNA sequence evolution in the Anthozoa (Cnidaria). Molecular Ecology 11, 2475-87.
Shokralla S., Spall J.L., Gibson J.F. & Hajibabaei M. (2012) Next generation sequencing technologies for environmental DNA research. Molecular Ecology 21, 1794-805.
Smith M.A. & Fisher B.L. (2009) Invasions, DNA barcodes and rapid biodiversity assessment using ants of Mauritius. Frontiers in Zoology 12, 1-12.
Smith M.A., Fisher B.L. & Hebert P.D.N. (2005) DNA barcoding for effective biodiversity assessment of a hyperdiverse arthropod group: the ants of Madagascar. Philosophical Transactions of the Royal Society Biological Sciences 360, 1825-34.
Sourakov A. & Zakharov E.V. (2011) “Darwin’s butterflies”? DNA barcoding and the radiation of the endemic Caribbean butterfly genus Calisto (Lepidoptera, Nymphalidae, Satyrinae).
Comparative Cytogenetics 5, 191-210.
Strutzenberger P., Brehm G. & Fiedler K. (2011) DNA barcoding based species delimitation increases species count of Eois (Geometridae) moths in a well studied tropical mountain forest by up to 50%. Insect Science 18, 349-62.
Taberlet P. & Coissac E. (2012) Towards next generation biodiversity assessment using DNA metabarcoding. Molecular Ecology 33, 2045-50.
Tembe S., Shouche Y. & Ghate H.V. (2014) DNA barcoding of Pentatomomorpha bugs (Hemiptera: Heteroptera ) from Western Ghats of India. Meta Gene 2 2, 737-45.
van Velzen R., Weitschek E., Felici G. & Bakker F.T. (2012a) DNA barcoding of recently diverged species: relative performance of matching methods. PLoS ONE 7, e30490-e.
van Velzen R., Weitschek E., Felici G. & Bakker F.T. (2012b) DNA barcoding of recently diverged species: relative performance of matching methods. PLoS ONE 7, 1-12.
Virgilio M., Backeljau T., Nevado B. & De Meyer M. (2010) Comparative performances of DNA barcoding across insect orders. BMC Bioinformatics 11, 206-.
Ward R.D., Zemlak T.S., Innes B.H., Last P.R. & Hebert P.D.N. (2005) DNA barcoding Australia's fish species. Philosophical Transactions of the Royal Society, Biological Sciences 360, 1847-57.
Waugh J. (2007) DNA barcoding in animal species: progress, potential and pitfalls. Bioessays
29, 188-97.
Webb J.M., Jacobus L.M., Funk D.H., Zhou X., Kondratieff B., Geraci C.J., DeWalt R.E., Baird D.J., Richard B., Phillips I. & Hebert P.D.N. (2012) A DNA barcode library for North American Ephemeroptera: progress and prospects. PLoS ONE 7.
Will K.W. & Rubinoff D. (2004) Myth of the molecule: DNA barcodes for species cannot replace morphology for identification and classification. Cladistics 20, 47-55.
Woodcock T.S., Boyle E.E., Roughley R.E., Kevan P.G., Labbee R.N., Smith A.B.T., Goulet H., Steinke D. & Adamowicz S.J. (2013) The diversity and biogeography of the Coleoptera of Churchill: insights from DNA barcoding. BMC Ecology 13, 1-15.
Wyman S.K., Jansen R.K. & Boore J.L. (2004) Automatic annotation of organellar genomes with DOGMA. Bioinformatics 20, 3252-5.
Zaldívar-riverón A., Martínez J.J., Ceccarelli F.S., Jesús-bonilla V.S.D., Rodríguez-pérez A.C., Smith M.A., Martínez J.J., Ceccarelli F.S., Jesús-bonilla V.S.D., Rodríguez-pérez A.C., Reséndiz-flores A. & Jose J. (2011) DNA barcoding a highly diverse group of parasitoid wasps (Braconidae: Doryctinae) from a Mexican nature reserve The Journal of DNA Mapping, Sequencing and Analysis 1736, 18-23.
Zhou X., Robinson J.L., Geraci C.J., Parker C.R., Flint O.S., Etnier D.A., Ruiter D., DeWalt R.E., Jacobus L.M. & Hebert P.D.N. (2011) Accelerated construction of a regional DNA-barcode reference library: caddisflies (Trichoptera) in the great smoky mountains national park. Journal of the North American Benthological Society 30, 131-62.
CHAPTER TWO
THE UTILITY OF DNA BARCODING ON DIPTERA OF ETHEKWINI
Abstract
The mitochondrial cytochrome c oxidase subunit 1 (COI) gene has been widely used as a
standard DNA barcode sequence for the identification of species that belong to many animal groups, including Diptera. However, some authors have suggested that its performance is of limited use in the separation of Diptera species because of the overlap between intraspecific and interspecific sequence divergence or the lack of a DNA barcoding gap. In this study the performance of the COI gene as a barcode for the identification of South African Diptera was
evaluated. A total of 844 COI fragments were successfully sequenced from 1060 Diptera
specimens collected from 14 localities within the eThekwini municipality, South Africa. Two analyses for evaluating the performance of the COI region were conducted, the first analysis
tested for the presence of the barcoding gap using the Kimura-two-Parameter (K2P) model which is a standard model used by the barcoding community and the General Time Reversible (GTR) + Invariant Sites (I) + Gamma (G) model. The Jeffries-Matusita (JM) was used to test for separability of the intraspecific and interspecific sequence divergences. The second analysis assessed the proportion of correct species identified using three species identification criteria namely: Near Neighbor (NN), Best Close Match (BCM) and the BOLD Identification Criteria (BIC). Our results showed a significant overlap between interspecific and intraspecific sequence divergence using the K2P model (JM = 0.220), however when the GTR + I + G substitution model was applied there was no significant overlap between interspecific and intraspecific sequence divergences (JM = 1.818). This result suggested that the model choice is important in establishing the presence of the DNA barcoding gap and the widely used K2P model may not always be an appropriate model for use in DNA barcoding. Relatively moderate identification success (<70%) was obtained for all three species identification criteria: NN = 577 (68%); BCM = 546 (65%) and BIC= 526 (62%). The overlap between the intraspecific and interspecific sequence divergence (using K2P as utilized on BOLD) together with the low identification
success suggests limited performance of the COI region for the identification of South African
Diptera.
Key Words: eThekwini municipality, Diptera, DNA barcoding, barcoding gap
2.1
Introduction
The order Diptera contains winged insects commonly known as flies. This order includes all true flies namely, crane flies, robber flies, fruit flies, gnats, midges and mosquitoes. All members have distinctive hind wings that are reduced to small, club-shaped structures called halters (Meyer 2009). This order is extremely diverse and is one of the three largest and most taxon-rich animal groups in the world, with 188 currently recognized families and about 120,000 described species (Skevington & Dang 2002; Rambaut 2009; Wiegmann et al. 2011). Diptera is divided
into two main sub-orders: Nematocera and Brachycera (Szymura et al. 1996). The Nematocera
are small delicate flies with segmented antennae, long legs and thin wings, while members of Brachycera are much larger and more robust (Serna et al. 2004).
Dipterans play a significant role in the healthy functioning of ecosystems. They are involved in the decomposition of plants and animals. Diptera also facilitate the breakdown and release of nutrients back to the soil (Meyer 2009). They are also among the most important groups of pollinating organisms second only to the Hymenoptera (Ssymank et al. 2008) and were among
the first pollinators that are linked to the early angiosperm radiation (Endress 2001). Diptera species are often linked to the plants they visit (Menges 1991). A number of publications have reported large-scale parallel declines of pollinators and plants, reinforcing the concern that pollination, as an important ecosystem services, is at risk (Menges 1991; Biesmeijer et al. 2006;
Potts et al. 2010).
The first step in conservation planning is an inclusive evaluation of regional biodiversity, starting with species identification. However, morphology-based identifications are often difficult on taxon-rich animal groups such as Diptera. Indeed, morphology-based species identification in Diptera is mainly based on differences in male genitalia (Pili et al. 2010). The larvae and females
2007). Therefore, well-trained taxonomists with a high level of expertise are often required to correctly identify species belonging to this order.
DNA barcoding provides an alternative way of identifying species effectively and rapidly (Hebert et al. 2003b). In animals, the short, standardized mitochondrial cytochrome c oxidase
subunit I (COI) gene is used as the DNA “barcode”. This DNA barcode has been successful used
in a broad range of invertebrates including Lepidoptera (Hebert et al. 2004a), Formicidae (Smith et al. 2005), Hemiptera (Park et al. 2011), Hymenoptera (Magnacca & Brown 2012) and
Arachnida (Blagoev et al. 2013). The COI barcode has also been successfully used in the
identification of species belonging to the order Diptera (Rivera & Currie 2009; Kumar et al.
2012; Versteirt et al. 2014), however, it’s wide-spread reliability has been questioned (Meier et al. 2006; Virgilio et al. 2010). In particular, Meier et al. (2006) reported a remarkably low
identification success when using barcoding in Diptera (<70% identification success) when compared to other insect orders.
This low identification success of DNA barcoding in Diptera using COI barcode was mainly
attributed to an overlap between intraspecific and interspecific sequence divergence (Meier et al.
2006). Indeed, species identification using DNA barcoding is only reliable and effective if there is a significant difference between the average intraspecific and interspecific sequence divergence (Meyer & Paulay 2005; Chapple & Ritchie 2013). Furthermore, successful DNA barcoding is affected by the sequence divergence threshold used to differentiate species. For separating species, sequence divergence thresholds between 1-3% has been used (Hebert et al.
2003a; Hebert et al. 2003b). However, the literature suggests that no single threshold is optimal
for all species (Ferguson 2002; Hebert et al. 2003a; Hebert et al. 2004a; Smith et al. 2005;
Chapple & Ritchie 2013). Therefore, it is important to choose an appropriate threshold for each taxonomic group studied.
Spatial scale is another factor that affects species identifications using DNA barcoding. A species sampled throughout its geographical range will have a larger genetic variation than when only a few individuals are sampled from a single geographic locality (Bergsten et al. 2012). This is
This may also increase if the species shows phylogeographic structure and could result in the overlap of intra- and interspecific sequence divergence values.
Most DNA barcoding studies on Diptera were done in Europe, with no studies done in Africa and in particular South Africa. Therefore, it was unclear how successful the COI region would be
at delimiting South African species collected from a relatively small geographic region. In this study, the performance of the standard COI region as a barcode for the identification of South
African taxa was evaluated by testing for the existence of barcoding gaps using two substitution models, the standard K2P model, which is used widely in the barcoding community and a more parameter rich model (GTR + I + G) which best fits our data.
This study also offers a unique case study to test the effect of small regional sampling on the utility of a DNA reference library. To test the effect of spatial scale, barcode gap analyses were performed on two different data sets. First, the DNA barcode gap was evaluated on all the available South African Diptera barcode data is available from the global Barcode of Life Database (BOLD). Second, analyses were repeated for a group of taxa collected at a much smaller spatial scale namely the eThekwini municipality area. To determine if the presence of the DNA barcode gap was taxonomically linked, analyses were repeated separately on ten Diptera families. The performance of the COI region was also evaluated by estimating the proportion of
correct species identifications obtained using three species identification criteria: Near Neighbor (NN), Best Close Match (BCM) following Meier et al. (2006), and the BOLD Identification
Criteria (BIC) which is used in BOLD (www.boldsystems.org).
2.2
Materials and methods
2.2.1 Study area: The eThekwini municipality
The eThekwini municipality is in the province of KwaZulu-Natal, South Africa. It covers a land area of 2, 297 km2 and includes the city of Durban and surrounding areas (Outer West Durban) making it one of the largest municipalities in South Africa. The eThekwini region is a sub-tropical coastal region, characterized by high temperatures, humidity and summer rainfall
(Fairbanks, Reyers, & van Jaarsveld, 2001). It contains three of South Africa’s eight terrestrial biomes (savanna, forest and grassland), as well as eight broad vegetation types: the Eastern Valley Bushveld, Natal Coastal Belt, Natal Hinterland Thornveld, KwaZulu-Natal Sandstone Sourveld, Ngongoni Veld, Northern Coastal Forest, Scarp Forest and Mangrove Forest (eThekwini state of biodiversity report, 2014/2015).
The eThekwini municipality falls within the Maputaland-Pondoland-Albany Region of endemism, which is a biodiversity hotspot of global importance (Scott-Shaw 2011). However, there is increasing pressure on the natural habitats within the region due to urbanization. One significant impact of urbanization is that it leads to a dramatic decrease in native species (McKinney, 2002). This makes it necessary to conserve the remaining urban green spaces. Urban green spaces are defined as public or private open spaces in urban areas, primarily covered by vegetation which are directly or indirectly available to the public (Tuzin et al. 2002).
These can protect and enhance biodiversity in urban areas as they function as protection centers for the conservation of both plants and animals (Haq 2011). The significance of urban green spaces within cities is important from both socio-economic and a biodiversity point of view (Haq 2011). Within the eThekwini municipality, there are a number of open green spaces. These open green spaces are managed through the Durban Metropolitan Open Space System (D’MOSS), which is used as a key planning tool to help achieve provincial and national biodiversity targets. The D’MOSS system incorporates areas of high biodiversity and also prioritizes areas which provide essential ecosystem goods and services (eThekwini state of biodiversity report, 2014/2015).