Predicting quality (AGS/UGS) at the stand,
plot and tree levels
Reviewed: February, 2020
HIGHLIGHTS
No. 2020_1_01
Month
Year
Technical
Note
R
eso
ur
ce Cha
ract
eri
zati
on
• The determination of tree quality (acceptable growing stock / unac-ceptable growing stock) is important for silviculture decisions as well as for predictions of growth.• We developed a model to predict tree quality (AGS/UGS) of hardwood species when tree form and risk are unknown, based on ordinary for-est inventory and remote sensing variables.
• Dendrometric and environmental parameters at the tree level were the best variables to explain variance and showed higher accuracy prediction compared to the LiDAR and image metrics at the plot level.
• Results obtained from remote sensing models were more correlated to LiDAR metrics. The addition of spectral and environmental varia-bles on average, decreased the accuracy of purely dendrometric models.
INTRODUCTION
Decisions on how to manage a forest over time are often done using in-complete information (Eyvindson and Kangas, 2018). In particular, the knowledge of tree quality and vigour is universally lacking although it is crucial to sound forest management.
Modern growth and yield models have been used to alleviate some of those shortfalls but offer no replacement for the ability to identify low quality and vigorous stems which are expected to decline before the next harvesting cycle, and to determine the distribution of wood products (Power and Havreljuk, 2016).
Considerable attention must be invested on assessing tree quality, health and vigour in order to de-termine the right silvicultural regimes. Tree health is an important element of quality and grade but very few jurisdictions systematically characterize trees for those features in their inventory. Vigour takes into account tree health as well as competition for light and other resources.
Tree classification systems such as the ABCD system (Ontario Ministry of Natural Resources (OMNR), 2004); the MSCR system (Boulet, 2007) and the acceptable growing stock / unacceptable grow-ing stock (AGS/UGS) system (OMNR, 2004) have been developed to take into consideration various
de-fects that commonly occur on hardwood trees and impact current and future growing stock (Castle et al.,
2017).
For the same reasons, the Northern Hardwoods Research Institute (NHRI) developed a tree
classifi-cation system based on the integration of metrics for both stem form and vigor (Pelletier et al., 2013).
The system was also designed to be compatible with other main stream stem classification approaches such as AGS/UGS.
Unfortunately, and despite its obvious importance, the inclusion of tree quality measures are not universally adopted in many jurisdictions. Our study aims to develop an adaptable model to predict tree quality (AGS/UGS) of hardwood species in absence of tree risk (vigor) and form variables using standard forest inventory and remote sensing variables of stand conditions in order to provide useful information
about tree quality to make long-term management decisions. We attempted to predict: (1) tree form; (2)
tree risk and (3) (AGS/UGS) of hardwood species.
METHODOLOGY
Data
We used two databases: data1 (446plots/2498 trees) obtained from J. D. Irving Limited and an NHRI database, data2 (637 plots/5683 trees) collected during block planning and other operations. All sampled
plots (trees with DBH ≥ 10cm) are in the format of Continuous Land Inventory (CLI), and are situated in
northern New Brunswick, Canada.
Two categories of variables were used: calculated dendrometric with available environmental varia-bles; and estimated variables using remote sensing methods (sentinel 2 images and LiDAR).
Page 3
METHODOLOGY
1. The following dendrometric and environmental variables were obtained or generated for each
tree and/or plot levels for data1 and data2:
Individual treelevel: species, DBH (cm), height (m), gross merchantable volume-GMV (m3/
ha), ratio height/DBH-Ht_DBH (cm), tree form , tree risk and acceptable growing stock-AGS.
Plot/ stand level: average height (m), average DBH (cm), elevation (m), average gross
mer-chantable volume-GMV (m3/ha), quadratic mean diameter-QMD (cm), density (trees/ha),
basal area-BA (m2/ha), percent of acceptable growing stock-AGS (%), percent of form class
(% good, % average, % poor), percent of risk class (%good, % poor), aspect, topographic
in-dex-TPI, forest unit name-FUNA, soil type, depth water (m), biomass growth index-BGI
(FORUS Research, 2016; Hennigar et al., 2016), ecoregion, ecodistrict and ecosite (Hennigar
et al., 2016).
2. The remote sensing variables were generated at the plot levels for data2 :
Sentinel images
We used four bands (blue, green, red and near-infrared) and the ARVI, EVI, NDVI and VARI index from Sentinel-3 images (10 m x 10 m resolution) obtained in May 2018, July 2018 and September 2018.
LiDAR
LiDAR (ALS) data were acquired during the summers of 2017 and 2018 and calculated using the package lidR in R. 56 variables were obtained using this package.
Data analysis
Data was analyzed at two levels: tree level and plot level.
Tree level (qualitative response variable)
Data1 was used to predict tree quality.
Form variables were grouped into 3 categories (good: F1, F2; average: F5, F6, F7, F8 and poor: F3,
F4) , and risk variables into (good: R1, R2; poor: R3, R4) and AGS/UGS into (1: AGS; 0: UGS),
A non-parametric regression model (random forest) was ran with all dendrometric and
environ-mental variables. Then we selected the important variables using the VSURF package in R to be analyzed once again. We thus calculated the out the bag error (OOB), and we generated the con-fusion matrix to estimate the accuracy of the model using the randomForest package in R.
Page 4
Plot level (quantitative response variable)
Data2 was used to predict tree quality at the plot level,
The percentage of the 3 form categories (% good, % average, % poor) was calculated as well as for
the 2 risk categories (% good, % poor) and the percent of acceptable growing stock (% AGS),
A non-parametric model, random forest was run with all dendrometric, environmental and remote
sensing variables (Lidar and spectral variables (bands and vegetation index)) first, then we selected the important variables using the VSURF package in R to be analyzed once again,
Relative Root mean square error (RMSE) and pseudo R-square values were determined respectively
using the randomForest package.
All statistical analyses were performed using the R 3.5.1 software (R Core Team, 2018). Environmental variables were generated using QGIS 3.8.1 software (GIS, 2018).
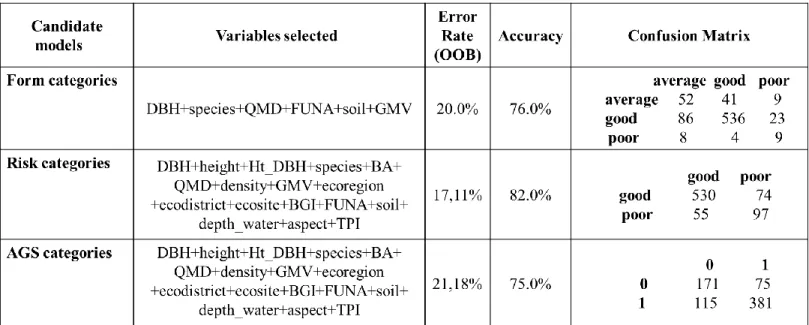
For the tree level, a confusion matrix and model fit statistics derived from data1 are presented in Table 1.
The random forest model used to predict the tree quality demonstrated excellent prediction, as evidenced by an accuracy of 76% for tree form, 82% for risk and 75% for AGS models.
For the tree form category model, only 5 dendrometric variables (DBH, species, QMD, FUNA, GMV) and one environmental variable (soil) were selected to better explain the variance and predict
more accurately form class. The precision of the model was very high, as shown by its error rate-OOB
(20% accuracy rate (76%) and confusion matrix (Table 1).
The variables selected for Form models were kept for Risk models and AGS models but 9 dendro-metric variables (DBH, Height, ratio Ht_DBH, species, BA, QMD, Density, GMV, and FUNA) and 8 environ-mental variables (Ecoregion, Ecodistrict, Ecosite, BGI, Soil, Depth to water, Aspect and Topographic index TPI) were added. Predictions of tree risk and AGS are higher, with respectively an error rate OOB (17.11% and 21.18%), accuracy rate (82% and 75%) and confusion matrix (Table 1).
However, when using data2 in order to predict the percent of the 3 categories of form (% good, % average, % poor), the 2 categories of risk (% good, % poor) and the percent of acceptable growing stock (% AGS) using dendrometric, environmental and remote sensing variables, the results obtained with all models are very low and did not explain well the variance.
Page 5
Table 1. Candidate models, variables selected, error rate (OOB), accuracy and confusion matrix of models estimating from, risk and AGS class using dendrometric and environmental variables.
The relative Root mean square error (RSME) for the 2 form categories for example (% good, %
av-erage) is 17% and 17.3% (Table 2) respectively and the pseudo R-squared of each category is 4% for good
class and 11% for average class (Table 2). Moreover, the others selected models of the good risk, poor risk and AGS support the similar low results, with respectively 13 % and 23% of RSME for both risk
mod-els and AGS model and with pseudo R-squared inferior or equal to 11% (Table 2).
The relative errors of the models using all variables combined or selected variables did not record
any variation. However, the pseudo R-squared decrease when we used selected variables given by the
VSURF package (Table 2).Contrary with the form model, selected variables improved the ability of the
model to predict good risk, poor risk and AGS, even if the pseudo R-squared did not exceed 11% (Table
2). Because of the low values of pseudo R-squared and the high relative error given by the RMSE for all
the models, we did not conduct the prediction and produced a confusion matrix.
Table 2. Candidate models, variables selected, relative RMSE (%) and pseudo R-squared of models estimating from, risk and AGS class using LiDAR, spectral, environmental and dendrometric variables.
Page 6
DISCUSSION
We undertook the development of a tree quality model to assess the acceptable growing stock / unacceptable growing stock (AGS/UGS) via the prediction of form and risk using various variables.
The results of this study highlighted that the dendrometric and environmental parameters at the tree level were the best variables to explain variance and present a higher accuracy prediction com-pared to the LiDAR and images metrics at the plot level.
Past works have shown that risk, form and AGS/UGS are very related to dendrometric variables
(Castle et al., 2017; Cecil-Cockwell and Caspersen 2015; Pothier et al., 2013). This could be explained by
the fact that the NHRI tree classification systems is based on some dendrometric variables such DBH, height, species, and evaluate a wide range of attributes that have implications on hardwood product po-tential such the GMV variable.
Moreover, environmental variables such as soil, ecoregion, ecosite, BGI were present in the 3
ob-tained models. They have been shown to be important tree-level attributes for predicting tree quality.
This is consistent with previous studies of Baral et al. (2016), which indicated that site quality is also ex-pected to have a role in influencing stem quality and trees were less likely to have defects on higher quality sites.
The implications of remote sensing parameters on stem quality have still not been commonly eval-uated. However, different forest characteristics such as: aboveground biomass (Steininger, 2000), basal
area (Means et al., 1999), tree crown diameter (Popescu et al., 2003), canopy height (Simard et al.,
2011) and canopy structure (Coops et al., 2007) have been successfully derived from satellite images
and LiDAR.
Furthermore, forest characteristics derived from remote sensing are mostly related to overstory due to the interference of canopy foliage on the detection of understory vegetation.
Landry et al. (unpublished , 2020) indicate that overstory density (Maltamo et al., 2005; Falkowski
et al., 2009; Latifi et al., 2015; Campbell et al., 2018), height (Wing et al., 2012), composition (Naesset,
2005) and canopy cover (Morsdorf et al., 2010) decrease the estimation accuracy of overstory tree
char-acteristics. In our study, the integration of different remote sensing parameters has been shown to be less successful in assessments of tree quality.
Results obtained from remote sensing models were more correlated with LiDAR metrics. Spectral and environmental variables decreased the accuracy of these models. LiDAR is better than images to
penetrate through the canopy (Pesonen et al., 2008). Besides, satellite images are more related to
cano-py cover characteristics than of height (Hudak et al., 2006) highlighting the limitation of Sentitnel-2
im-agery.
According to Pearse et al. 2018, Hyde et al. 2006 and Hudak et al. 2006, LiDAR is known to be more accurate than satellite images in estimating forest metrics such as density, biomass and basal area.
Page 7
CONCLUSION
Few studies have dealt with the question of stem quality from dendrometric and remote sensing data. Results from this study confirmed that dendrometric models have a wide range on stem quality. Explaining differences in stem form, risk and AGS among species is challenging. Remote sensing parame-ters in previous studies have shown a success in predicting other tree characteristics. Models that in-cluded these parameters as covariates demonstrated relatively low precision and predictive incapability, indicating that dendrometric parameters are more considerable and accurate in predicting stem quality classes at the tree level.
Wall-to-wall acquisition of airborne LiDAR took place between 2013 and 2018 in New Brunswick. It
is unknown when and if a new cycle will occur in the near future.
In conclusion, this study suggests a new model to predict form and risk class that can be used when the variables were not captured during field inventories, but more is needed to increase accuracy and reduce variance. For the remote sensing model, we suggest to try using satellite images with a
high-er resolution than Sentinel-2 images, using remote sensing techniques at the tree level and increasing
the sample sizes in order to improve the power of the statistical tests.
REFERENCES
Baral, S.K., Danyagri, G., Girouard, M., Hébert, F., and Pelletier, G. 2016. Effects of suppression history on growth response and stem quality of extant northern hardwoods following partial harvests. Forest
Ecology and Management. 372: 236–246.
Boulet, B. 2007. Defects and external indices of tree decay. 2nd ed. Ministère des Ressources naturelles et de la Faune du Québec. [In French.].
Campbell, M. J., Dennison, P. E., Hudak, A. T., Parham, L. M., and Butler, B. W. 2018. Quantifying
understory vegetation density using small-footprint airborne lidar. Remote sensing of
environment,215: 330–342.
Castle, M., Weiskittel, A., Wagner, R., Ducey, M., Frank, J., and Pelletier, G. 2017. Variation in stem form and risk of four commercially important hardwood species in the Acadian Forest: implications for potential sawlog volume and tree classification systems. Canadian Journal of Forest Research. 47:
1457–1467.
Cecil-Cockwell, M.J., and Caspersen, J.P. 2015. A simple system for classifying sugar maple vigour and
quality. Canadian Journal of Forest Research. 45: 900–909.
-Coops, N. C., Hilker, T., Wulder, M. A., St-Onge, B., Newnham, G., Siggins, A., and Trofymow, J. T. 2007.
REFERENCES
Page 8
Eyvindson, Kyle . and Kangas, A. 2018. Guidelines for risk management in forest planning –what is risk and
when is risk management useful? Canadian Journal of Forest Research. 48(4): 309–316.
Falkowski, M. J., Smith, A. M., Gessler, P. E., Hudak, A. T., Vierling, L. A., and Evans, J. S. 2008. The influence of conifer forest canopy cover on the accuracy of two individual tree measurement algorithms using lidar data. Canadian Journal of Remote Sensing, 34: S338–S350.
Hennigar, C., Weiskittel, A., Allen, H.L., and MacLean, D.A. 2016. Development and evaluation of a biomass
increment-based index for site productivity. Canadian Journal of Forest Research. 47: 400–410.
Hudak, A.T., Crookston, N.L., Evans, J.S., Falkowski, M.J., Smith, A.M., Gessler, P.E. and Morgan, P., 2006.
Regression modeling and mapping of coniferous forest basal area and tree density from discrete-
return lidar and multispectral satellite data. Canadian Journal of Remote Sensing, 32(2):126–138.
Hyde, P., Dubayah, R., Walker, W., Blair, J.B., Hofton, M. and Hunsaker, C., 2006. Mapping forest structure
for wildlife habitat analysis using multi-sensor (LiDAR, SAR/InSAR, ETM+, Quickbird) synergy. Remote
Sensing of Environment, 102(1-2): 63–73.
Landry, S., St-Laurent, M. H., Nelson, P. R., Pelletier, G., and Villard, M. A. 2020. The best of both worlds?
Integration of Sentinel-2 images and LiDAR to characterize forest regeneration. Remote Sensing of
Environment.
Latifi, H., Heurich, M., Hartig, F., Müller, J., Krzystek, P., Jehl, H., and Dech, S. 2015. Estimating over-and
understorey canopy density of temperate mixed stands by airborne LiDAR data. Forestry: An
International Journal of Forest Research,89(1): 69–81.
Maltamo, M., Packalén, P., Yu, X., Eerikäinen, K., Hyyppä, J., and Pitkänen, J. 2005. Identifying and
quantifying structural characteristics of heterogeneous boreal forests using laser scanner data.Forest
ecology and management,216(1-3): 41–50.
Means, J.E., Acker, S.A., Fitt, B.J., Renslow, M., Emerson, L. and Hendrix, C.J., 2000. Predicting forest stand characteristics with airborne scanning lidar. Photogrammetric Engineering and Remote Sensing, 66
(11): 1367–1372.
Morsdorf, F., Mårell, A., Koetz, B., Cassagne, N., Pimont, F., Rigolot, E., and Allgöwer, B. 2010.
Discrimination of vegetation strata in a multi-layered Mediterranean forest ecosystem using height
and intensity information derived from airborne laser scanning.Remote Sensing of Environment,114
(7):1403–1415.
Ontario Ministry of Natural Resources (OMNR). 2004. Ontario tree marking guide. Version 1.1. Queen’s
Printer for Ontario, Toronto, Ontario.
Pearse, G.D., Dash, J.P., Persson, H.J. and Watt, M.S., 2018. Comparison of high-density LiDAR and satellite
photogrammetry for forest inventory. ISPRS journal of photogrammetry and remote sensing,
Page 9
ACKNOWLEDGEMENTS
We are grateful to J.D. Irving, Limited for sharing the valuable dataset used in this study.
Pelletier, G., Landry, D., and Girouard, M. 2013. A tree classification system for New Brunswick. Northern Hardwoods Research Institute, Edmundston, New Brunswick.
Pesonen, A., Maltamo, M., Eerikäinen, K. and Packalèn, P., 2008. Airborne laser scanning-based prediction
of coarse woody debris volumes in a conservation area. Forest Ecology and Management, 255(8-9):
3288–3296.
Popescu, S. C., Wynne, R. H., & Nelson, R. F. 2003. Measuring individual tree crown diameter with lidar and assessing its influence on estimating forest volume and biomass. Canadian journal of remote sensing,
29(5): 564–577.
Pothier, D., Fortin, M., Auty, D., Delisle-Boulianne, S., Gagné, L.-V., and Achim, A. 2013. Improving tree
selection for partial cutting through joint probability modelling of tree vigor and quality. Canadian
Journal of Forest Research. Res. 43: 288–298.
Power, H., and Havreljuk, F. 2016. Predicting hardwood quality and its evolution over time in Quebec’s
forests. Forestry. 3: 259–270.
R Core Team. 2018. R: a language and environment for statistical computing. R Foundation for Statistical
Computing, Vienna, Austria. Available from https://www.R-project.org/
Simard, M., Pinto, N., Fisher, J. B., & Baccini, A. (2011). Mapping forest canopy height globally with
spaceborne lidar.Journal of Geophysical Research: Biogeosciences,116(G4).
Steininger, M. K. 2000. Satellite estimation of tropical secondary forest above-ground biomass: data from
Brazil and Bolivia. International Journal of Remote Sensing, 21(6-7): 1139–1157.
Wing, B. M., Ritchie, M. W., Boston, K., Cohen, W. B., Gitelman, A., and Olsen, M. J. 2012. Prediction of
understory vegetation cover with airborne lidar in an interior ponderosa pine forest.Remote Sensing
of Environment,124: 730–741.
[email protected] Researcher: Ines Khedhri
FOR MORE INFORMATIONS, CONTACT:
AUTHORS AND AFFILIATIONS:
Ines Khedhri1 and Monique Girouard2
1,2