New Failure Mode and Effects Analysis based on D Numbers
Downscaling Method
B. Liu, Y. Hu, Y. Deng Baoyu Liu
College of Infomation Science and Technology Jinan University, Guangzhou, China
[email protected] Yong Hu
Big Data Decision Institute,
Jinan University, Tianhe, Guangzhou, 510632, China [email protected]
Yong Deng*
1. Big Data Decision Institute,
Jinan University, Tianhe, Guangzhou 510632, China 2. Institute of Fundamental and Frontier Science,
University of Electronic Science and Technology of China Chengdu, 610054, China
*Corresponding author: [email protected]
Abstract: Failure mode and effects analysis (FMEA) is extensively applied to pro-cess potential faults in systems, designs, and products. Nevertheless, traditional FMEA, classical risk priority number (RPN), acquired by multiplying the ratings of occurrence, detection, and severity, risk assessment, is not effective to process the uncertainty in FMEA. Many methods have been proposed to solve the issue but deficiencies exist, such as huge computing quality and the mutual exclusivity of propo-sitions. In fact, because of the subjectivity of experts, the boundary of two adjacent evaluation ratings is fuzzy so that the propositions are not mutually exclusive. To address the issues, in this paper, a new method to evaluate risk in FMEA based on D numbers and evidential downscaling method, named as D numbers downscal-ing method, is proposed. In the proposed method, D numbers based on the data are constructed to process uncertain information and aggregate the assessments of risk factors, for they permit propositions to be not exclusive mutually. Evidential downscaling method decreases the number of ratings from 10 to 3, and the frame of discernment from210to23, which greatly reduce the computational complexity.
Be-sides, a numerical example is illustrated to validate the high efficiency and feasibility of the proposed method.
Keywords: Failure mode and effects analysis; Dempster-Shafer evidence theory; basic belief assignment; belief function; risk priority number; D numbers; evidential downscaling; aggregate assessment
1
Introduction
Failure mode and effects analysis (FMEA) was first developed to assess known and potential faults and prevent them from happening in the 1960s [5]. It is an efficient and powerful technology in engineering and management fields, including defining, identifying, and removing known and potential faults, errors, and risk from the system, process, design as well as service. [1, 51]. Besides, in other fields, such as risk management, healthcare management and engineer design, FMEA plays an important role [2, 8, 10, 11, 15, 24, 36]. Furthermore, FMEA not only identifies factors that induce fault but also classifies the likelihood and severity of such fault [11].
A traditional method in FMEA is risk priority number (RPN), which is acquired by mul-tiplying the grades of occurrence, severity, and detection. Thus, how to aggregate the assess-ments of three risk factors is a key issue, especially when the evaluated information given by experts is uncertain. These years, a large number of approaches have been proposed to im-prove FMEA methodology [5, 11, 23, 26, 37, 43]. It’s inevitable to deal with uncertainty in real world [20–22,29,44]. Due to the efficiency to handle linguistic information of fuzzy sets [13,18], an intuitionistic fuzzy approach for FMEA is proposed in [15], which offers some advantages over earlier models as it accounts for degrees of uncertainty in relationships among various criteria or options, specifically when relations cannot be expressed in definite numbers. In addition, an integrating hesitant 2-tuple linguistic term sets and an extended QUALIFLEX approach is proposed by Liu H C et al. in [13]. Furthermore, as is known to all, D numbers [9] and grey theory are two popular methods to process the uncertain information. Therefore, based on the two theories, plenty of methods are presented [23].
Classical RPN is criticized due to its several shortcomings. For example, the importance weights of three risk factors are taken into consideration. Besides, classical RPN can do nothing about the uncertain information, etc. Aiming at these problems, a method which is effective to dispose the uncertainty of assessment is proposed by Chin et al. [4]. However, the algorithm is too complex computationally, the reason is that the numeric ratings of every risk factor are from 1 to 10 so that the number of frame of discernment is210, which greatly increase the computational
load [11]. In other to reduce the computational complexity, an evidential downscaling method is proposed in [11]. Nevertheless, the D-S combination theory it uses requests that propositions are exclusive mutually. As a matter of fact, traditional FMEA ratings are obtained by subjective judgment of the experts. Therefore, the boundary of two adjacent ratings is fuzzy, hence the propositions are not actually mutually exclusive. For purpose of solving this problem, in this paper, a new method to evaluate risk in FMEA based on D numbers and evidential downscaling method, named as D numbers downscaling method, is proposed. In the proposed method, on the one hand, the evidential downscaling is utilized to decrease the frame of discernment so that greatly reduces the computational complexity. On the other hand, according to the data, D number is constructed to processing uncertain information and aggregate the assessment of risk factors because D numbers permit propositions that are not exclusive mutually.
The rest of the paper is organized as follows. Key concepts and previous theories are briefly reviewed in Section 2. A new method to evaluate risk based on D numbers downscaling method is proposed in Section 3. A numerical example is illustrated to show the feasible of the proposed method in Section 4. A brief conclusion is drawn in Section 5.
2
Preliminaries
2.1 Risk priority number
The real systems are very complicated to be modelled [14,27,46]. Risk priority number (RPN) is a traditional and typical method to model and evaluate risk in FMEA of the complicated systems, which is acquired by multiplying the grades of occurrence assessment (O), severity assessment (S), and detection assessment (D). That is
RP N =OSD,
where O stands for the probability of occurrence of failure mode, S refers to the severity of failure mode and D refers to the probability of failure being detected. The three risk factors are evaluated by FMEA experts using a 1 to 10 numeric scale, as expressed in Tables 1 to 3 [11].
The larger RPN is, the more important degree it is supposed to be assigned, referring to the failure mode should be more priority to be corrected.
However, as a traditional method for FMEA, classical RPN has been controversial all the time for many reasons, and the most important ones are listed as follows:
• The three risk factors have the same importance in RPN, but in practical applications of FMEA, they might be treated with different weight.
• Other factors are not taken into consideration, such as economy factor.
• Different combination of risk factors might obtain the same RPN, nevertheless, the potential risk might be totally different.
• The mathematical formula for calculating RPN lacks the scientific basis. There is not any proof to clarify the reason why O, S and D should be multiplied to obtain RPN.
• In fact, the scores of the three factors are difficult to be determined accurately. Therefore, FMEA experts usually provide different types of assessment information, some of which are uncertain and incomplete data.
2.2 Dempster-Shafer evidence theory
Dempster-Shafer evidence theory (D-S evidence theory) constructs a basic probability as-signment(BPA) in the frame of discernment. Through combining BPAs the imprecise and uncertain information can be fused [5]. With its rapid development, it is regarded as an im-portant method that is extensively applied in many fields such as complex networks and sys-tems [8, 10, 12, 19, 45, 50, 52], multisource information fusion [6, 7, 17, 28, 41, 42, 49], uncertainty modelling [1,2,16,48,53], pattern recognition [30,31] and Imprecise payoff [34,35].
Definition 1. Let Θ = {H1, H2,· · ·, HN} be a finite nonempty set, which is composed of N
mutually exclusive and exhaustive elements. Denote P(Θ) as the power set composed of 2N
elements ofΘ. The BBAs function is defined as a mapping of the power set P(Θ) to a number
between 0 and 1, that is,m:P(Θ)−>[0,1], and which satisfies the following conditions:
m(∅) = 0; (1)
X
A⊆P(Θ)
m(A) = 1. (2)
The massm(A) represents how strongly the evidence supports A.
Definition 2. Two bodies of evidence AandB ofΘcan be used to calculate the belief level for
some new hypothesis C shown as follows: The measure of conflict K that is also called as the
conflict coefficient between Aand B is given as:
K= X
A∩B=∅,∀A,B⊆Θ
mi(A)mi0(B); (3)
and the mass function after combination is:
m(C) = P A∩B=C,∀A,B⊆Θmi(A)mi0(B) 1−K ,when A6=∅ 0,when A=∅, (4)
where K reflects the conflict between two bodies of evidence. Absolutely, 0 ≤ K ≤1. K = 0
shows the absence of conflict between two bodies of evidence. K = 1 shows complete conflict
between mi and mi0. WhenK = 1, the Dempster ’s rule of combination is no longer applicable. 2.3 The evidential downscaling method
An evidential downscaling method is proposed in [11], which is based on Euclidean distance from multi-scale to construct the BBAs. The new method , decreasing the frame of discernment from210to 23, is shown as follows:
Step 1. Calculate the group assessment into a crisp number with weighted average method. Step 2. Construct the BBAs by Definition 2 with the Euclidean distances between group assessment
and multi-scale ratings. When calculating the distance, an evidential downscaling method is presented to divide the rating into three scales: ‘10’ for ‘bad’, ‘1’ for ‘good’, and ‘5’ for ‘bad or good’ because rating 10 expresses the most serious degree, rating 1 expresses that failure is almost impossible and rating 5 expresses the moderate degree, which decreases the number of frame of discernment from210 to 23.
The BBAs can be constructed as follows:
m({B}) = d(G)
d(G) +d(B, G) +d(G), (5)
m({G}) = d(B)
(d(G) +d(B, G) +d(G), (6)
m({B, G}) = 1−m({B})−m({G}). (7)
Step 3. Combine the BBAs of risk factors by Dempster’s combination rule.
Step 4. Acquire the risk priority according to the aggregation of ‘bad’. Letm({B})OSD,m({G})OSD
and m({B, G})OSD be the aggregation of three risk factors for ‘bad’, ‘good’, and ‘bad or
good’. The final assessment of ‘bad’ and ‘good’ can be calculated as follows:
m({B})0OSD =m({B})OSD+ m({B, G})OSD 2 , (8) m({G})0OSD =m({G})OSD+ m({B, G})OSD 2 . (9) 2.4 D numbers [9]
D numbers is an effective method to deal with uncertain information, which overcomes the shortcomings of Dempster-Shafer (D-S) theory. Nowadays, D number is extensively used in many fields such as dependence assessment, emergency management, and aggregating opera-tor [33, 54, 55]. It can be defined as follows:
Definition 3. LetΩbe a finite nonempty set, D number is a mappingD: Ω→[0,1], such that
X
B⊆Ω
where∅is an empty set andB is a subset ofΩ. More importantly, different from the concept of frame of discernment in D-S theory, the elements of setΩdo not require to be mutually exclusive
in D numbers. If P
B⊆ΩD(B) = 1, the information is considered to be complete; otherwise, the
information is regarded to be incomplete.
For a set Ω ={b1, b2,· · · , bi,· · · , bn}, wherebi 6=bj, ifi6=j. Then, a special D number can
be expressed by D({b1}) =v1, D({b2}) =v2, · · · ·, D({bi}) =vi, · · · ·, D({bn}) =vn
or D= {(b1, v1),(b2, v2),· · · ,(bi, vi),· · · ,(bn, vn)}, where vi >1 and Pni=1vi ≤ 1. For the
de-tailed information about D numbers combination rule, please refer [9]. A combination rule, a kind of add operation, is proposed to combine two D numbers.
3
The proposed method
As a traditional method for FMEA, classical RPN is acquired by multiplying the rating of three risk factors. Nevertheless, classical RPN is criticized for several disadvantages mentioned in 2.1. With the aim of overcoming these shortcomings, a large number of methods to evaluate risk for FMEA are proposed. However, existing methods either have a huge computing quantity, such as the Chinś method, or require the propositions to be mutually exclusive, like the method proposed by Du Y et al.. As a matter of fact, traditional ratings are divided by the subjective judgments of the experts which are based on the individual experience. Therefore, the boundary of two adjacent ratings is fuzzy, which means that two propositions in FMEA are not mutually exclusive. Hence, it is obviously unreasonable that Dempster-Shafer combination theory is used to aggregate assessment in the evidential downscaling method proposed in [11]. Aiming at these problems, a new method to evaluate risk in FMEA based on D numbers and evidential downscaling method is proposed. Based on the three risk factors as well, the proposed method, for one thing, decreases the number of the frame of discernment from 210 to 23 by making use
of the evidential downscaling method, which greatly reduce the computational complexity. For another, D numbers are utilized to manage the uncertain information. Because D numbers allow the propositions to not be exclusive, it is reasonable that D numbers are used to process uncertain information and aggregate the assessments. Furthermore, in consideration of the fuzzy information given by the experts on different failure modes, weighted averages are calculated to substitute them in the proposed method. Suppose there are N failure modes and M experts,
the specific steps are shown as follows: The failures with higher values of ‘bad’ are assumed to be more important and should be given higher priorities.
Step 1. Calculate the mathematical expectation of the score given by experts for evaluating each risk factor by Eq. (11).
Definition 4. Let Si jl be the mathematical expectation of the score S of failure mode i
given by expert j in the assessment of risk factorl, it is calculated as follows:
Sli j = S, if S is integer a×c% +b×d%, if S is(a:c%, b:d%)withc% +d% = 100% a×c% + 1 9×(55−a)×(1−c%), if S is(a:c%)but 0< c%<100% 5.5, if S is missing (11) wherei= 1,· · ·, N,j= 1,· · · , M,l=O, S, D.
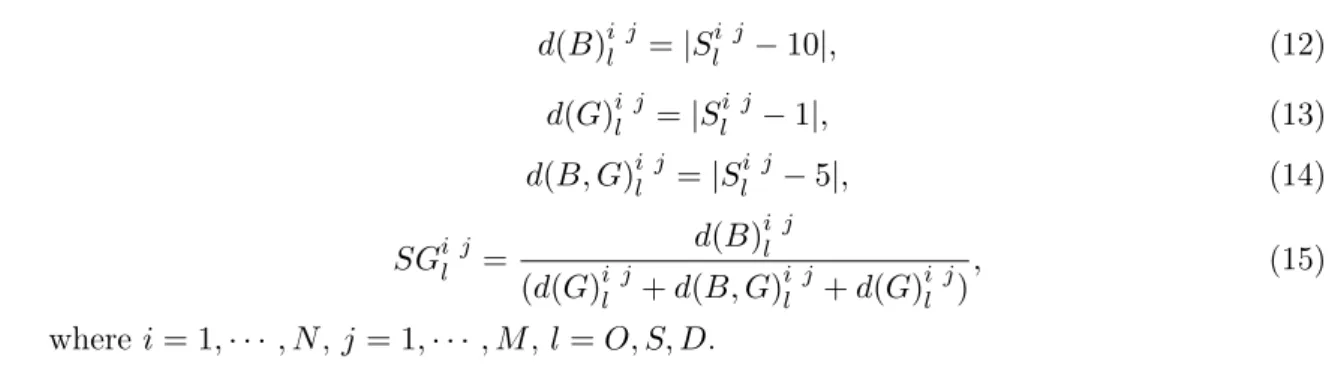
Step 2. Calculate the Euclidean distances between group assessment and multi-scale ratings. Con-sistent with the evidential downscaling method mention in 2.3, then the new score SGi jl
of each factor of each failure mode after downscaling can be obtained as follows:
d(B)i jl =|Sli j−10|, (12) d(G)i jl =|Sli j−1|, (13) d(B, G)i jl =|Sli j−5|, (14) SGi jl = d(B) i j l (d(G)i jl +d(B, G)i jl +d(G)i jl ), (15) wherei= 1,· · ·, N,j= 1,· · · , M,l=O, S, D.
Step 3. Construct D numbers on the basis of SGi jl in the light of Definition 5. Definition 5. LetDEFj
i be the D number of failure modei of experts j, which stands for the three assessments of experts j towards failure modei, is modeled as follows:
DEj Fi ={(b ij O, vO),(bijS, vS),(bijD, vD)} (16) with bi jl =λj×SGi jl (17)
where λj is the weight for expert j, and vl (l = O, S, D) is the weight of the risk factor
standing for the importance of it in FMEA. In addition, i = 1,· · ·, N, j = 1,· · · , M, l=O, S, D.
Step 4. According to the processes of DFi numbers mentioned in [9] and Definition 6, for each failure mode, the combination of D numbers can be calculated and theI(D)of each failure
mode can be obtained as well. Most importantly, the failure modes with the lower values ofI(D) are assumed to be more important and should be given higher priorities.
Definition 6. Let DFi be the D number of failure mode i (i= 1,· · · , N) aggregate the assessment of M experts, thus, it can be calculate as follows:
DFi =D E1 Fi ⊕D E2 Fi ⊕ · · · ⊕D Ej Fi ⊕ · · · ⊕D EM Fi (18)
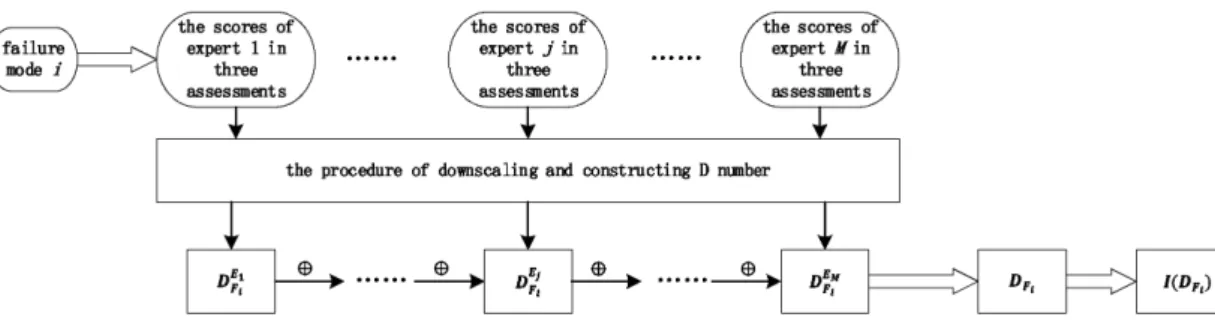
Figure 1 is the sub-flowsheet of the proposed method, that is, the procedure of downscaling and constructing D number. Figure 2 is the general flow-chart.
Figure 1: The procedure of downscaling and constructing D number
Figure 2: The general flow-chart of the proposed method
Table 1: Occurrence assessment by FMEA team members
Failure
mode Expert1 Expert2 Expert3 Expert4 Expert5
1 1 1 1 1 2 1 : 50%,2 : 50% 1 1 1 1 3 2 2 : 90% 2 2 2 4 8 8 8 : 80%,9 : 20% 8 8 5 6 6 6 6 6 6 2 13 2 2 2-3 7 2 2 2 9 2 8 1 1 : 75%,2 : 25% 1 1 1 9 3 3 3 3 3 10 1 : 80%,2 : 20% 1 1 1 1−2 : 85%,3 : 15% 11 4 4 4 3−4 : 75%,5 : 25% 4 12 9 9 9 9 9 13 8 8 : 80% 8 8 8 14 3 3 4 3 3 15 3 3 3 3 3 : 70%,4 : 30% 16 1 1 1 1 1 17 3−5 : 90%,6 : 10% 4 4 4 4 18 2 2 2 : 90% 2 2 19 7 7 7 7 7:80% 20 9 9 9 7 : 30%,8−9 : 70% 9 21 9 8−9 9 9 9
Table 2: Severity assessment by FMEA team members
Failure
mode Expert1 Expert2 Expert3 Expert4 Expert5
1 7 : 20%,8 : 80% 8 8 6−7 : 50%,8−9 : 50% 8 2 8 8 8 8 3 7−9 : 90% 8 6-8 8 8 4 8 8 8 8 7−9 : 80% 5 8 7−9 : 90% 8 8 8 6 8 8 8 6-8 8 7 9 : 75%,8 : 25% 9 9 9 9 8 4 4 4 4 : 50%,5 : 50% 3−5 : 75%,6−7 : 25% 9 2 2 2 2 2 10 2 2 1−2 : 60%,3−4 : 60% 2 2 11 2 2-3 2 2 2 12 3 3 3 : 60%,4 : 40% 3 3 13 2−3 : 80%,3−4 : 20% 3 3 3 3 14 7 8 7 7 7 15 3 3 3 3 3 16 8 8 8 8 17 8 4 8 8 8 18 7 7 7 7 7 19 2 1−2 : 75%,2−3 : 25% 2 2 2 20 8 8 8 8 21 3 3 3 3 3
4
Numerical example
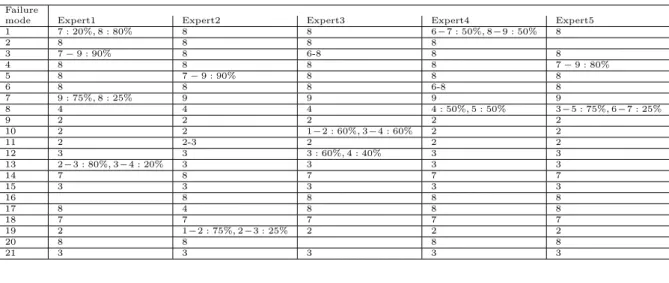
Suppose that there are 5 experts evaluating risk in FMEA, who give their assessments on the three risk factors of 21 failure modes as shown in Table 1 to 3. The weights for the five experts are assumed to be 0.3, 0.3, 0.2, 0.1 and 0.1.
Take failure mode 1 of expert 1 for example. As shown in Table 1, three ratings the expert 1 gives are 1, (7:20%, 8:80%), and 3. Thus, according to Eq. (11), the mathematical expectation of score are 1, 7.8, and 3.
Then, the Euclidean distances between it and ‘bad’, ‘good’ and ‘bad or good’ are calculating as in Table 4.
Therefore, the new scores can be obtained as follows:
SG1 1O = d(B) 1 1 O d(G)1 1 O +d(B, G)1 1O +d(G)1 1O = 9 9 + 0 + 4 ≈0.6923.
Table 3: Detection assessment by FMEA team members
Failure
mode Expert1 Expert2 Expert3 Expert4 Expert5
1 3 3 3 3 3 : 90% 2 3 3 3 3 3 3 4 4 4 4 3−4 : 80%,5−6 : 20% 4 5 5 5 5 5 5 6 6 6 : 85%,7 : 15% 6 6 6 1 1 : 85%,2 : 15% 2 1 7 3 2 2 1−2 : 75%,3−4 : 25% 2 8 3 3 3 : 80%,4 : 20% 3 3 9 3 3 3−4 : 60%,5 : 40% 3 3 10 4 4 4 4 4 11 3 : 70%,5 : 30% 3 3 3 12 7 7 7 7 7 13 6 6 6 5-7 6 14 4 4 4 4 4 15 4 4 : 95% 4 4 4 16 3 3 3 3 3 17 5 5 5 5 5 18 7 6-8 7 7 7 19 4 4 4 8−9 : 90% 4 20 4 : 60% 9 9 9 9 21 6 6 4-6 6 4 : 25%,5−7 : 75%
Table 4: Euclidean distances between it and "bad", "good" and "bad or good"
Bad Good Bad or Good
d(B)1 1O =|1−10|= 9, d(G)1 1O =|1−1|= 0, d(B, G)1 1O =|1−5|= 4; d(B)1 1S =|7.8−10|= 2.2, d(G)1 1S =|7.8−1|= 6.8, d(B, G)S1 1=|7.8−5|= 2.8; d(B)1 1D =|3−10|= 7, d(G)1 1D =|3−1|= 2, d(B, G)1 1D =|3−5|= 2; 0 5 10 15 20 25 failure mode 0 0.1 0.2 0.3 0.4 0.5 0.6 0.7
the SG of the occurrence assessment
expert1 expert2 expert3 expert4 expert5
Figure 3: The new score of Occurrence assessment
SG1 1S = d(B) 1 1 S d(G)1 1 S +d(B, G)1 1S +d(G)1 1S = 2.2 2.2 + 6.8 + 2.8 ≈0.1864. SG1 1D = d(B) 1 1 D d(G)1 1D +d(B, G)1 1D +d(G)1 1D = 7 7 + 2 + 2 ≈0.6364.
The data of the other three assessments is treated in the same way, among which the result of occurrence assessment with the new scores are shown in Figure 3. As shown in Figure 3, the higher initial rating tends to the lower new score while the lower rating tends to the higher one. Then, the first element b can be calculated by multiply the weight of the expert 1 and the
new score:
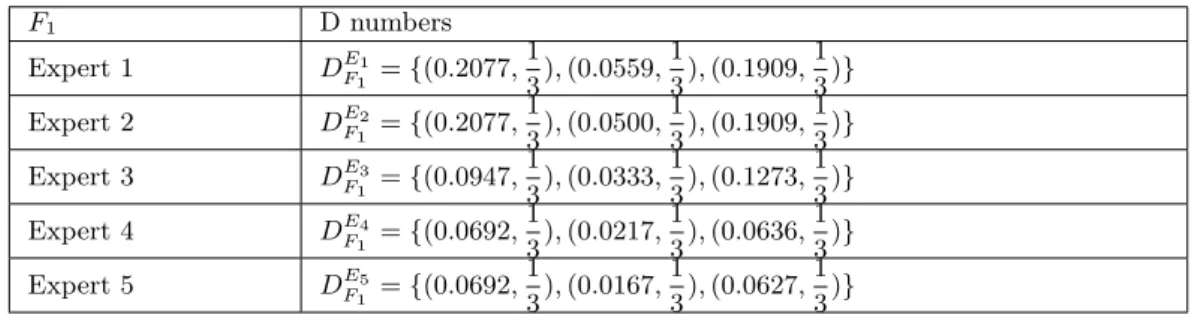
Table 5: The representation of D numbers for failure mode 1 (F1) F1 D numbers Expert 1 DE1 F1 ={(0.2077, 1 3),(0.0559, 1 3),(0.1909, 1 3)} Expert 2 DE2 F1 ={(0.2077, 1 3),(0.0500, 1 3),(0.1909, 1 3)} Expert 3 DE3 F1 ={(0.0947, 1 3),(0.0333, 1 3),(0.1273, 1 3)} Expert 4 DE4 F1 ={(0.0692, 1 3),(0.0217, 1 3),(0.0636, 1 3)} Expert 5 DE5 F1 ={(0.0692, 1 3),(0.0167, 1 3),(0.0627, 1 3)} b1 1S =λ1×SG1 1S = 0.3×0.6923 = 0.0559. b1 1D =λ1×SG1 1D = 0.3×0.6923 = 0.1909.
With the same process, theb of other D numbers can be obtained. Next, the data is treated
using the D numbers. It needs to be emphasized that the weight of each rich factor is treated as the second parameter v. It is worth mentioning that the judgments for the relative importance
of each criterion are various from different expert.
In order to compare with other methods which do not take it into consideration and prove the feasibility of the proposed method as well, the importance of three factors are assumed to be same. That is, v is supposed to be identically equal to 13.
Therefore, the assessment result being disposed through above process are expressed in the forms of D numbers. According to the data of expert 1, a D numberDE1
F1 is constructed, where DE1 F1 ={(0.2077, 1 3),(0.0559, 1 3),(0.1909, 1 3)}. Similarity toD E1
F1, According to the data of expert 2, expert 3, expert 4 and expert 5, four D numbers DE2
F1, D E3 F1, D E4 F1 and D E5 F1 are generated. Table 4 shows these D numbers. In the same method, for failure mode Fi, and expert Ej, each
D numberDEj
Fi can be constructed, too.
For each failure mode, all experts’ data represented by D numbers are combined according to the combination rule of D numbers mentioned in [9]. Take the failure mode 1 (F1) for example,
the integrated assessment of three experts is the aggregation ofDE1
F1,D E2 F1,D E3 F1,D E4 F1 andD E5 F1, DF1 =D E1 F1 ⊕D E2 F1 ⊕D E3 F1 ⊕D E4 F1 ⊕D E5 F1.
In accordance with the processes ofDFi numbers mentioned in [9],DF1 is calculated. Therefore, theI(DF1)ofDF1 can be obtained. Using the same method,DFiandI(DFi)are acquired, which are shown in Table 5. In the meantime, according to I(DFi)(i = 1,2,· · ·,21), the ranking of 21 failure modes are obtained, where the failure modes with the lower values of I(D) are given higher priorities.
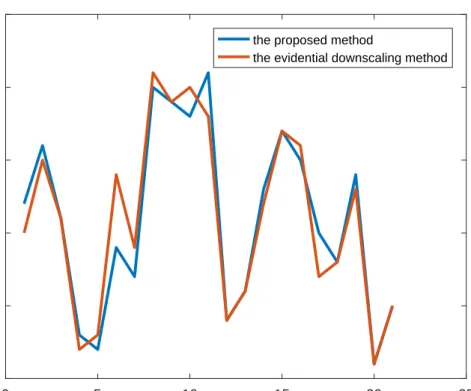
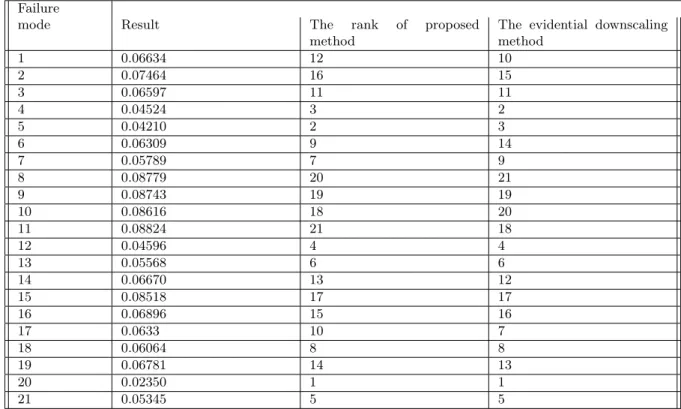
In Table 6, the risk priority rankings of the evidential downscaling method are shown. Com-pared with the ranking of the evidential downscaling method, the proposed method’s is similar. As seen from Table 6, failure mode 3, failure mode 9, failure mode 12, failure mode 13, failure mode 15, failure mode 18, failure mode 20 and failure mode 21 have the same risk priority rank-ing in both methods. Besides, it is indicated that the five of highest risk priority rankrank-ings are
0 5 10 15 20 25 failure mode 0 5 10 15 20 25
the rank of two methods
the proposed method
the evidential downscaling method
Figure 4: The comparison of risk priority ranking by two method
Figure 5: The occupation of ratings between two method
failure mode 20, 4, 5, 12 and 21, which means that these 5 faults are most likely to occur in both two methods. Moreover, in both two methods, the five of the lowest priorities are failure mode 8, 9, 10, 11 and 15, indicating that these 5 failures are supposed to be.
Table 6: The comparison of risk priority ranking by two methods Failure
mode Result The rank of proposed
method
The evidential downscaling method 1 0.06634 12 10 2 0.07464 16 15 3 0.06597 11 11 4 0.04524 3 2 5 0.04210 2 3 6 0.06309 9 14 7 0.05789 7 9 8 0.08779 20 21 9 0.08743 19 19 10 0.08616 18 20 11 0.08824 21 18 12 0.04596 4 4 13 0.05568 6 6 14 0.06670 13 12 15 0.08518 17 17 16 0.06896 15 16 17 0.0633 10 7 18 0.06064 8 8 19 0.06781 14 13 20 0.02350 1 1 21 0.05345 5 5
evidential downscaling method, in which the X-axis shows the rankings and Y-axis shows the failure modes. As is shown in Figure 4, it indicates that the rank result generated by proposed method has similar trend with the evidential downscaling method, which proves the proposed method is valid. However, in consideration that it is out of reality to request the propositions to be exclusive mutually, the proposed method is more reasonable. In 5, the occupation of ratings between two methods for each failure mode is shown. From Figure 5, the edge of the area around with different color is almost near the midline of the graph, which proves that the proposed method similarly has a good effect for risk assessment.
5
Conclusion
The conventional FMEA method has been criticized for its deficiencies especially in the evaluation of risks of failure mods and computation of classical RPN. A large number of new methods for FMEA have been proposed. Nevertheless, some deficiencies still exist in these methods, such as huge computing quality. Although the evidential downscaling method presented by Du Y et al. is capable to greatly reduce the amount of calculation, it is not reasonable that the propositions are requested to be exclusive mutually. Therefore, a new method to evaluate risk in FMEA based on D numbers downscaling method is proposed with the purpose of solving this problem.
Obviously, the proposed method can handle the uncertain information well in FMEA. Com-pared with the traditional RPN, the proposed method not only can dispose the scores of three risk factors even if they are uncertain, but also takes into consideration the relative importance weigths of risk factors. Therefore, the result of the proposed method is more reliable. In com-parison to the existing method, the proposed has more succinct calculation formulas, which has a smaller amount of calculation so that it is more worthy of promotion. Furthermore, because of
the use of D numbers, the propositions are not required to be exclusive mutually, which proves the proposed method is more reasonable than the evidential downscaling method. In conclusion, the proposed method is a feasible and efficient method to risk assessment in failure mode and effects analysis. In addition, although the proposed method takes the weights of three factors into consideration, it does not make sure the method to obtain the weights, which would be the further exploration.
Acknowledgment
The authors greatly appreciate the reviewers’ suggestions and the editor’s encouragement. The work is partially supported by National Natural Science Foundation of China (Grant Nos. 61573290, 61503237).
Bibliography
[1] Abellán, J., Mantas, C. J., Castellano, J. G., (2017); A random forest approach using imprecise probabilities, Knowledge-Based Systems, 134, 72–84, 2017.
[2] Abellán, J., (2017); Analyzing properties of deng entropy in the theory of evidence, Chaos Solitons & Fractals, 95, 195–199, 2017.
[3] Bowles, J. B., Pelaez, C. E., (1995); Fuzzy logic prioritization of failures in a system failure mode, effects and criticality analysis,Reliability Engineering System Safety, 50(2), 203–213,
1995.
[4] Chin, K. S., Wang, Y. M., Gary, K. K. P., Yang, J. B., (2009); Failure mode and effects anal-ysis using a group-based evidential reasoning approach, Computers&Operations Research,
36 (6), 1768–1779, 2009.
[5] Dempster, A. P., (1967). Upper and lower probabilities induced by a multivalued mapping,
Annals of Mathematical Statistics, 38 (2), 325–339, 1967.
[6] Deng, X., Han, D., Dezert, J., Deng, Y., Shyr, Y., (2016); Evidence Combination From an Evolutionary Game Theory Perspective, IEEE Transactions on Cybernetics, 46(9), 2070–
2082, 2016.
[7] Deng, X., Liu, Q., Deng, Y., (2016); Matrix games with payoffs of belief structures, Applied Mathematics and Computation, 273, 868–879, 2016.
[8] Deng, X., Liu, Q., Deng, Y., Mahadevan, S., (2016); An improved method to construct basic probability assignment based on the confusion matrix for classification problem,Information Sciences, 340, 250–261, 2016.
[9] Deng, Y., (2012). D numbers: theory and applications, Journal of Information and Com-putational Science, 9 (9), 2421–2428, 2012.
[10] Dong, Y., Wang, J., Chen, F., Hu, Y., Deng, Y., (2017); Location of facility based on simulated annealing and ZKW algorithms, Mathematical Problems in Engineering, Article
ID 4628501, 2017.
[11] Du, Y., Lu, X., Su, X., Hu, Y., Deng, Y., (2016); New failure mode and effects analysis: An evidential downscaling method, Quality & Reliability Engineering, 32 (2), 737–746, 2016.
[12] Fei, L.; Wang, H.; Chen, L.; Deng, Y. (2017); A new vector valued similarity measure for intuitionistic fuzzy sets based on OWA operators, Iranian Journal of Fuzzy Systems,
accepted, 2017.
[13] Goyal, R. K., Kaushal, S., (2016); A constrained non-linear optimization model for fuzzy pairwise comparison matrices using teaching learning based optimization, Applied Intelli-gence, 1–10, 2016.
[14] Hu, Y., Du, F., Zhang, H. L., (2016); Investigation of unsteady aerodynamics effects in cycloidal rotor using RANS solver, Aeronatical Journal, 120(1228), 956–970, 2016.
[15] Jain, K., (2017). Use of failure mode effect analysis (fmea) to improve medication manage-ment process, International Journal of Health Care Quality Assurance, 30 (2), 175, 2017.
[16] Jiang, W., Wang, S., (2017); An uncertainty measure for interval-valued evidences, Inter-national Journal of Computers Communications &Control, 12 (5), 631–644, 2017.
[17] Jiang, W., Wang, S., Liu, X., Zheng, H., Wei, B., (2017); Evidence conflict measure based on OWA operator in open world, PloS one,12 (5), e0177828, 2017.
[18] Jiang, W., Xie, C., Zhuang, M., Tang, Y., (2017); Failure mode and effects analysis based on a novel fuzzy evidential method, Applied Soft Computing, 57, 672–683, 2017.
[19] Kang, B., Chhipi-Shrestha, G., Deng, Y., Mori, J., Hewage, K., Sadiq, R. (2017); Devel-opment of a predictive model for clostridium difficile infection incidence in hospitals using gaussian mixture model and dempster-shafer theroy,Stochastic Environmental Research and Risk Assessment, accepted, 2017.
[20] Li, C., Mahadevan, S., (2016); An efficient modularized sample-based method to estimate the first-order sobol index, Reliability Engineering &System Safety, 153, 110–121, 2016.
[21] Li, C., Mahadevan, S., (2016); Relative contributions of aleatory and epistemic uncertainty sources in time series prediction, International Journal of Fatigue, 82, 474–486, 2016.
[22] Li, C.; Mahadevan, S. (2016); Role of calibration, validation, and relevance in multi-level uncertainty integration, Reliability Engineering &System Safety, 148, 32–43, 2016.
[23] Liu, H. C., You, J. X., Fan, X. J., Lin, Q. L., (2014); Failure mode and effects analysis using d numbers and grey relational projection method, Expert Systems with Applications,
41 (10), 4670–4679, 2014.
[24] Liu, H. C., You, J. X., Li, P., Su, Q., (2016); Failure mode and effect analysis under uncertainty: An integrated multiple criteria decision making approach, IEEE Transactions on Reliability, 65 (3), 1380–1392, 2016.
[25] Liu, H. C., You, J. X., Li, P., Su, Q., (2016); Failure mode and effect analysis under uncertainty: An integrated multiple criteria decision making approach, IEEE Transactions on Reliability, 1–13, 2016.
[26] Liu, H.-C., You, J.-X., You, X.-Y., Shan, M.-M., (2015); A novel approach for failure mode and effects analysis using combination weighting and fuzzy vikor method, Applied Soft Computing, 28, 579–588, 2015.
[27] Liu, J., Lian, F., Mallick, M., (2016); Distributed compressed sensing based joint detection and tracking for multistatic radar system, Information Sciences, 369, 100–118, 2016.
[28] Liu, T., Deng, Y., Chan, F., (2017); Evidential supplier selection based on DEMATEL and game theory, International Journal of Fuzzy Systems, DOI: 10.1007/s40815–017–0400–4,
2017.
[29] Liu, W., Liu, H. B., Li, L. L., (2017); A multiple attribute group decision making method based on 2-d uncertain linguistic weighted heronian mean aggregation operator, Interna-tional Journal of Computers Communications & Control, 12 (2), 254–264, 2017.
[30] Liu, Z., Pan, Q., Dezert, J., Han, J.-W., He, Y., (2017); Classifier fusion with contextual reliability evaluation,IEEE Transactions on Cybernetics, 99, 1–14, 2017.
[31] Liu, Z., Pan, Q., Dezert, J., Martin, A., (2017); Combination of classifiers with optimal weight based on evidential reasoning,IEEE Transactions on Fuzzy Systems, 99, 1–15, 2017.
[32] Méndez-González, L. C., Ambrosio-Lazaro, R., Rodriguez-Borbon, I., Alvarado-Iniesta, A., (2016); Failure mode and effects analysis of power quality issues and their influence in the reliability of electronic products,Electrical Engineering, 1–13, 2016.
[33] Mo, H., Deng, Y., (2016); A new aggregating operator in linguistic decision making based on d numbers, International Journal of Uncertainty, Fuzziness and Knowledge-Based Systems,
24 (6), 831–846, 2016.
[34] Mo, H., Gao, C., Deng, Y., (2015); Evidential method to identify influential nodes in complex networks, Journal of Systems Engineering and Electronics, 26 (2), 381–387, 2015.
[35] Mo, H., Lu, X., Deng, Y., (2016); A generalized evidence distance, Journal of Systems Engineering and Electronics, 27 (2), 470–476, 2016.
[36] Perdomo Ojeda, M., Salomon Llanes, J., (2016); Expanded failure mode and effects analysis: Advanced approach for reliability assessments, Revista Cubana de Ingeneria, 7 (2), 5–14,
2016.
[37] Pillay, A., Wang, J., (2003); Modified failure mode and effects analysis using approximate reasoning,Reliability Engineering System Safety, 79 (1), 69–85, 2003.
[38] Schneider, H., (1996); Failure mode and effect analysis: Fmea from theory to execution,
Technometrics, 38 (1), 80–80, 1996.
[39] Tooranloo, H. S., Ayatollah, A. S., (2016); A model for failure mode and effects analysis based on intuitionistic fuzzy approach, Applied Soft Computing, 49, 238–247, 2016.
[40] Viejo, M. R., Sanchez-Izquierdo Riera, J., Molano, E., Barea Mendoza, J. A., Temprano, V. S., Diaz, C. L., Montejo Gonzalez, J. C., (2016); Improvement of the safety of a clinical process using failure mode and effects analysis: Prevention of venous thromboembolic disease in critical patients, Medicina Intensiva, 40 (8), 483, 2016.
[41] Wang, J., Hu, Y., Xiao, F., Deng, X., Deng, Y., (2016); A novel method to use fuzzy soft sets in decision making based on ambiguity measure and Dempster-Shafer theory of evidence: An application in medical diagnosis, Artificial intelligence in medicine, 69, 1–11, 2016.
[42] Wang, J., Xiao, F., Deng, X., Fei, L., Deng, Y., (2016); Weighted Evidence Combination Based on Distance of Evidence and Entropy Function,International Journal of Distributed Sensor Networks, 12 (7), 2016.
[43] Wang, Y. M., Chin, K. S., Poon, G. K. K., Yang, J. B., (2009); Risk evaluation in fail-ure mode and effects analysis using fuzzy weighted geometric mean, Expert Systems with Applications, 36 (2), 1195–1207, 2009.
[44] Xiao, F., Aritsugi, M., Wang, Q., Zhang, R., (2016); Efficient processing of multiple nested event pattern queries over multi-dimensional event streams based on a triaxial hierarchical model, Artificial Intelligence in Medicine, 72 (C), 56–71, 2016.
[45] Xiao, F., Zhan, C., Lai, H., Tao, L., Qu, Z., (2017); New parallel processing strategies in complex event processing systems with data streams, International Journal of Distributed Sensor Networks, 13 (8), 1–15, 2017.
[46] Xu, S., Jiang, W., Deng, X., Shou, Y., (2017); A modified physarum-inspired model for the user equilibrium traffic assignment problem,Applied Mathematical Modelling, In Press,
DOI: 10.1016/j.apm.2017.07.032, 2017.
[47] Yang, Z., Liu, P., Zhu, Y., Zhang, Y., (2016); A comprehensive reliability allocation method for series systems based on failure mode and effects analysis transformed functions, Proc. of the Institution of Mechanical Engineers, Part B- Journal of Engineering Manufacture, 230,
2239–2248, 2016.
[48] Zhang, D., (2017); High-speed train control system big data analysis based on fuzzy rdf model and uncertain reasoning, International Journal of Computers Communications &
Control, 12 (4), 577–591, 2017.
[49] Zhang, Q., Li, M., Deng, Y., (2017); Measure the structure similarity of nodes in complex networks based on relative entropy, Physica A: Statistical Mechanics and its Applications,
10.1016/j.physa.2017.09.042, 2017.
[50] Zhang, X., Deng, Y., Chan, F. T. S., Adamatzky, A., Mahadevan, S., (2016); Supplier selec-tion based on evidence theory and analytic network process, Proceedings of the Institution of Mechanical Engineers, Part B: Journal of Engineering Manufacture, 230 (3), 562–573,
2016.
[51] Zhang, X., Mahadevan, S., (2017); A game theoretic approach to network reliability assess-ment, IEEE Transactions on Reliability, 66 (3), 875–892, 2017.
[52] Zheng, H., Deng, Y., Hu, Y., (2017); Fuzzy evidential influence diagram and its evaluation algorithm, Knowledge-Based Systems, 131, 28–45, 2017.
[53] Zheng, X., Deng, Y., (2017); Dependence assessment in human reliability analysis based on evidence credibility decay model and iowa operator, Annals of Nuclear Energy, accepted,
2017.
[54] Zhou, X., Deng, X., Deng, Y., Mahadevan, S., (2017); Dependence assessment in human reliability analysis based on d numbers and ahp, Nuclear Engineering and Design, 313,
243–252, 2017.
[55] Zhou, X., Shi, Y., Deng, X., Deng, Y., (2017); D-DEMATEL: A new method to identify critical success factors in emergency management, Safety Science, 91, 93–104, 2017.