Full Terms & Conditions of access and use can be found at
http://www.tandfonline.com/action/journalInformation?journalCode=taut20
Automatika
Journal for Control, Measurement, Electronics, Computing and
Communications
ISSN: 0005-1144 (Print) 1848-3380 (Online) Journal homepage: http://www.tandfonline.com/loi/taut20
Neural network-based data-driven modelling of
anomaly detection in thermal power plant
Lejla Banjanovic-Mehmedovic, Amel Hajdarevic, Mehmed Kantardzic,
Fahrudin Mehmedovic & Izet Dzananovic
To cite this article: Lejla Banjanovic-Mehmedovic, Amel Hajdarevic, Mehmed Kantardzic, Fahrudin Mehmedovic & Izet Dzananovic (2017) Neural network-based data-driven modelling of anomaly detection in thermal power plant, Automatika, 58:1, 69-79, DOI: 10.1080/00051144.2017.1343328
To link to this article: https://doi.org/10.1080/00051144.2017.1343328
© 2017 The Author(s). Published by Informa UK Limited, trading as Taylor & Francis Group
Published online: 07 Jul 2017.
Submit your article to this journal
Article views: 1240
REGULAR PAPER
Neural network-based data-driven modelling of anomaly detection in thermal
power plant
Lejla Banjanovic-Mehmedovic a, Amel Hajdarevicb, Mehmed Kantardzicc, Fahrudin Mehmedovicdand Izet Dzananovice
aDepartment of Automation and Robotics, Faculty of Electrical Engineering, University of Tuzla, Tuzla, Bosnia and Herzegovina;bRicardo Prague, Prague, Czech Republic.;cSpeed School of Engineering, University of Louisville, Louisville, KY, U.S.A;dABB Representation for Bosnia and Herzegovina, Tuzla, Bosnia and Herzegovina;eJP Elektroprivreda BiH–Power Plant Tuzla, Tuzla, Bosnia and Herzegovina
ARTICLE HISTORY Received 5 September 2016 Accepted 18 May 2017 ABSTRACT
The thermal power plant systems are one of the most complex dynamical systems which must function properly all the time with least amount of costs. More sophisticated monitoring systems with early detection of failures and abnormal behaviour of the power plants are required. The detection of anomalies in historical data using machine learning techniques can lead to system health monitoring. The goal of the research is to build a neural network-based data-driven model that will be used for anomaly detection in selected sections of thermal power plant. Selected sections are Steam Superheaters and Steam Drum. Inputs for neural networks are some of the most important process variables of these sections. All of the inputs are observable from installed monitoring system of thermal power plant, and their anomaly/ normal behaviour is recognized by operator’s experiences. The results of applying three different types of neural networks (MLP, recurrent and probabilistic) to solve the problem of anomaly detection confirm that neural network-based data-driven modelling has potential to be integrated in real-time health monitoring system of thermal power plant.
KEYWORDS
Anomaly detection; artificial neural networks; data-driven modelling approaches; thermal power plant
1. Introduction
Industrial systems have the purpose to perform a given production task in a given time and at given costs. A refinery, gas or thermal power plants need to be opera-tive all the time and it must function properly all the time with least amount of costs. The industrial units get damaged due to continuous usage and this should be detected as early as possible to prevent losses [1]. Anomalies that are detected through sensor data could be interpreted in many ways, it could be that one or more sensors are faulty or some components are faulty or something else is happening, thus it is important to study these phenomena and characteristics. An anom-aly detection approach defines a region of n -dimen-sional data space representing normal behaviour, and declares any observation in the data that does not belong to this normal region as an anomaly.
Recently, the attention has been devoted to improved monitoring systems for power plants [2,3]. Today, a large number of parameters are measured and saved in databases to be used for historical analysis etc. More sophisticated monitoring systems are required, with the possibility of being used in real time to detect failures and abnormal behaviour of the power plants by developing a graphical user interface. For effective and efficient engine health monitoring (EHM), a host of parameters are usually monitored
(speed, power, gas inlet pressure and temperature, exhaust and operating pressure) [4].
Various methods have been proposed by the scien-tific community and implemented in industrial appli-cations. Most of the approaches can be classified in three groups: rule-based expert systems, data-driven approaches also known as the data mining approach or machine learning approach and model-based approaches [5]. Rule-based expert systems use specific system knowledge of an expert to perform the diagno-sis task. In this process, one or more rules are triggered by some deviation of a system parameter. The model-based approach encodes human knowledge into a model. But this model is very time consuming and labour intensive, and the feasibility of modelling every part of a complex system is very low [1]. Data-driven approaches for anomaly diagnosis rely on the analysis of measured system data and thus lead to a utilization of the capabilities provided by the historical records of the system behaviour. A data-driven modelling approach uses available process information for chem-ical batch process operation as presented in [6], for Gas-Turbine in [7,8] and for Coal Fired Power plant in [9].
The main goal of our paper is to evaluate neural-networks as a data-driven modelling approach aimed at early anomaly detection in thermal power plant
CONTACT Lejla Banjanovic-Mehmedovic [email protected]
© 2017 The Author(s). Published by Informa UK Limited, trading as Taylor & Francis Group
This is an Open Access article distributed under the terms of the Creative Commons Attribution License (http://creativecommons.org/licenses/by/4.0/), which permits unrestricted use, distribution, and reproduction in any medium, provided the original work is properly cited.
VOL. 58, NO. 1, 69–79
without using a huge amount of training data. For this purpose, operational data from the system for moni-toring and control in Thermal Power Plant “Tuzla”, Bosnia and Herzegovina has been employed for the training of an artificial neural network (ANN) models. Our scientific goal is to prove that neural network is effective in determining anomalous regimes despite similarity of results for normal and anomaly data from thermal power plant and has potential to be integrated in real-time health monitoring system of thermal power plant.
The rest of this paper is organized as follows. Sec-tion 2describes the state-of-the-art for current anom-aly detection methods in industry plants. Section 3
describes the selected sections of thermal power plant.
Section 4 proposes the neural network based data-driven modelling. In Section 5, experimental results are presented to demonstrate the effectiveness of the proposed approach in selected sections of thermal power plant. Finally,Section 6concludes the paper.
2. Anomaly detection in industry plants
Anomaly detection refers to detecting patterns in a given data-set that do not conform to an established normal behaviour. The patterns thus detected are called anoma-lies [10]. Anomalies are also referred to as outliers.
Conventional anomaly detection techniques have been used for a long time, but with the development of computer technology modern anomaly detection tech-niques can be developed. Some of those techtech-niques are: distribution-based approaches, depth-based, clus-tering-based, distance based technique (k-nearest neighbour), density-based, spectral decomposition (principal component analysis, PCA), and classifi ca-tion approaches (support vector machines (SVM), neural networks), etc. [11].
Many approaches of anomaly detection have been developed and applied effectively to identify the anom-aly detection in industrial plants using different perfor-mance parameters. In paper [12], the proposed anomaly detector using PCA is validated using data from a power generation plant. The paper [13] presents a prognostics-based technique that reduces the LED qualification time. The similarity-based-met-ric test extracts features from the spectral power distri-butions using peak analysis, reduces the dimensionality of the features using PCA, and parti-tions the data-set of principal components into groups using a k-nearest neighbour clustering technique.
A combination of segmentation algorithms with a one-class SVM approach for efficient anomaly detec-tion in oil platform turbo-machines is presented in paper [10]. In paper [1], data mining techniques for classifying data streams at a refinery are shown. After clustering and identifying sensor failures, a new model for forecasting the occurrence of next sensor failure
was created. The paper [14] describes the design and development of a fuzzy-neural data fusion system for increased state-awareness of resilient control systems in hybrid energy systems.
The application of neural networks for anomaly detection in power plants is considered in papers [4,7,15,16].
The paper [14] describes about normal and abnor-mal vibration data detection procedure for a large steam turbine using ANN. Self-organization map (SOM) is trained with the normal data obtained from a thermal power station, and simulated with abnormal condition data from a test rig developed at laboratory. In [17], an event detection system using neural net-work (multilayer perception (MLP)) is trained with data from a nuclear power plant to help the operators in identifying anomalies and taking timely decisions. The example presented in [7] efficiently recognizes anomaly patterns of common combustion problems using ANN in a gas turbine. Back propagation (BPNN) and generalized regression (GRNN) neural network models were implemented for the perfor-mance based anomaly detection of a small sized gas turbine [4]. The comparison between neural networks based and statistical anomaly detection techniques for gas turbine data can be found in [18].
Our paper proposes neural network-based data-driven modelling in determining anomalous regimes in selected sections of thermal power plant without using a huge amount of training data. This modelling could be useful for effective and efficient system health monitoring.
3. Selected sections of thermal power plant
A thermal power plant, as a large and complex system, consists of multiple smaller systems that work together and ensure continuous electricity generation. One of the most important systems involved in thermal power plant operation is the plant’s boiler. The boiler represents the entire system that participates in the con-version of water into steam [19]. The most important sections are water-steam section, Feeedwater system, Steam Drum and Steam Superheather section, where the last sections are selected sections of the boiler (Steam Superheaters and Drums) for anomaly detection, pre-sented inFigure 1.
3.1. Water-steam section
This system is primarily engaged in converting water into steam and consists of multiple subsystems with separate functions. The system consists of multiple pipes and vessels. Heat exchange between different media occurs in this system in order to achieve optimal steam parameters. The steam is driven further to the turbine propelling it, which is essential for electricity
generation. Given that the quality and parameters of steam directly affect the electricity generation, anomaly detection in this system is of great importance for the plant. The most important process variables related to steam are temperature, pressure and steamflow which directly affects the current power output.
3.2. Feed-water system
One of the important subsystems of the boiler is the sys-tem for its feedwater supply, because without the feed-water supply there is no steam generation. After raw water is treated at the water chemical treatment plant, the water is stored in the feedwater tank. The water is distributed further from the tank into the feedwater pipe system using feedwater pumps. The pumps maintain the specified feedwater flow which is determined by the required power output. The purpose of this system is distribution of feedwater to the most important subsys-tem of the water-steam syssubsys-tem–the Steam Drum.
3.3. Steam Drums
The most important subsystem of the water-steam sys-tem is the Steam Drum, which is a large tank with the task of steam extraction from a water-steam mixture stored in the drum. Given the importance of the drum for electricity generation, it is logical that timely anom-aly detection is required in this system. The most important process variable in the drum is the water level. In addition to that, steam pressure, conductivity and pH value are also measured.
3.4. Steam superheaters
The steam generated in the Steam Drum is distributed through this system. After distribution of steam through this system, it is called the superheated steam. Steam Superheaters system consists of pipes mounted in the boiler that distribute the steam to the turbine. This system has a major role in removing moisture from the steam, which improves its quality. The temperature of steam generated in the drum still does not match the temperature needed in the process. The steam generated in the drum still contains a certain percentage of moisture. Such steam should not be distributed to the turbine due to the possibility of condensation on the blades. In every thermal power plant, there is a tendency to produce 100% quality steam. Because of that, the steam is heated in this sys-tem usingflue gases. Increasing the steam temperature results in removal of moisture from the steam and that is the primary goal of this system. The steam tempera-ture is increased by around 160C compared to steam temperature in the drum. The goal of the system is to maintain the temperature around 535 C, which is optimal for boiler analysed in this paper.
4. Neural network-based data-driven modelling
Classification, linear or non-linear problems, with or without underlying system dynamics guides the choices of network composition and the topology. The purpose of the assessment is to determine which
type of neural network based date-driven model fits best for anomaly detection problem.
The neural network-based data-driven modelling framework includes a few important phases: variables selections and data acquisition, plant behaviour model-ling, model validation using performance metrics and testing the performance of a trained different data-driven models.
4.1. Variables selection
Variables selection and data acquisition are the two key elements for successful modelling of systems behaviour and analysis [4]. Selected sections of thermal power plant for anomaly detection in our research are Steam Superheaters and Steam Drums. These sections consist of two separate systems each, which produce steam of adequate quality together.
The process variables from the Steam Superheaters for each separated system are: superheated steam tem-peratures (TS I and TS II), superheated steam flows (FS I and FS II) and superheated steam cooling water
flows (CWF I and CWF II).
There are multiple temperature sensors measuring the steam temperature in the superheaters, but due to its importance, only the measurement in front of the turbine is used for the anomaly detection analysis. The temperature is the most important process variable in this section because it is used in turbine and boiler pro-tection systems. Lowering or rising the temperature below or above the certain values with certain duration in any of the two systems instantly triggers protection that causes outage of the turbine and the boiler.
Superheated steamflow is a process variable which affects the unit power output and that is why it is important. Anomalies related to this variable can lead to generator power output anomalies, which, in some cases, may have an impact on the whole electric power system. The flow value must be above the required technological minimum for the unit to operate nor-mally. This variable is used in the protection systems combined with superheated steam pressure. As theflow depends on the pressure, there is no exact minimum value of theflow, but the protection is designed accord-ing to the steam pressure-flow function.
Superheated steam cooling waterflow has its role in temperature control and is related to anomalies related to the superheated steam temperature. However, the waterflow is not used in any of the protection systems. The variables from the Steam Drums for each sepa-rated system are: drum levels (DL I and DL II), drum pressures (DP I and DP II) and feed-waterflows (FWF I and FWF II).
Drum level must be maintained between the mini-mum and maximini-mum limits during the unit operation. The plant can be severely damaged if these limits are exceeded. For this reason, the level measurement is used in the protection systems. This variable is mea-sured in relation to some zero point, which means that the value can be negative.
There are also no protections related to drum sure, which is also not the usual practice. Yet, the pres-sure difference between the two drums is used in the protection systems. If the protection is triggered, coal and mazut supply to the boiler is stopped. If the abso-lute value of the pressure difference between the drums rises above 17 bar, mazut burners, coal feeders and coal pulverizers will be stopped.
Feedwaterflow is related to the drum level control. If the flow is not sufficient to meet the requirements related to the amount of water in the drum, the outage related to low drum level may occur. Besides that, cracks in the feedwater pipe system can be identified by using theflow measurements. If the cracks are identified, the outage is usually planned to repair the pipe system.
The data representing anomalous behaviour contain information about the system state in the initial stage of such behaviour and some time in the course of such state (5–10 min). The data do not necessarily represent the plant outage, but its unstable operating state. Also, the outage may occur for many other reasons (other than anomalous behaviour of the used process varia-bles), but it certainly has an impact on those variables because many of the plant’s subsystems are linked. The variables used in this paper can have an impact on those which are not, and vice versa.
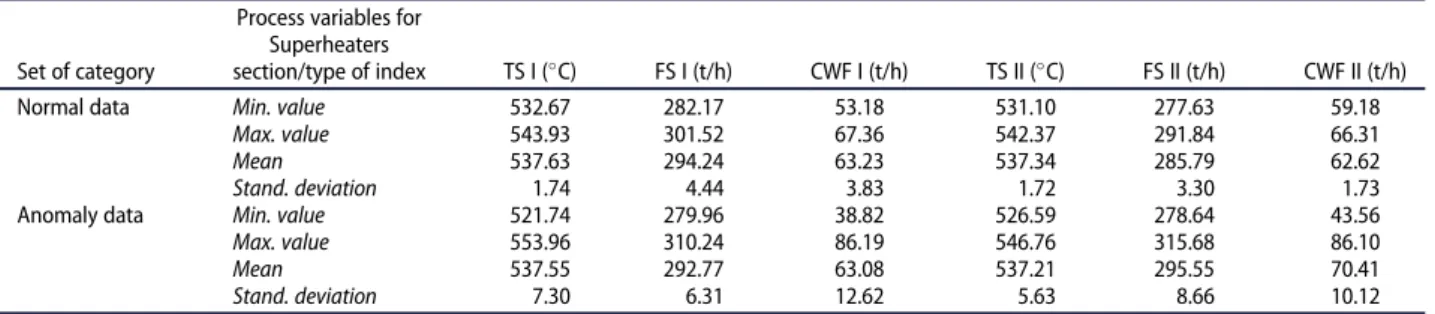
“Tables 1”and“2”summarize the statistical charac-teristics of process variables, used for anomaly detec-tion. The data are separated on the ones representing normal behaviour and the ones representing anoma-lous behaviour. The similarity between normal and
Table 1.Statistical characteristics of process varibales for Steam Superheaters.
Set of category
Process variables for Superheaters
section/type of index TS I (C) FS I (t/h) CWF I (t/h) TS II (C) FS II (t/h) CWF II (t/h) Normal data Min. value 532.67 282.17 53.18 531.10 277.63 59.18
Max. value 543.93 301.52 67.36 542.37 291.84 66.31
Mean 537.63 294.24 63.23 537.34 285.79 62.62
Stand. deviation 1.74 4.44 3.83 1.72 3.30 1.73 Anomaly data Min. value 521.74 279.96 38.82 526.59 278.64 43.56 Max. value 553.96 310.24 86.19 546.76 315.68 86.10
Mean 537.55 292.77 63.08 537.21 295.55 70.41
anomaly data is very attractive in our research, because it is not possible to use a simple method for the detec-tion of“anomaly”such as threshold valuesfor the input parameters. Scaling factors for input variables were not used because the data does not differ significantly in their amounts.
4.2. Neural network modelling
In the case of very complex time-varying and non-lin-ear systems, where reliable measurements are very complicated and valid mathematical models do not exist, a number of different methods from the area of Artificial Intelligence have been proposed. ANNs are massively parallel-interconnected networks that have the ability to perform pattern recognition, classification and prediction. ANN learning can solve problems with the noisy and complicated training data and it is robust to errors in the training data-set.
ANNs represent an important class of anomaly detection techniques [15]. For anomaly detection, it is needed to relate the measurement data to the ideal per-formance, and distinguish between normal and abnor-mal states [3]. The accuracy of classification by ANN benefits from its classifier algorithm, which determines the best solution by trying to minimize the number of incorrectly classified cases during the training process. The choice of network architecture is dependent on the problem [4,20]. The implemented data-driven modelling approach utilizes three supervised diverse paradigms of artificial neural-networks: MLP, Elman recurrent neural network (ERNN) and probabilistic neural networks (PNN).
MLP neural networks are commonly used in pat-tern recognition, where the main problem is classifi ca-tion of an unseen instance into one of the existing classes. Due to this fact, MLP neural networks are a logical choice as an anomaly detection technique [21]. MLP is a feedforward ANN which consists of input, output and one or more hidden layers of nodes arranged in parallel between input and output layers. Logarithmic and sigmoid functions are commonly used activation functions in hidden layers, while linear functions are used in the output layer. MLP neural net-works use a learning algorithm called back propagation
(BP). Levenberg–Marquardt (LM) algorithm has been used for network training, validation and testing as it
finds the best weights by minimizing the function. The wight updateDwji(n)is defined by the general-ized rule: Dwji ð Þ ¼ n h @E nð Þ @wjið Þn yjð Þ ¼ n hejð Þn ’0j vjð Þn yjð Þn (1) whereh represents a learning rate parameter used by the network, ej are output node errors, vl are the
weighted sum of the weighted inputs and yl are the
level network outputs.
Recurrent neural networks (RNNs) use a feedback loop in their hidden layers [22]. Therefore, this type of network can be used to solve complex problems that some feedforward networks cannot solve, but the downside is that some additional learning difficulties may occur.
A RNN used as parameter anomaly detection tech-nique in this paper is the ERNN, which usually has only one hidden layer with a feedback loop, but multi-ple hidden layers can be also used. The feedback loop present in this type of neural network returns a hidden layer output value which is used as an input for the next iteration. Activation functions in hidden and out-put layers are very similar to the MLP neural network (a tansigmoid function is used in the hidden layer while a linear function is used in the output layer). Synaptic weight adjustments are calculated as:
Dwij ð Þ ¼t m X k2U ekð Þt pkijð Þt (2) where pkij ð Þ ¼t @ykð Þt @wij (3) @ykðtþ1Þ @wij ¼f0k ðvkð Þt Þ X leU wkl@ ylð Þt @wij þdikzjð Þt " # (4) yk ðtþ1Þ ¼fk ðvkð Þt Þ (5)
Table 2.Statistical characteristics of process varibales for Steam Drums.
Set of category
Process variables for Steam Drums
section/type of index DL I (C) DP I (t/h) FWF I (t/h) DL II (C) DP II (t/h) FWF II (t/h) Normal data Min. value 81.02 133.05 224.60 76.63 133.20 208.08
Max. value 119.39 137.08 252.12 120.09 137.52 239.56
Mean 97.21 135.64 241.50 104.05 135.07 218.28
Stand. deviation 8.30 0.97 7.70 9.53 0.79 7.96
Anomaly data Min. value 42.71 135.65 216.84 55.57 136.65 220.24 Max. value 129.39 143.80 291.92 112.25 144.02 268.96
Mean 85.41 141.22 245.16 84.11 141.62 241.71
dik¼ 1; i¼k
0; others
(6) vkare conflutation functions, ykare output node values
andekare errors of output node.
Probabilistic neural networks (PNNs) belong to the stochastic neural networks group [20]. The probabilis-tic neural net is based on the theory of Bayesian
classi-fication and the estimation of probability density function (PDF).
The PNN works by creating a set of multivariate probability densities that are derived from the training vectors presented to the network. The summation layer neurons compute the maximum likelihood of patternx
being classified into cby summarizing and averaging the output of all neurons that belong to the same class:
pi ð Þ ¼x 1 ð2pÞn=2sn 1 Ni XNi i¼1 e xxij ð ÞT xxij ð Þ 2s2 (7)
where Ni denotes the total number of samples in
class c, n is the number of features of the input instance x, s is the smoothing parameter and xijis a
training instance corresponding to categoryc.
The test instance with low probability with respect to established PDFs is considered as abnormal. The accuracy of these methods heavily depends on the used threshold.
If the a’priori probabilities for each class are the same, and the losses associated with making an incor-rect decision for each class are the same, the decision layer unit classifies the pattern x in accordance with the Bayes’decision rule based on the output of all the summation layer neurons:
C xð Þ ¼argmaxfpið Þx g; i¼1;2;. . .;c (8) where C(x) denotes the estimated class of the pattern x and m is the total number of classes in the training samples. If the a’priori probabilities for each class are not the same and the losses associated with making an incorrect decision for each class are different, the output of all the summation layer neurons will be
C xð Þ ¼argmax pið Þcostx ið Þx aproið Þx
; i¼1;2;. . .;c
(9) where cost(ix) is the cost associated with misclassifying the input vector andapro(ix) is the prior probability of occurrence of patterns in classc.
The advantages of this network type are: rapid training process (faster than BP based networks), guaranteed convergence to the optimal classification with increasing data set and the ability to change the number of learning inputs with minimal or no addi-tional training.
4.3. Performance metrics
The choice of an evaluation measure depends on the domain of use and the given problem. Each of them has specific characteristics that emphasize different aspects of the evaluation of algorithms [23,24]. There are four possible outcomes of anomaly detection. True positive (TP) and true negative (TN) outcomes repre-sent a correct classification, while false negative (FN) and false positive (FP) outcomes represent an incorrect one. Both types of incorrect classifications represent a hazard. FPs can cause an action which is not needed, but FNs are actually more dangerous because an anomaly would be ignored. Based on these counts, the following performance metrics are calculated: accuracy (ACC), sensitivity or true positive rate (TPR) or recall, specificity or true negative rate (TNR), precision (PR) or positive predictive value (PPV), negative predictive value (NPR) and F1 score [24].
The main verification measure is accuracy (ACC), which is defined as the proportion of correctly
classi-fied instances against all (correctly and incorrectly clas-sified) instances. It is calculated as follows:
ACC¼ TPþTN
TPþFPþFNþTN (10) In addition to this measure, some measures that take into account if the outcome is positive or negative are also used. The most commonly used pair is sensi-tivity or true positive rate (TPR) and specificity or TNR. These are calculated as follows:
TPR¼ TP
TPþTN (11)
TNR¼ TN
TPþTN (12)
These measures take into account every type of anomaly that may occur and are not influenced by class distribution because each of them refers to only one class. In contrast to sensitivity and specificity, there are also measures that are influenced by class dis-tribution. There is a pair of measures used. These are recall, calculated using “(11)”, and precision (PR) which is calculated as follows:
PR¼ TP
TPþFP (13)
These measures are commonly used if the number of true negatives exceeds the number of TPs by far. The last pair of measures used in this paper is a pair of predictive values (positive and negative) based on pre-cision. The positive predictive value (PPV), calculated using“(13)”, represents precision in positive outcomes and the negative one (NPR) represents the same in negative classification outcomes and is calculated as
follows:
NPR¼ TN
TNþFN (14)
These measure pairs are used as verification meas-ures from different points of view. Maintaining good scores for all of the measures is often an optimization problem. Sometimes improving the score of one mea-sure decreases the score of the other and vice versa. If there is a desire for verification using only one mea-sure, it can be done by fixing the score of the other measure of the same pair. However, it is more often that only one measure, called the F1 score, is used. It is calculated as follows:
F1¼ 2TP
2TPþFPþFN (15)
4.4. Evaluating classifiers
The basis of all measures to evaluate the model is mea-suring its effectiveness, i.e. estimation of the ability of the classifier to correctly classify as many of the exam-ples that were not involved in the process of creating a model as possible. Therefore, it is not customary in the process of generating models to use all the available examples of a well-known classification. The most popular result validation or evaluation technique is cross-validation [24]. The goal of cross-validation is to define a data-set to test the model in the training phase in order to limit problems like overfitting, give an insight on how the model will generalize to an inde-pendent dataset (i.e. an unknown dataset, for instance from a real problem). From this reason, the initial set of examples is divided into three parts: the training, validation and test data-set. The training data is used to build the model and validation is usually used for parameter selection and to avoid overfitting. On the contrary, test data-set is only used to test the perfor-mance of a trained model. There are no general rules on how to choose the number of observations in each of the three parts. The idea is to separate the available data into a training data set (50%, 60% to 70% of the data) and remaining (25 to 20% or 15%) each for validation and testing.
The better approach would be to repeat the previous procedure multiple times, titled as k-fold cross-valida-tion. The idea behind k-fold cross-validation is to divide all the available data intok roughly equal-sized groups. In each iteration of k-fold cross-validation,k-1
groups are used for training and the remaining one is used for testing. The k-fold cross-validation iterates through a number of folds. After thefirst iteration, the next group is used for testing, and the remaining data are used for training. This procedure repeats until all of the groups are used for testing once. The main
disadvantage is the potential for different validation results due to stochastic process of group forming at the beginning of the validation process. The k-fold cross-validation can give different results each time it is performed. This can be avoided by repeating the process multiple times and using the mean validation result. In order to improve the training phase the 10-fold cross-validation was selected for thefinal estima-tion of algorithms [12].
5. Experimental results
In this paper, the MLP, Elman and PNN neural net-work-based data-driven modelling of anomaly detec-tion was developed using the Matlab/NN toolbox functions. The performance and robustness of the dif-ferent networks were compared so that the best data-driven model in terms of accuracy, performance and cost could be selected among available architectures.
5.1. Data setting
The selections of input variables of the ANN have been made based on the physical significance, working and thermodynamic principles of the thermal turbine oper-ation. For the current work, six input parameters (which statistical characteristics are presented in
Tables 1and2) are used for training and validation of the ANN model as well as testing and simulations for each selected section. The operational data was col-lected from an actual system for monitoring and con-trol of thermal power plant“Tuzla”with the sampling period of 1 s. There are 962 instances that represent normal behaviour and the same amount representing anomalous behaviour in the input data-set. The data set is divided into a training data set (70% of the data), a validation set (15% of the data) and a test data-set (15% of the data). Scores of an ideal classification would all be the same (value 1 for ACC, PR, NPR and F1), except TPR and TNR (value 0.5). Given that the initial synaptic weights are chosen randomly, it is pos-sible to obtain different results if a neural network is trained and tested multiple times. Therefore, all of the obtained results are obtained from average confusion matrices.
5.2. Neural network parameters setting
The parameters used for MLP neural network-based anomaly detection are: number of neurons in hidden layers, learning rate, number of epochs and learning momentum. The number of hidden layers can be increased depending on the problem. However, a MLP with three hidden layers is sufficient to map every con-tinuous function by adding a certain number of neu-rons to meet required complexity [16,25]. From this reason, in our experiments, the number of hidden
layers used during the whole process is 3. The learning rate and the momentum are two important parameters for training the MLP network successfully. The range of neural networks parameters changing is for number of neurons in hidden layers: [10,... 30] with step 5, for the learning rate parameter: [0.001, 0.01, 0.05, 0.1, 0.3], for the number of epochs: [100,..900] with step 200 and for the momentum: [0.1,..0.9] with step 0.2. The search space of neural network structure parameters is created using only one parameter changing principle withfixing of all others.
Another type of neural network used for anom-aly detection is the ERNN. Results are obtained in similar manner as the results of MLP neural net-works, by network parameter changes. The parame-ters used are: number of neurons in hidden layers, learning rate, number of epochs and momentum. The initial parameters of ERNN are similar to the initial parameters of MLP neural network (the number of neurons in hidden layer is 10, there are 3 hidden layers etc.). Also, most of the changes fol-low the same principle. Differences were in the number of epochs [50…250] and the momentum range is [0.9...0.1].
Due to the nature of PNN neural networks type, there are not many parameters that can be changed for PNN (opposite of MLP and ERNN). Number of neurons depends on the number of instances used in input data-set. The PNN gives high values for ACC or F1 (near 1.0). The spread coefficient values for both sections are varied between 0.5 and 5 [26].
5.3. Discussion and recommendations
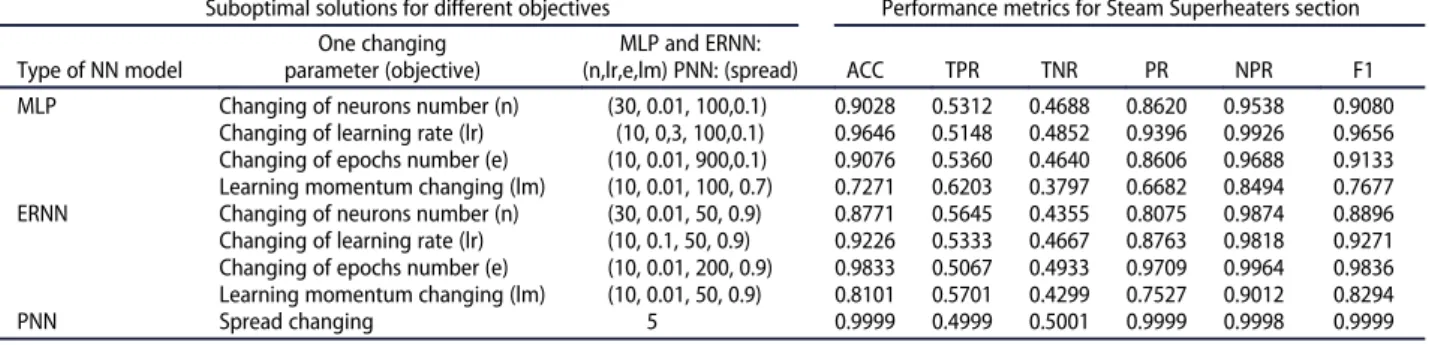
The comparison of neural network data-driven model-ling (MLP, ERNN and PNN) was obtained by network parameter changes. If we treat this problem as multi-objective optimization task, where each multi-objective is defined as specified neural network parameter chang-ing, we got the optimal front, which consist of more suboptimal results, presented inTable 3for Superheat-ers section and in Table 4 for Steam Drums section, respectively. For PNN, the spread coefficient is only one objective for creating search space of neural net-work structures. We calculated all performance metrics (ACC, TPR, TNR, PR, NR, F1) [27]. In this research, we found optimal front of the neural network struc-tures instead of the optimal parameters of neural net-works, which requires more complex methods.
For both selected sections, the PNN provide better results for all performance metrics. Namely, PNN model achieves the total accuracy, PR, NPR and F1 score of 99.9% for selected best parameters of NN modelling.
The ERNN provides a bit better results (81%–98%) compared to the MLP neural network (72%–97%) with test data from Steam Superheaters. The similar situation is with test data from Steam Drums: the ERNN provides a bit better results (94%–98%) com-pared to the MLP neural network (89%–97%) .
The both neural network types (MLP and ERNN) give the better classification results for the Steam Drums section (87%–97%) compared to the Steam Superheaters section (72%–97%). ACC and F1 score are higher for similar parameters for Steam Drums sec-tion then for Steam Superheaters secsec-tion. This is
Table 3.Comparison of MLP, ERNN and PNN data-driven modelling results for Steam Superheaters.
Suboptimal solutions for different objectives Performance metrics for Steam Superheaters section Type of NN model
One changing parameter (objective)
MLP and ERNN:
(n,lr,e,lm) PNN: (spread) ACC TPR TNR PR NPR F1 MLP Changing of neurons number (n) (30, 0.01, 100,0.1) 0.9028 0.5312 0.4688 0.8620 0.9538 0.9080
Changing of learning rate (lr) (10, 0,3, 100,0.1) 0.9646 0.5148 0.4852 0.9396 0.9926 0.9656 Changing of epochs number (e) (10, 0.01, 900,0.1) 0.9076 0.5360 0.4640 0.8606 0.9688 0.9133 Learning momentum changing (lm) (10, 0.01, 100, 0.7) 0.7271 0.6203 0.3797 0.6682 0.8494 0.7677 ERNN Changing of neurons number (n) (30, 0.01, 50, 0.9) 0.8771 0.5645 0.4355 0.8075 0.9874 0.8896 Changing of learning rate (lr) (10, 0.1, 50, 0.9) 0.9226 0.5333 0.4667 0.8763 0.9818 0.9271 Changing of epochs number (e) (10, 0.01, 200, 0.9) 0.9833 0.5067 0.4933 0.9709 0.9964 0.9836 Learning momentum changing (lm) (10, 0.01, 50, 0.9) 0.8101 0.5701 0.4299 0.7527 0.9012 0.8294 PNN Spread changing 5 0.9999 0.4999 0.5001 0.9999 0.9998 0.9999
Table 4.Comparison of MLP, ERNN and PNN data-driven modeling results for Steam Drums.
Suboptimal solutions for different objectives Performance metrics for Steam Drums section Type of NN model
One changing parameter (objective)
MLP and ERNN:
(n,lr,e,lm) PNN: (spread) ACC TPR TNR PR NPR F1 MLP Changing of neurons number (n) (25, 0.01, 100,0.9) 0.9383 0.5202 0.4798 0.9142 0.9660 0.9406
Changing of learning rate (lr) (10, 0.3, 100,0.9) 0.9799 0.5011 0.4989 0.9779 0.9819 0.9799 Changing of epochs number (e) (10, 0.01, 900,0.9) 0.9542 0.5160 0.4840 0.9280 0.9837 0.9555 Learning momentum changing (lm) (10, 0.01, 100, 0.7) 0.8920 0.5387 0.4613 0.8444 0.9549 0.8990 ERNN Changing of neurons number (n) (25, 0.01, 50, 0.9) 0.9573 0.5198 0.4802 0.9251 0.9947 0.9588 Changing of learning rate (lr) (10, 0.05, 50, 0.9) 0.9778 0.4964 0.5036 0.9845 0.9712 0.9776 Changing of epochs number (e) (10, 0.01, 200, 0.9) 0.9747 0.4963 0.5037 0.9817 0.9678 0.9745 Learning momentum changing (lm) (10, 0.01, 50, 0.9) 0.9450 0.5227 0.4773 0.9137 0.9819 0.9473
somewhat expected, because there is a greater differ-ence between the data representing anomalous behav-iour and the data representing normal behavbehav-iour for the Steam Drums.
The effectiveness of those different neural network approaches for anomaly detection is demonstrated in
Figure 2 (for Steam Superheaters section) and in
Figure 3(for Steam Drums section). The same number of anomalies and normal samples are used for presen-tation of results for both sections (Steam Superheaters and Steam Drums).
Although the MLP and the ERNN give good results, a few number of FP classifications is notice-able on bothfigures (from Table 3 for Steam Super-heaters section, TPR values are for MLP: 0.53–0.62 and for ERNN: 0.53–0.57). This is compensated by reducing the number of FN classifications (TNR for MLP: 0.38–0.49 and for ERNN: 0.43–0.49), which is more important. This is one more reason why PNN data-driven modelling can be chosen as the best for anomaly detection for those data from thermal power plant.
Figure 2.(a). The three process variables fromfirst separated system (TS I, FS I and CWF I); (b). the three process variables from sec-ond separated system (TS II, FS II and CWF II); (c). the comparison of MLP (10,0.3,100,0.1), Elman (10,0.05,50,0.9) and PNN(5) output (anomaly detection) with desired output variable for Steam Superheaters section.
6. Conclusion
Anomaly detection is an important problem that has been researched within different research areas and application domains. The industrial units get damaged due to continuous usage and this should be detected as early as possible to prevent losses. How the thermal power plant system is one of the most complex dynam-ical systems which must function properly all the time with least amount of costs, it is very important to have correct anomaly detection in system.
This paper presents the comparative study of differ-ent neural network based data-driven models to explore possibilities of anomaly detection in selected
sections of “Tuzla” thermal power system. All of the inputs are observable from monitoring system of ther-mal power plant, and their another-maly/norther-mal behaviour is recognized by operator’s experiences. Experimental results demonstrate that neural networks are highly successful for early anomaly detection, especially PNN model achieves the total accuracy, PR, NPR and F1 score of 99.9% for selected best parameters of NN modelling.
Only some data from large sections of the boiler were included in the analysis provided in this paper. The future research could be extended in next direc-tions: to many other (smaller) sections as data sources, to optimal neural network structures and to including
Figure 3.(a). The three process variables fromfirst separated system (DL I, DP I and FWF I); (b). the three process variables from sec-ond separated system (DL II, DP II and FWF II); (c).the comparison of MLP (10,0.3,100,0.1), Elman (10,0.01,200,0.9) and PNN (5) out-put with desired one (anomaly detection) with desired one for six process inout-put variables from Steam Drums section.
this anomaly detector as standalone application inte-grated in modern real-time health monitoring system of the thermal power plant.
Disclosure statement
No potential conflict of interest was reported by the authors. ORCID
Lejla Banjanovic-Mehmedovic
http://orcid.org/0000-0002-3810-8645
References
[1] Saybani MR, Wah TY, Amini A, et al. Anomaly detec-tion and predicdetec-tion of sensors faults in a refinery using data mining techniques and fuzzy logic. Sci Res Essays. 2011;6(27):5685–5695.
[2] Fast M. Artificial neural networks for gas turbine mon-itoring [PhD dissertation]. Lund: Lund University; 2010.
[3] Kim H, Na MG, Heo G. Application of monitoring, diagnosis in thermal performance analysis for nuclear power plants. Nucl Eng Technol.2014;46(6):737–752. [4] Kumar A, Srivastava A, Banerjee A, et al. Performance
based anomaly detection analysis of a gas turbine engine by artificial neural network approach. Proceedings of the Annual Conference of Prognostics and Health Manage-ment Society;2012Sept 23–27; Minneapolis, MN. [5] Roth M. Identification and fault diagnosis of industrial
closed-loop discrete event systems (PhD. dissertation). Kaiserslautern (Germany): Engineering Sciences, Tech-nische Universitat Kaiserslautern;2010.
[6] Wang D. Robust data-driven modeling approach for real-timefinal product quality prediction in batch pro-cess operation. IEEE Trans Ind Inf.2011;7(2):371–377. [7] Allegorico C, Mantini V. A data-driven approach for
on-line gas turbine combustion monitoring using clas-sification models. Proceeding of European Conference of the Prognostics and Health Management Society; 2014Jul 8–10; Nantes, France.
[8] Asgari H, Chen XQ, Sainudiin R. Modelling and simu-lation of gas turbines. Int J Model Identification Cont. 2013;20(3):253–270.
[9] Daneshvar M, Rad BF. Data driven approach for fault detection and diagnosis of boiler system in coalfired power plant using principal component analysis. Int Rev Auto Cont.2010;3(2):198–208.
[10] Wu SX, Banzhaf W. The use of computional intelli-gence in intrusion detection systems: a review. Appl Soft Comput.2010;10(1):1–35.
[11] Mart? L, Sanchez-Pi N, Molina JM, et al. Anomaly detection based on sensor data in petroleum industry applications. Sensors.2015;15:2774–2797.
[12] Tobar FA, Yacher L, Paredes R, et al. Detection in power generation plants using similarity-based modeling and multivariate analysis. 2011 American Control Con-ference on O’Farrell Street;2011Jun 29–Jul 1; San Fran-cisco, CA.
[13] Chang M-H, Chen C, Das D, et al. Anomaly Detection of light-emitting diodes using the similarity-based-metric test. IEEE Trans Ind Inf.2014;8(3):1852–1863. [14] Ondrej L, Manic M, McJunkin RT. Anomaly detection
for resilient control systems using fuzzy-neural data fusion engine. In Proceedings of IEEE Symposium on Resilience Control Systems; Boise, ID;2011.
[15] Kumar KP, Rao KVNS, Krishnan KR, et al. Neural net-work based vibration analysis with novelty in data detection for a large steam turbine. Shock Vibr. 2012;19(1):25–35.
[16] Kaminski M, Kowalski CT, Orlowska-Kowalska T. General regression neural networks as rotor fault detectors of the induction motor. In IEEE International Conference on Industrial Technology(ICIT’10). 2010 Mar 14–17; Chile. pp. 1239–1244.
[17] Patra SR, Jehadeesan R, Santosh TV, et al. Neural net-work model for an event detection system in prototype fast breeder reactor. Int J Recent Technol Eng (IJRTE). 2014;2(6):2277–3878.
[18] Kumar A, Banerjee A, Srivastava A, et al.“Gas Turbine engine operational data analysis for anomaly detection: statistical vs. neural network approach.”,In 26th Cana-dian Conference of Electrical and Computer
Engineer-ing (CCECE), Regina, Saskatchewan; 2013 May 5–8;
Canada.
[19] Gilman GF. Boiler control systems engineering. 2nd ed. Wood Dale, IL: International Society of Automation (ISA);2010.
[20] Devaraju S, Ramakrishnan S. Detection of accuracy for intrusion detection system using neural network
classi-fier., In Proceedings of the Conference on Information Systems and Computing (ICISC-2013);2013 Jan 4–5; Chennai, India.
[21] Akhoondzadeh M. A MLP neural network as an inves-tigator of TEC time series to detect seismo-ionospheric anomalies. Adv Space Res.2013;51(11):2048–2057. [22] Anyanwu LO, Keengwe J, Arome GA. Scalable
intru-sion detection with recurrent neural networks. Int J Multi Ubiquitous Eng.2011;6(1):21–28.
[23] Suljic M, Banjanovic-Mehmedovic L, Dzananovic I, et al. Determination of coal quality using Artificial Intelligence Algorithms, J Sci Ind Res.2013;72(6):379– 386.
[24] James G, Witten D, Hastie T, et al. An introduction to statistical learning with applications in R. New York, NY: Springer Science + Business Media;2013.
[25] Riad A, Elminir H, Elattar H. Evaluation of neural net-works in the subject of prognostics as compared to lin-ear regression model”. Int J Eng Technol IJET-IJENS. 2010;10(6):52–58.
[26] Hajdarevic A, Dzananovic I, Banjanovic-Mehmedovic L, et al. Anomaly detection in thermal power plant using probabilistic neural network. In Proceedings of IEEE MIPRO2015. Opatija, Croatia; 2015; pp. 1321– 1326.
[27] Hajdarevic A, Banjanovic-Mehmedovic L, Dzananovic I, et al. Recurent neural network as a tool for parameter anomaly detection in thermal power plant. Int J Sci Eng Res.2015;6(8):448–455.

![Synthesis, biological evaluation and molecular docking studies of 6-(4-nitrophenoxy)-1H-imidazo[4,5-b]pyridine derivatives as novel antitubercular agents: future DprE1 inhibitors](data:image/gif;base64,R0lGODlhAQABAIAAAP///wAAACH5BAEAAAAALAAAAAABAAEAAAICRAEAOw==)