University of Zurich
Main Library
Strickhofstrasse 39
CH-8057 Zurich
www.zora.uzh.ch
Year: 2017
Interactive visualization of large-scale geographic data
Thöny, Matthias
Abstract: Geographic information systems progress strongly in a lot of different application domains.
In addition, the gathering of geographic information is inevitable and large-scale geographic databases
and server infrastructures need to handle this amount of data. Geographic data is growing in precision
and complexity, so that it is necessary to explore and analyse datasets in an interactive way.
Interac-tive visualization is key to explore geographic data sets and therefore indispensable for everyone using
geographic data. In the following, new ways for interactive rendering techniques are presented to handle
the challenges in nowadays large- scale geographic information systems. The thesis starts with an
in-troduction to geographic information systems followed by an analysis of requirements and challenges for
geographic visualization systems and virtual globe systems. Furthermore, an introduction to the
render-ing pipeline is presented. To face the challenges of today’s geographic visualization systems we introduce
the GlobeEngine framework which enables a modular structure for rapid prototyping of geographic
vi-sualization applications and also contains all running prototypes of this work. The main algorithmic
contribution of this thesis is new rendering techniques, namely a new version of the RASTeR terrain
engine, an innovative technique for rendering vector maps for interactive terrain and map visualizations
and a novel graph bundling technique using vector maps as basis for bundling paths in an interactive 3D
perspective environment. Terrain visualization is the basis for an interactive 3D geographic visualization
system. However, it is hard for decision-makers to clearly identify the best choice of terrain rendering
algorithms. Therefore, this work provides an overview over terrain rendering requirements and existing
terrain rendering solutions as well as their applicability to modern graphics systems. Furthermore, this
thesis shows how RASTeR can be adapted to modern graphics hardware and a set of terrain visualization
features, such as edge highlighting, ambient occlusion or terrain slope, aspect and flow visualizations to
extend the capabilities of the existing terrain visualization. Often, vector map visualizations are used
on top of 3D terrain rendering. In- interactive rendering of large-scale vector maps is a key challenge
for high-quality geographic visualization software systems. This thesis contains a novel approach for the
visualization of large-scale vector maps over detailed height-field terrains. This method uses a deferred
line shading approach to render large-scale vector maps directly in a screen-space shading stage over a
terrain visualization. The fact that there is no traditional geometric polygonal rendering involved allows
our algorithm to outperform conventional vector map rendering algorithms for geographic information
systems. A flexible clustered deferred line rendering approach allows a user to interactively customize and
apply advanced vector styling methods, as well as the integration into a vector map level-of-detail system.
Dense line graphs and polyline maps are challenging for interactive visualization in geographic
informa-tion systems. Bundling techniques are a common approach to reduce clutter and have successfully been
demonstrated for the display of complex planar graphs. Previous techniques typically applied some forms
of attraction or repulsion forces to bundle edges. In geographic visualizations, it is often necessary to
take the semantic information into account and constrain path bundles to follow some reference network
vector map. This thesis applies a novel method which uses geographic vector map reference information
to route, visualize and simplify path bundles along their network paths in a constrained environment
using adaptive B-splines. The thesis is concluded by a summary and a future work section presenting
future research topics.
Dissertation
Published Version
Originally published at:
Thöny, Matthias. Interactive visualization of large-scale geographic data. 2017, University of Zurich,
Faculty of Economics.
Department of Informatics
Interactive Visualization of
Large-Scale Geographic Data
Dissertation submitted to the Faculty of Business, Economics and Informaticsof the University of Zurich to obtain the degree of
Doktor / Doktorin der Wissenschaften, Dr. sc. (corresponds to Doctor of Science, PhD) presented by
Matthias Thöny
from Planken, Liechtenstein
approved in April 2017 at the request of Prof. Dr. Renato Pajarola Prof. Dr. Lorenz Hurni Prof. Dr. Michael Böhlen
The Faculty of Business, Economics and Informatics of the University of Zurich hereby authorizes the printing of this dissertation, without indicating an opinion of the views expressed in the work.
Zurich, April 5, 2017
Geographic information systems progress strongly in a lot of different application domains. In addition, the gathering of geographic information is inevitable and large-scale geographic databases and server infrastructures need to handle this amount of data. Geographic data is growing in precision and complexity, so that it is necessary to explore and analyse datasets in an interactive way. Interactive visualization is key to explore geographic data sets and therefore indispensable for everyone using geographic data. In the following, new ways for interactive rendering techniques are presented to handle the challenges in nowadays large-scale geographic information systems.
The thesis starts with an introduction to geographic information systems fol-lowed by an analysis of requirements and challenges for geographic visualization systems and virtual globe systems. Furthermore, an introduction to the rendering pipeline is presented. To face the challenges of today’s geographic visualiza-tion systems we introduce theGlobeEngineframework which enables a modular structure for rapid prototyping of geographic visualization applications and also contains all running prototypes of this work.
The main algorithmic contribution of this thesis are new rendering techniques, namely a new version of theRASTeRterrain engine, a innovative technique for rendering vector maps for interactive terrain and map visualizations and a novel graph bundling technique using vector maps as basis for bundling paths in a inter-active 3Dperspective environment.
Terrain visualization is the basis for an interactive 3Dgeographic visualization i
system. However, it is hard for decision makers to clearly identify the best choice of terrain rendering algorithms. Therefore, this work provides an overview over terrain rendering requirements and existing terrain rendering solutions as well as their applicability to modern graphics systems. Furthermore, this thesis shows howRASTeRcan be adapted to modern graphics hardware and a set of terrain vi-sualization features, such as edge highlighting, ambient occlusion or terrain slope, aspect and flow visualizations to extend the capabilities of the existing terrain vi-sualization.
Often, vector map visualizations are used on top of 3Dterrain rendering. In-teractive rendering of large-scale vector maps is a key challenge for high-quality geographic visualization software systems. This thesis contains a novel approach for the visualization of large-scale vector maps over detailed height-field terrains. This method uses a deferred line shading approach to render large-scale vector maps directly in a screen-space shading stage over a terrain visualization. The fact that there is no traditional geometric polygonal rendering involved allows our algorithm to outperform conventional vector map rendering algorithms for geographic information systems. A flexible clustered deferred line rendering ap-proach allows a user to interactively customize and apply advanced vector styling methods, as well as the integration into a vector map level-of-detail system.
Dense line graphs and polyline maps are challenging for interactive visual-ization in geographic information systems. Bundling techniques are a common approach to reduce clutter and have successfully been demonstrated for the dis-play of complex planar graphs. Previous techniques typically applied some forms of attraction or repulsion forces to bundle edges. In geographic visualizations, it is often necessary to take the semantic information into account and constrain path bundles to follow some reference network vector map. This thesis applies a novel method which uses geographic vector map reference information to route, visualize and simplify path bundles along their network paths in a constrained environment using adaptive B-splines.
The thesis is concluded by a summary and a future work section presenting future research topics.
Geografische Informationssysteme werden in verschiedensten Anwendungsgebi-eten verst¨arkt eingesetzt. Zus¨atzlich zu einer verst¨arkten Nutzung werden im-mer mehr geografische Daten erfasst und verarbeitet. Durch diese intensivere Nutzung von geografischen Informationssystemen ist es notwendig Infrastruktur wie Serversysteme und Datenbanken an die Herausforderungen anzupassen. Die Masse an geografischen Daten w¨achst ebenfalls durch mehr Pr¨azision und Kom-plexit¨at in der Erfassung und Verarbeitung. Um eine sehr grosse Masse an ge-ografischen Daten zu analysieren, sind interaktive Werkzeuge und Visualisierun-gen notwendig. Somit ist das Gebiet der interaktiven Visualisierung ein wichtiger Forschungszweig f¨ur das Erkunden und Verstehen von grossen Daten und auch unerl¨asslich f¨ur die Arbeit mit geografischen Daten. Im Folgenden werden neue interaktive Bildverarbeitungsmethoden f¨ur die Visualisierung von geografischen Daten pr¨asentiert. Mit Hilfe dieser Methoden lassen sich aktuelle Problemstellun-gen in der Bildverarbeitung von interaktiven geografischen AnwendunProblemstellun-gen l¨osen.
Die Einleitung in diese Dissertation erfolgt anhand einer Anforderungsanaylse von geografischen Informationssystemen. Es werden verschiedene Anforderun-gen und Problemstellung im Zusammenhang mit der Entwicklung von interak-tiven Anwendung zur Visualisierung von geografischen Daten, wie bspw. eines interaktiven Globus, er¨ortert. Um interaktive Visualisierung zu verstehen wird zuerst auf den Bildverarbeitungsprozess in interaktiven Anwendungen eingegan-gen und anhand des Anwendungsframeworks, dass f¨ur diese Dissertation erstellt wurde grunds¨atzliche Aspekte erkl¨art. DieGlobeEngineerm¨oglicht interaktive
geografische Anwendungen zu erstellen und l¨ost Probleme im Zusammenhang mit der Echtzeitdarstellung von Szenen in geografischen Anwendungen. Weiters erm¨oglicht dasGlobeEngineFramework die schnellere Entwicklung von Proto-typen f¨ur Visualisierungsprogrammen. Gleichzeitig werden alle entwickelten Pro-totypen im Zuge dieser Arbeit in diesem Programmpaket zur Verf¨ugung gestellt.
Der Hauptteil dieser Arbeit erl¨autert neue Techniken zur Erstellung einer in-teraktiven 3DVisualisierung f¨ur geografische Daten. Als Erstes wird auf eine komplette Neuimplementierung des bekanntenRASTeRAlgorithmus eingegan-gen. Danach wird eine innovative Technik zur Darstellung von Vektordaten in einer interaktive Gel¨andevisualisierung vorgestellt. Und zuletzt folgt eine neue Art der B¨undelung von Graphen in einer interaktiven 3DAnwendung.
Gel¨andevisualisierungen sind die Basis f¨ur interaktive 3DAnwendungen im geografischen Bereich. Trotzdem ist es immer noch sehr schwierig f¨ur Entschei-dungstr¨agern die richtigen Verfahren zu identifizieren und umzusetzen. Dies hat zum Einen mit der sehr grossen Anzahl an Anforderungen zu tun und zum An-deren mit der Tatsache, dass ein Gel¨andevisualisierungsystem sehr umfangreich in der Entwicklung ist und ungern gr¨ossere ¨Uberarbeitungen gemacht werden seit-ens der Hersteller. In dieser Arbeit wird ein Einblick in die Anforderungen f¨ur in-teraktive Gel¨andevisualisierungsalgorithmen gegeben und existierende L¨osungen genauer anaylisiert. Weiters wird anhand desRASTeRAlgorithmus gezeigt wie ein solcher Algorithmus auf moderne Grafikhardware angepasst werden kann. Zu-dem werden neue Methoden f¨ur die Visualisierung von Gel¨ande gezeigt wie bspw. Kantenhighlights, Umgebungsverdeckung und die Visualisierung von Gef¨alle oder Hangrichtung.
Oft werden in bereits existierende Gel¨andevisualisierungen geografische Vek-tordaten eingebaut. Interaktive Visualisierung von grossen VekVek-tordaten ist eine wichtige Problemstellung f¨ur ein qualitativ hochwertiges Visualisierungsystem. Diese Dissertation enth¨alt einen neuen Ansatz f¨ur die Visualisierung von Vek-tordaten auf einer bestehenden Gel¨andevisualisierung. Die Methode basiert auf der Idee, dass die Linienschattierung in einem zweistufigen Verfahren erfolgt. Zuerst wird das Gel¨ande erfasst und verarbeitet und im zweiten Schritt werden die vorhandenen Bilddaten genutzt um die korrekte Position der Vektordaten zu errechnen. Im Gegensatz zu vorhergehenden Methodiken wird keine traditionelle Geometrieverarbeitung f¨ur die Vektordaten ausgef¨uhrt. Dadurch ist es m¨oglich mehr Bilder pro Sekunde zu erzeugen als bisher verwendete Algorithmen zur Ve-rarbeitung von Vektordaten. Dieser flexible Ansatz erm¨oglicht es ebenfalls, dass Vektordaten interaktiv benutzerspezifisch gestaltet und angepasst werden k¨onnen. Ebenso erm¨oglicht der neue Ansatz eine Integration in bestehende Systeme mit anpassbaren Detaillierungsgrad in der Visualisierung.
Dichte Graphen und Graphnetzwerke sind ebenfalls bekannte Herausforderun-gen f¨ur interaktive VisualisierungsanwendunHerausforderun-gen. In geografischen
Visualisierun-gen werden dichte Graphen oft f¨ur Verkehrsinformationen oder Migrationsstr¨ome verwendet. B¨undelungstechniken sind g¨angige Verfahren um die Information von dichten Graphnetzen hervorzuheben. Es wurde bereits mehrmals erfolgreich gezeigt, dass der Informationsgehalt bei der Verwendung von B¨undelungtechniken mit komplexen planaren Graphen steigt. Vorhergehende Methoden verwenden typischerweise eine Kombination von Anziehungs- oder Abstossungskr¨aften f¨ur die B¨undelung des Graphnetzwerks. In geografischen Informationssystemen ist es oft notwendig, Informationen ¨uber die Umgebung des Graphnetzwerk zu ber¨ucksichtigen. Darum ist sinnvoll die B¨undelung von Graphen anhand eines weiteren Netzwerks, bspw. eines Strassennetzes zu erstellen. In dieser Disserta-tion wird ein Algorithmus vorgestellt der vorhandene geometrische InformaDisserta-tionen aus Vektordaten zur B¨undelung und Visualisierung von Graphdaten verwendet. F¨ur die Darstellung von Str¨omungen aus einem Graphnetzwerk in einer 3D Visu-alisierung werden sogenannte B-Splines verwendet.
Die Dissertation wird durch eine Zusammenfassung der Ergebnisse und einer ¨Ubersicht ¨uber zuk¨unftige Forschungsthemen abgeschlossen.
During my PhD, I had a lot of support from various people. Special thanks goes to my advisor Renato Pajarola, who is always patient and supportive, but also critical when it is necessary. I am very thankful for the opportunity to profit from Renato’s unique knowledge and to conduct a PhD at the University of Zurich.
Furthermore, I want to thank all former and current members of the VMML team for listening to provoking theories, weird new ideas, radical opinions about software engineering and challenging climbing sessions. Special thanks goes to the favorite postdocs, namely Oliver, Markus and Enrique for their ongoing sup-port and help. I also want to mention the team of theAtlas of Switzerlandand there especially, Remo Eichenberger and Ren´e Sieber. They supported me with a second workplace, many challenging objectives, helpful discussions and a unique view on software development in graphics.
For proofreading and correcting parts of this thesis, I want to thank Enrique Paredes, Markus Billeter, David Steiner, Valeria Botka, Edi Risch, Gregory Wyss and Armin Moosbauer. In addition, I am very grateful for code contributions to theGlobeEnginefrom Enrique Paredes, Markus Billeter and students projects, namely Alireza Amiraghdam, Florentin Liebmann, Marco Bonzanigo, Henry Ray-mond, Simon Ruesch, Matthias N¨otzli and Pascal Forny.
At last, I also want to thank the Federal Office of Topography Swisstopo as well as the Landesvermessungsamt Feldkirch, Austria, for providing multiple data sets and helpful cooperations for this project.
Abstract i
Kurzfassung iii
Acknowledgments vii
List of Figures xiii
List of Tables xvii
1 Introduction 1
1.1 Learning based on Visualizations . . . 2
1.2 Visualization Pipelines . . . 3
1.3 Virtual Globe Visualizations . . . 5
1.4 Challenges . . . 7
1.5 Contributions . . . 9
1.6 Dissertation Overview . . . 10
2 The GlobeEngine Visualization System 11 2.1 The GlobeEngine Framework . . . 12
2.1.1 System Architecture . . . 12
2.1.2 Package Overview . . . 13
2.1.3 The GlobeEngine Visualization Pipeline . . . 16 ix
2.1.4 The GlobeEngine Rendering Pipeline . . . 18
3 Terrain Rendering 21 3.1 Introduction . . . 22
3.2 Related Work . . . 23
3.2.1 Terrain Rendering Pipelines . . . 23
3.2.2 Terrain Triangulation . . . 24
3.2.3 Terrain Triangulation Algorithms . . . 30
3.2.4 Textures for Terrain Rendering . . . 30
3.2.5 Terrain Web Services and Virtual Globe System Require-ments . . . 31
3.3 The RASTeR System . . . 34
3.3.1 Continuous Triangulation with RASTeR . . . 34
3.4 Results . . . 40
3.5 Conclusion . . . 42
4 Rendering of Vector Information 53 4.1 Point Features . . . 54
4.1.1 GPU Based Point Information . . . 54
4.1.2 Results . . . 56
4.2 Line Features . . . 60
4.2.1 Related Work . . . 62
4.2.2 Deferred Shading . . . 66
4.3 Deferred Vector Map Rendering . . . 67
4.3.1 Clustered Line Buffer . . . 68
4.3.2 Deferred Line Shading . . . 70
4.3.3 Line Styles and Antialiasing . . . 72
4.3.4 Results . . . 73
4.4 Conclusion . . . 74
5 Path Bundling 81 5.1 Introduction . . . 82
5.2 Related Work . . . 83
5.3 Constrained Graph Bundling . . . 85
5.3.1 Input Graph and Reference Vector Map . . . 85
5.3.2 Bundling over Reference Graph . . . 86
5.4 Interactive Constrained Graph Bundle Visualization . . . 95
5.5 Results . . . 97
5.6 Conclusions and Future Work . . . 100
6 Conclusions 105
6.1 Summary . . . 105 6.2 Future Work . . . 106
Bibliography 111
1.1 Tabula Peutingeriana . . . 1
1.2 Iterative Knowledge Acquisition . . . 3
1.3 General Visualization Pipeline . . . 4
1.4 Virtual Globe System Challenges . . . 6
2.1 The GlobeEngine Logo. . . 11
2.2 GlobeEngine Layer Model . . . 13
2.3 GlobeEngine Student Projects . . . 14
2.4 GlobeEngine Package Overview . . . 15
2.5 Visualization Questions: What? Why? How? . . . 16
2.6 GlobeEngine Visualization Pipeline . . . 17
2.7 Rendering Pipeline Spaces . . . 18
2.8 OpenGL Pipeline . . . 19
3.1 Terrain Rendering of Rhine Valley . . . 21
3.2 Terrain Information Examples . . . 23
3.3 Grid Example . . . 25
3.4 Quadtree Types . . . 26
3.5 Continuous Triangulation . . . 27
3.6 Triangle Soup, Strips and Fans . . . 28
3.7 Triangle Types as Arrays . . . 29
3.8 Triangle Types as Indexed Arrays . . . 29 xiii
3.9 MBlock and KPatch trees . . . 35
3.10 MBlock and KPatch trees . . . 36
3.11 KPatch Bintree Top Nodes . . . 37
3.12 KPatch Bintree Splitting . . . 38
3.13 KPatch Tessellation . . . 39
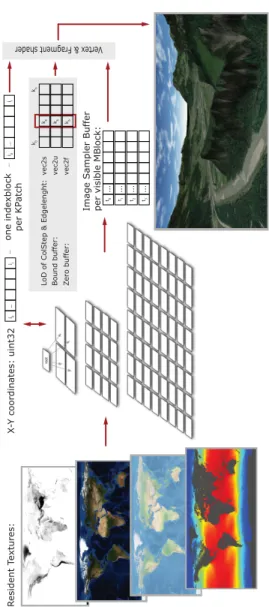
3.14 RASTeR Rendering Overview . . . 43
3.15 Terrain Rendering Result World SRTM1 . . . 44
3.16 RASTeR Result Ambient Occlusion Comparison . . . 45
3.17 Terrain Rendering Result Transfer Function Editor . . . 46
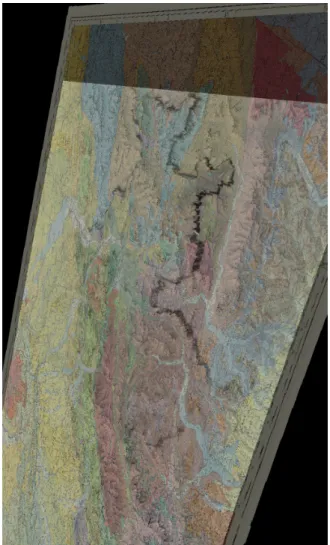
3.18 Terrain Rendering Result swissALTI3D . . . 47
3.19 Terrain Rendering Result Swiss Map Raster 50 . . . 48
3.20 Terrain Rendering Result Texture Blending . . . 49
3.21 Terrain Rendering Result Ambient Occlusion Comparison . . . . 50
3.22 Terrain Rendering Result Edge Hightlighting . . . 51
3.23 Terrain Rendering Result Slope Visualization . . . 52
4.1 Vector Map of Lake Walensee . . . 53
4.2 Point Visualization Pipeline . . . 54
4.3 Chart Rendering Theory . . . 56
4.4 Chart Austrian National Council Voting 2013 . . . 57
4.5 Austrian National Council Voting 2013 Perspective . . . 58
4.6 Chart Result US Presedential Election 2012 . . . 59
4.7 Europe Road Map . . . 61
4.8 Vector Maps Common Artifacts . . . 62
4.9 Vector Maps Geometric Approach Theory . . . 65
4.10 Vector Maps Rendering Pipeline . . . 67
4.11 Vector Maps Clustered Line Buffer . . . 68
4.12 Vector Maps Clustered Line Details . . . 69
4.13 Vector Maps Pixel Projection . . . 70
4.14 Vector Maps Aliasing Artifacts . . . 72
4.15 Vector Maps Lens Example . . . 75
4.16 Vector Maps Results Line Rendering & Procedural Pattern . . . . 76
4.17 Vector Maps Results Isolines & Heatmap . . . 77
4.18 Vector Maps Results Slopes & Street Pattern . . . 78
4.19 Vector Maps Visaul Comparison . . . 79
5.1 Perspective Path Bundling . . . 81
5.2 US Migration Graph . . . 83
5.3 Bundling Algorithm Illustrated Part A . . . 86
5.4 Bundling Algorithm Illustrated Part B . . . 87
5.6 Path Bundling Polyline Reduction . . . 89
5.7 Path Bundling Douglas Peucker Reduction . . . 91
5.8 Path Bundling Spline Refinement . . . 93
5.9 Path Bundling Scan Planes . . . 94
5.10 Path Bundling B-Spline over terrain example . . . 95
5.11 Path Bundling Visual Results Part 1 . . . 98
5.12 Path Bundling Visual Results Part 2 . . . 99
5.13 Path Bundling US Migration Graph . . . 100
5.14 Path Bundling Airline Graph . . . 101
5.15 Path Bundling Swiss Commuter Data Part 1 . . . 103
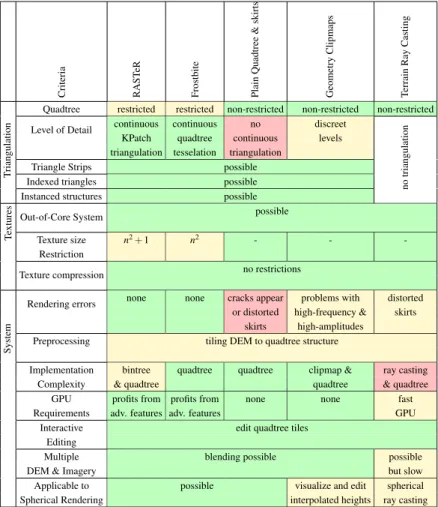
3.1 Terrain Rendering Related Work Overview . . . 33
4.1 Vector Maps Related Work . . . 63
4.2 Vector Maps Result Table . . . 73
5.1 Path Bundling Results . . . 96
1
C
H
A
P
T
E
R
INTRODUCTION
Figure 1.1: Tabula Peutingeriana shows a schematic map of the road network of the roman empire.
Humans like visualizations. The need to abstract information in visual form and sketch things is as old as humanity itself. Visualizing information in form of maps was always an important part in human history. Maps are done because humans have a communication problem when the amount of information to trans-fer is too complex. We could express everything in words, but the result will be error-prone. There is a desire to make communication fail-safe and easier by in-troducing abstract information and visualizations for the transfer of knowledge. Maps are examples for such visualizations, because maps order information spa-tially and often also temporally. In addition, dividing significant information from
nondescript information makes it possible to focus on a specific topic of informa-tion without further visual distracinforma-tion. Maps are often used with this principle. A nice example for this is theTabula Peutingerianashowing the complete street network of the roman empire.
This map had the purpose to guide a traveler trough the complex network of roman streets. It shows major cities and forts but it also contains information about horse stables so that the observer is able to improve route planning and traveling times. The abstraction of the town shapes and the simplified drawing of streets is intentionally understandable to everyone at first sight. On the basis of this example we see that the visualization of geographic information is a very basic form of communication and collaboration between single persons and groups of persons. The demand on this basic form of communication remained the same over centuries and is still the driving force behind all digital and non-digital maps.
1.1 Learning based on Visualizations
When two persons meet, usually they define a time and a certain location as a meeting point. Often, people choose known places to meet. However, finding the right way to these meeting points is often tricky and nowadays it is done with help of digital map tools. Usually, it is possible to set an initial position and destination location. After a quick search, the software shows the user a map with several opportunities how to reach the meeting point. Most people are not aware that a common mathematical problem is associated with this task. The challenge of finding the shortest path in a graph network. What the software system does, is to solve a shortest path algorithm based on the person’s input and returns the shortest path which seems to be the best option for this case. However, the shortest path is not always easy to determine and sometimes it needs more information such as the choice of a transportation vehicle. The system recognizes this input and offers the user different information about every transportation device. Furthermore, the system might offer additional or alternative paths based on the user’s input or it offers the possibility to input additional way points and then further refines the results.
What intuitively happens is that the user iteratively tackles the challenges and learns based on a visualization. In this simple case, the challenge is described as the question how to reach the destination and the map is the appropriate visual-ization for this. As soon as the user understands or evaluates the visualvisual-ization of the first shortest path result, knowledge is created and this immediately leads to a new question, namely whether the proposed shortest path to the destination is the optimal path for the user.
sci-Knowledge
Visualization
Evaluation
Challenge
Figure 1.2: The process of iterative knowledge acquisition. Challenges and problems often require support of visulizations. Evaluating these visualizations gives insights and leads to new knowledge. Thus new problems can be formulated.
entists call visual analytics in geographic information systems (GIS). What hap-pens is illustrated in Fig. 1.2. This iterative learning process is the motivation for providing better visualizations. With a better understanding of the challenge, we are able to come up with more precise and better solutions. With good visual-izations, we gain deeper insight into a problem domain so that on the one hand we can solve problems where the solution was unclear before and on the other hand we can elaborate more challenges and questions which were not recognized beforehand.
The field of visualization as a subfield of computer graphics has the target to improve the process of understanding data by improving the visual representation of this data to enhance the communication quality. An important factor of this visual representation is the amount of interaction a system can provide. When a system reacts immediately on user input the above learning cycle is accelerated and the problem exploration is improved. This also applies to geographic informa-tion systems, where the basic interacinforma-tion possibilities on a map such as zooming or navigating improve the user perception of the data space and help to understand in which context the data exists. The collection of these interaction processes and operations on different data can be summarized in a visualization pipeline.
1.2 Visualization Pipelines
The core of a visualization system is the modeling of the visualization pipeline. In a visualization pipeline, the raw data material is transformed in different steps to achieve a final displayable image. A common model for a multivariate
multi-dimensional visualization pipeline is shown in Fig. 1.3. Typically, raw data sets are gained from an input source or from a database and therefore such data sets contain incomplete or incorrect records. The first step is performing a data anal-ysis process to decide what part of the data should be considered to influence the visualization, such as empty value filling or merging small data sets together. Typ-ically, this step is done only once per data set using scripts and toolboxes which require some technical or domain experience. In the above mentioned shortest path example, this step would be equivalent to the preparation of the map data so that shortest path requests can be executed on a mapping server.
After the data analysis step, the visualization data is ready to be used in a vi-sualization tool, often a customized viewer software. With this tool, a user centric filtering process is applied. In our introductory example, this could be zooming or selecting input data, such as the search for a certain destination or highlighting a certain path object. With help of the user’s input, the visualization system knows which objects are important. The system can apply this knowledge to highlight interesting features of the data in a visually interesting form. This is done in the mapping step. Another example for this is the assignment of a certain color to the highlighted path. Furthermore, the geometric representation (points, lines, poly-gons) is chosen in this step as well. The outcome of this processing step can be described as the conceptual visualization object prepared for the final rendering process. The rendering process creates the final displayable image of the data in-terpreting the input from the former processes. This concludes the visualization pipeline as shown in Fig. 1.3. Designing visualizations and designing visualiza-tion pipelines is currently an active field of research. The book [Munzner, 2014] gives a deeper insight into visualizations and visualization pipelines.
Problem Data
Filtering Focus Data
Visualization / Mapping
Visualization Object Displayable Image
Rendering Visualization Data
Data Analysis
Figure 1.3:The extended dataflow model for a multivariate multidimensional visualiza-tion pipeline as described in [dos Santos and Brodlie, 2004]. It shows the states of data (top row) and the processes on the data (bottom row) within a visualization pipeline.
The core contribution of this thesis is an implementation of such a visualiza-tion pipeline for large-scale geographic data. Before delving further into this topic in Chapter 2, we will discuss specific challenges and problems of visualization pipelines for geographic information systems.
1.3 Virtual Globe Visualizations
Visualization systems for geographic or spatial information have specific prob-lems and challenges which are highly depending on the application requirements. For the purpose of this thesis we look at specific visualization systems called vir-tual globes. Commonly known representatives in terms of applications areGoogle Earth1,NASA Worldwind2and in terms of frameworks are theosgEarth3and the
Cesiumframework4. The survey paper about digital earth systems shows the
cur-rent state-of-the-art in this domain [Mahdavi-Amiri et al., 2015]. The book [Cozzi and Ring, 2011] describes a typical construction of a virtual globe system. Other works related to virtual globe challenges and goals can be found in [Hildebrandt and D¨ollner, 2010] or [Christen, 2008]. Virtual globes can have many different applications for visualizations. In the past, virtual globe software packages were used to visualize:
• General maps: e.g. street maps, borders, other geographic feature data • Imagery: e.g. satellite images, infrared images or other image information • Political information: e.g. voting results, population density
• Climatological information: e.g. temperature information, wind or under-water streams
• Geological information: e.g. rock formations, molasse information • Hydrological information: e.g. water quality, ground water information • Social network information: e.g. interesting trails, photo spots, animated
videos paths
Depending on the specific application there can be many different challenges concerning a virtual globe framework. From a computer graphics point of view, the main challenges for a virtual globe software can be categorized into four cat-egories, namely: Data Handling, Geometric Representation, Rendering and Visu-alization aspects. Fig. 1.4 shows an illustration of challenges which can influence the development of a virtual globe system.
Data handling challenges are problems which are associated with the data source. Raw data can often be a problem for a visualization software, because it is unstructured in terms of formats, sources or ordering. Therefore, typical data handling problems are filtering and preprocessing. In a lot of visualization and virtual globe systems, the usage of large-scale data sets is restricted because
1https://earth.google.ch/ 2https://worldwind.arc.nasa.gov/ 3osgearth.org/
Virtual Globe
Geometric representation Rendering
- Real-time Rendering - Terrain Rendering - Vector Map Rendering - Text Labeling - 2D/3D-Engine Architecture
Usability
- Visualization Concept - Dynamic Interactions - Time Dependant Simulations - Visual Analytics
- Points, Lines, Polygons - Textures - Voxel Based Data - Mesh Triangulation - Level-of -Detail Structures
Data handling
- Out-of-core Data - Accuracy - Large-Scale / Big Data - Preprocessing - Filtering
Figure 1.4:An overview on challenges when developing a virtual globe system.
systems handling large-scale data need more advanced algorithms than usual vi-sualization system. Often, such systems need specific out-of-core techniques to handle large-scale data sets at a certain accuracy.
The geometric capabilities within a visualization system can have significant impact on a virtual globe. Graphics systems often require a dedicated and opti-mized rendering structure to interact with theGPU(Graphics Processing Unit). Commonly known virtual globes or other visualization pipelines work with tri-angle meshes, textures, points, lines, polygons or voxel based data sets. The challenge is usually the choice of the right geometric representation for a cer-tain combination of data type, visualization type and the subsequent algorithmic complexity to transform the data into this geometric representations. Often, an im-portant challenge is the usage of level of detail data structures to handle large data sets for texture-, voxel- or mesh triangulation structures. A detailed description on metric data structures can be found in [Samet, 2005].
Rendering as the creation of a single image is an important task for a visual-ization system. Common challenges in rendering a virtual globe system are the rendering of terrain, vector map information and related text information. For interactive visualization the main challenge is to achieve 16 milliseconds per ren-dered image or 60 frames per second. The human eye can distinguish between 25 30 pictures per second. Depending on digital displays and the type of
dis-play more images per second are necessary. Therefore, 60 frames per second is an agreed objective in the computer graphics community for every interactive ren-dering system. Renren-dering engines can be designed in different ways but usually there is a difference between the development of an interactive system supporting only 2Ddata sets and a system handling a fully interactive perspective 3D. In the following we always assume the latter case.
The usability aspects in a virtual globe software contains several challenges. This can be on one side dynamic interaction with the globe object like navigat-ing with a perspective 3Dcamera or selecting parts of a data set but also visual analytic tools which have to be designed in an understandable but still usable way. Domain specific users often require another access to the interface than other users. Moreover, the usability aspect is dependent on the data sets and the capabilities of the systems. For example, time-dependent 3Dvisualization are usually more complex when it comes to interaction capabilities. In the following section, some of these challenges will be described more in detail to understand the specific challenges of this thesis project and its contributions.
1.4 Challenges
As shown in Fig. 1.4, there are many challenges during the development of a virtual globe system. This thesis project focuses on the following three main challenges:
• Terrain Visualization System: The main goal is to create an interactive terrain visualization system which is comparable to existing virtual globe software packages. The main challenge is the handling of large amounts of height information. To give an example, the SwissALTI3D data set con-tains the height information of Switzerland on a resolution of 1mand has a data size of 60GB. The imagery of Switzerland in a resolution of 50cm has around 700GB. To explore this information in an interactive 3Dviewer, it is necessary to implement a dynamic out-of-core Level-of-Detail system. Several techniques already exist to solve problems such as dynamic height field triangulation, height field and image compression or client-server ar-chitectures. But there are several untended aspects in terrain rendering. Ex-amples are aspects of effective data visualization, such as visualization of terrain properties like slope, aspect or flow direction, the applicability of advanced rendering algorithms like ambient occlusion, large-scale shadow mapping, alpha compositing of multiple image or heightfields or the seam-less transition of different heightfield repositories in one viewer. All these aspects make the construction of a terrain visualization system to a com-plex problem. Chapter 3 describes this more detailed and provides a way
to combine these challenges to an out-of-core terrain visualization system which is flexible enough to manage large-scale data sets and is able to apply different kinds of visualizations.
• Interactive Large-Scale Vector Map Rendering: Geographical features are expressed as vector maps and can contain different types of geomet-ric data, usually points, lines or polygons. The main goal for this work is to provide large-scale vector map rendering within the interactive ter-rain visualization. Usually, vector maps contain a database of information associated to their geometric types. Therefore, geometric points, lines or polygons can be connected with a set of multiple attributes, similar to an entry in a database row. This implies that a vector map can have the same geometry, but it needs a varying visualization technique. Thus, vector maps might need more interaction possibilities for the user in terms of exploration capabilities and customization. A street map for the purpose of driving in a navigation system needs another visualization than the same street map for tourist purposes even if it uses the same data set. Another aspect of render-ing vector maps in perspective 3Denvironments is the correct placing and mapping of the vector data on top of the terrain. Several rendering errors can appear with current techniques. The method presented in Chapter 4 and published in [Th¨ony et al., 2016] is able to render large amounts of vector map data on top of the terrain visualization system presented in Chapter 3 and compares the results against existing state-of-the-art techniques. • Graph Bundling of Large Graph Data Sets for GIS: In general, vector
maps can be described as large graph networks, for example a street net-work. These graph data sets describe a geometric mapping, such as existing infrastructure. But vector maps are not restricted to this property. A spa-tial graph network can also describe political or economical information and connect spatial information to it. The spatial connection to such kind of information can have significant impact to the user’s learning process. How-ever, large graph networks suffer from cluttering artifacts when visualized directly. Graph bundling describes a set of filtering techniques for dense graph networks to improve the visual information given by this graph net-work. The main goal of this work is to find a way to apply graph bundling in perspective 3Denvironments so that bundles are routed according to 3D feature data. Challenges for graph bundling algorithms are: improving the visual quality by reducing cluttering, improving the information quality by making the process of bundling interactive and adjustable for the user, and integrating such graph visualizations into existing perspective 3D environ-ments. Further details about this graph bundling challenges can be found
in [Th¨ony and Pajarola, 2013]. Chapter 5 shows how to achieve the above mentioned goal for bundling large-scale graphs in a 3D perspective environ-ment using geographically referenced information.
The above collection of challenges provides an overview for the following chapters. As illustrated in Fig. 1.4, several other problems might appear when im-plementing an interactive rendering system for large-scale data sets, such as han-dling large amounts of data in an out-of-core system, numerical precision issues or the preservation of interaction possibilities through the visualization pipeline.
1.5 Contributions
This thesis project contributes significantly to the field of geographical scientific visualizations. GIS software can profit from the presented techniques in terms of rendering speed, interaction quality and visual rendering quality. The contribu-tions of this work can be summarized as follows:
• Terrain Rendering: The terrain rendering system in this thesis is based on the former works related to terrain visualization and triangulation algo-rithms [Goswami et al., 2010], [B¨osch et al., 2009], [Pajarola and Gobbetti, 2007] and [Gerstner, 2003]. The main contribution is a complete new in-terpretation of theRASTeRalgorithm combined with a flexible out-of-core visualization system. The terrain rendering system allows different texture levels and different height field levels as well as connections to different out-of-core terrain repositories over a tile map service structure. Additionally, examples for real-timeGPUterrain feature visualization are shown such as the visualization of slope and aspect as well as visual effects such as ambi-ent occlusion. A publication about future trends in terrain visualization can be found in [Th¨ony et al., 2015].
• Deferred Vector maps:An integral part of this thesis is the rendering of large-scale vector maps with and without terrain. Deferred vector maps solve the problem of combining vector map data with terrain rendering data in a visualization with a minimum of rendering artifacts within a perspec-tive 3Denvironment. Additionally, a method is presented to solve accrued rendering artifacts using an alpha blending shader implementation. The re-sults of the technique are evaluated by comparison with standard rendering techniques. The results of this work have been published in [Th¨ony et al., 2016].
• GPU Chart rendering: Chart rendering of political or economical infor-mation is a traditional application of vector maps in geographic informa-tion science. Our point based GPU implementainforma-tion of standard chart vi-sualizations opens the possibility to display a large amount of dynamically adjustable charts within a visualization pipeline. A short article about the results can be found in [Th¨ony and Pajarola, 2014].
• Constrained Path bundling:Graph bundling is a well known visualization technique to visually improve cluttered graph networks. In this thesis, a method to generate vector map constrained path bundles is presented. These bundles are adjusted along a traffic or meta data network to improve the visual information of a cluttered graph in a perspective 3Denvironment. To achieve a terrain independent visualization, path bundles are routed around mountains under the constraint of underlying vector map information. The evaluation is done by comparing it with earlier graph bundling approaches. The outcome of this work is published in [Th¨ony and Pajarola, 2015]. • The GlobeEngine Framework: The thesis contribution and publications
are unified in a visualization framework called theGlobeEngineframework. The framework itself was also used in several student projects about inter-active rendering related to geographical or astronomical visualizations. The main goal of theGlobeEngineframework is to provide a prototyping envi-ronment for visualization projects working with large-scale data sets.
1.6 Dissertation Overview
This dissertation is structured in 6 chapters. Chapter 1 gave a short introduction to geographical visualization. Furthermore challenges and contributions of this thesis were outlined. Chapter 2 gives an overview over the goals and capabilities of theGlobeEnginesystem as well as a description of the concrete visualization pipeline and the system architecture. In addition, it makes the connection to the following more detailed techniques incorporated in theGlobeEngineframework. Chaper 3 introduces the reader to the terrain rendering part of theGlobeEngine and gives a detailed explanation how the terrain rendering system works. Alter-native terrain rendering methods are discussed as well. Chapter 4 presents vector map visualization techniques. Furthermore, it provides a comparison between our deferred vector map visualization technique and traditional vector map render-ing methods. Chapter 5 presents vector map constrained path bundles along with a detailed algorithmic implementation. In addition, an evaluation against other methods and further improvements are presented. Chapter 6 concludes this thesis with a summary statement and gives directions and plans for future work.
2
C
H
A
P
T
E
R
THE GLOBEENGINE
VISUALIZATION SYSTEM
Figure 2.1:The GlobeEngine Logo.
2.1 The GlobeEngine Framework
The development of theGlobeEngineframework started in 2011 with this PhD project. The reason to start the development of this framework was the need for unification of former research in the field of terrain rendering done by the VMML group. Furthermore, future projects and developments of this PhD project for rendering large-scale vector map visualizations should be integrated as well. The main goals of the system can be summarized as follows:
• Providing a redesign of the existing implementation ofRASTeRand develop a new terrain engine using theRASTeRterrain rendering algorithm. • The design and development of a large-scale vector map engine to visualize
vector map data sets with different rendering techniques.
• The implementation of visual analysis techniques, especially graph bundling techniques within theGlobeEngineframework.
• The design of a framework to provide theV MMLresearch group and the students associated with VMML a unified visualization framework for rapid prototyping of large-scale GIS visualizations.
• The implementation of rapid prototypes for papers or external projects such as the 3D Atlas o f Switzerlandto test rendering techniques or algorithms within a controlled and simplifiedOpenGLenvironment and without rely-ing on third party render engines.
2.1.1 System Architecture
TheGlobeEngineframework architecture is shown in Figure 2.2. The framework is designed for cross platform development on Windows, Mac OSX, Linux Debian and Linux Ubuntu. These platforms are the core development platforms for all VMML projects as well as widely used in the scientific visualization community. Integration and interaction between other VMML projects such asEqualizer [Eile-mann et al., 2009] are important future plans and therefore architecture decisions were made to make this possible in the future. Despite the recent trend for high level languages like JavaScript or Ruby, the core focus of this system is interac-tive rendering and especially hardwareGPUprogramming. To get the maximum performance out of a visualization system in combination with cross platform functionality, C++is still the required language. There are a lot of existing tools and third party dependencies available to work together with C++. The most im-portant libraries used in this project areQTfor user interfaces and many low level system interactions such as threading, networking or window handling, as well asOpenGL&OpenCLfor graphics driver interaction and multi purposeGPU computing.
The Globe Engine Layer Model
OpenGL QT
The GlobeEngine Framework Viewer & Example Projects
Other dependecies
Figure 2.2:The GlobeEngine Layer Model.
The framework builds up onCMaketo organize cross platform dependencies and development environments such asVisualStudio,XCode,QTCreatorand other platform specific build tools. The framework itself contains several pack-ages, along with concrete viewer projects which will be discussed in the following sections. Fig. 2.4 gives an overview over theGlobeEnginepackage structure. 2.1.2 Package Overview
The package overview shows the actual state of theGlobeEngineframework. During the development of theGlobeEngineframework several viewer applica-tions were programmed by our undergraduate students using this framework. The long term effect of integrating these student projects into theGlobeEngine frame-work is that these prototypes share a common source base so that student projects do not get lost immediately after the submission of students, because their know-how leaves the group.
This maintenance of student or PhD projects is often ignored, because it seems like a waste of resources. As a consequence, existing source code is often not reused in newer projects by PhDs or master students because the know-how is lost and testing existing code fails because it was not maintained properly. Especially, updating viewer projects for new operating systems or new graphics hardware can take many work hours if the software was not maintained over the years. In GlobeEngine, the maintenance of student projects is done immediately during development, e.g. porting to a new operating system. All viewer projects share a common source base so that the code changes are much smaller and therefore
(a) (b)
(c) (d)
Figure 2.3:Example screenshots from GlobeEngine student projects. (a) Hiking Viewer, (b) Exoplanet Viewer, (c) Atmosphere Viewer, (d) Planetary Viewer.
easier to adapt. In addition, the teaching aspect for students is important. We want the students to get hands on experience with low level graphics code. At the same time, we want them to adapt existing visualization techniques and clean code styles by introducing them to real-world visualization packages.
Our experience in this project shows that student projects and student code can be integrated well into an ongoing research project if the student is able to use the same code base as the ongoing research project. Fig. 2.3 shows some examples of such student viewers. For the following Chapters only the relevant subset of packages will be described:
• Core Modules: This modules contain the core packages of theGlobeEngine. The indiviual packages contain rendering structures, spatial data structures, graph data structures, window handling as well as an simple example viewer for testing purposes and as template for student projects.
• Terrain Modules: The terrain rendering module contains the code for the RASTeRalgorithm as describes in Chapter 3 and the code for spatial mes-saging for interaction with the tile-based storage systems. It also contains a simple example viewer only capable of rendering terrain.
• GIS Modules: The GIS modules contains all source code specifically re-lated to vector maps visualizations (in the coding context this is described as features) within theGlobeEngine. It also contains theGlobeEngineViewer project, which is the main application build for this thesis project.
Figure 2.4: The GlobeEngine Framework. Packages in red are external dependen-cies. Violet packages are internal or external modules integrated into the GlobeEngine build structure. Green packages are GlobeEngine viewer projects. Blue packages are GlobeEngine modules.
2.1.3 The GlobeEngine Visualization Pipeline
TheGlobeEnginevisualization pipeline can be seen as a collection of individual visualizations designed for different purposes but resident in the same software application prototype. Every individual visualization is designed according to the design principles described in the book [Munzner, 2014] and every interactive visualization is based on three questions shown in Fig. 2.5:
Figure 2.5:Illustration of an iterative process for creating visualization. Image courtesy of Tamara Munzner from [Munzner, 2014]
An overview over the interactive visualization pipelines in theGlobeEngine framework is given by Fig. 2.6.
The purple pipelines show visualizations of elevation and digital imagery which is described in Chapter 3. The main purpose of these visualization types is to pro-vide an insight into the 3Dnature of large-scale raster data sets like height maps or satellite images to visualize height differences in a natural way, which is hard to see on 2Dimages. The red lines show visualization pipelines for different kinds of vector maps. The main purpose for these visualizations is to display the con-tent of the vector maps inside a perspective 3Dterrain rendering environment in an illustrative way. But there are some examples where the visualization pipeline changes with the purpose of the visualized item. For example, point data sets can be visualized as locations but, alternatively, the same point data set can be visual-ized as charts of a voting result on these locations. The goal of theGlobeEngine framework is to provide the user with different solutions for the question on how the data should be visualized. Different visualization pipelines are available in theGlobeEnginesupporting old and new visualization and rendering techniques. Another example for these features are border data sets. Border data can either be used as lines to mark borders in the perspective 3Dview or it can be used as polygons to visualize statistical data about the economical growth of a region. The next chapters will go into detail about the new visualization techniques used in the GlobeEngineframework.
Inf ormation Elevation D at a t yp e Re nd er in g S ta ge W ea th er p he no m en a Or thophot os H is to ric al M ap s
Land use Housing Tra Names
ffi c St at is tic al d at a Pix els Lines Poly gons Vo xels Pr epr oc essing Te xt R en de rin g Vo lu m e R en de rin g Cl us te re d Vec to r M ap R en de rin g Ter ra in R en de rin g G PU P oi nt R en de rin g M es h R en de rin g Tr ia ng ul at ed M es h Po in ts
Object Space
World Matrix
World
Space Camera Eye Space Camera Clip Space ScreenSpace
View
Matrix Projection Matrix TransformViewport
Figure 2.7:Illustration of spaces in the traditional rendering pipeline.
2.1.4 The GlobeEngine Rendering Pipeline
Traditional rendering pipelines are built by the pattern illustrated in Fig. 2.7. A geometric object, e.g. a triangle, exists in object space and is transformed in several steps, first into world space, then to camera space and finally to clip space. The last step is the transformation into screen space. Usually, these steps are expressed using matrix multiplications. More details about these transformations can be found in several sources, e.g. in [Akenine-Moller et al., 2002].
Graphics APIs such as OpenGL1, DirectX2or Vulkan3provide programmers
an API to access the graphics hardware and manipulate specifically the implemen-tation of the rendering pipeline. Typically, the programmer can influence parts of the pipeline either over API commands or by shader programs. In recent years the complexity and the amount of APIs was growing. TheGlobeEngineframework uses the capabilities of the OpenGL API from version 4.5 as illustrated in Fig. 2.8. A traditional visualization program implemented in theGlobeEngine frame-work setup defines first vertices and primitives such as lines and triangles and uses vertex buffers to store the geometric information on theGPU. These vertices are then transformed into camera clip coordinates inside the vertex shader program. In the following rasterization step, primitives are converted into sets of fragments. A fragment can be defined as a screen pixel with depth information. Redundant fragments will be discarded and for every fragment a shader program is executed. The output of this fragment shader is then stored in a framebuffer. In a simple pipeline, this framebuffer will be the output of the graphics hardware to the screen but in more advanced graphic engines, it can be used as input for further steps.
State-of-the-art rendering engines use several instances of framebuffer objects to create a final image on the screen. The purpose of framebuffer objects can vary depending on the application purpose. A common example is the overlay of an user interface (UI) over a 3Dscene. This technique is often used in game engines. An example can be found in Fig. 3.17. The idea is to render UI elements in a
1https://www.opengl.org/ 2http://msdn.microsoft.com/directx/ 3https://www.khronos.org/vulkan/
Figure 2.8:Illustration of the OpenGL pipeline version4.5. Image courtesy of NVIDIA.
separate framebuffer and the 3Dscene in a second framebuffer. Then, combine both in a separate composition step. This separation has several advantages. First, the UI is painted only after changes in the UI. This can be a significant difference because user interaction does not require 60 frames per second like the 3Dscene. Second, the UI framebuffer can be used as a mask to avoid unnecessary tasks for pixels which are covered by the UI. Rendering steps for these pixels can be avoided. And third, when working with multithreaded APIs, the user interface can be generated by another rendering thread or another graphics card and be reused by the main rendering thread.
TheGlobeEnginerendering pipeline uses multiple framebuffer objects to im-plement a deferred shading pipeline as described in Sec. 4.2. Usually, deferred shading pipelines are used to reduce the calculation effort for fragment shaders and apply post processing effects to the scene. A typical effect is ambient occlu-sion, which is described in Sec. 3.5. The main idea behind deferred shading is to store all information about a scene within a framebuffer object and therefore as a 2Dimage with depth information. When applying an effect, the calculations do not have to be done once per pixel for every primitive but rather once per pixel of the framebuffer. The downside is the limited availability of scene information, because calculations, such as lighting, have to be performed based on a 2Dimage with depth information. Additional details about the usage of deferred shading pipelines can be found in the articles [Shishkovtsov, 2005] and [Koonce, 2007].
3
C
H
A
P
T
E
R
TERRAIN RENDERING
Figure 3.1:Example rendering of the Rhine Valley.
3.1 Introduction
Terrain rendering is an essential part of a virtual globe software package. The term terrain rendering encompasses all processes and stages in a visualization pipeline related to the visualization of terrain information. This includes not only the rendering of digital elevation information but also the visualization of addi-tional geospatial information.
Digital terrain information can be divided into 2D, 2.5Dor 3Dinformation. Usually, 2Dinformation are pixel maps, flight images or satellite images such as the one in Fig. 3.2(a). Another type of raster based image information is the 2.5Delevation model in Fig. 3.2(b). Such 2.5Delevation models are also called digital elevation models(DEM), digital terrain models (DT M), elevation maps or height fields. This type of information is the common basis for nowadays terrain rendering algorithms.
In aDEMessentially every pixel of the image is interpreted as a correspond-ing height value. In principle, it describes a discrete 2Dfunctionhi,j=f(xi,yj).
By interpreting the values as heights, the terrain receives a 2.5Dcharacter as we can see in the teaser image, Fig. 3.1. However, this 2.5Dinformation is also the main limitation of todays terrain rendering systems, because it is not possible to express all occurring shapes of real terrain. To display all forms of 3Dterrain, e.g. Fig. 3.2(c), it is necessary to acquire the terrain information in 3Das well. The main difference is that a complete 3Drepresentation allows the visualization of caves, overhanging 3Dstructures like bridges or tunnels as well as subsurface structures. Recent research in 3Dlaser scanning open the possibility to acquire 3Dstructures in reasonable time. It will only be a question of time until these sys-tems are used to systematically enrich the 2Dinformation with 3Dpoint clouds. However, the focus of this work is limited to 2.5Ddata sets.
3Dterrain rendering makes large-scale elevation information more accessi-ble for the user by providing a more friendly and realistic impression. For daily tasks, a perspective 3Drendering might not be the optimal tool. For example, map search is better performed in 2D, because abstracted 2Dmaps are easier to understand for humans than complex 3Denvironments. However, terrain render engines allow to map real 3Dspace as proper 3Dinformation. Therefore, it is pos-sible to simulate 3Dworlds for education, entertainment, exploration, and plan-ning purposes where a 2Dmap is not enough. With realistic terrain rendering, we are able to create realistic pilot training facilities and new ways for cultural story telling, such as creating new worlds in games. Terrain rendering is a key technology to communicate such experiences and stories. With upcoming virtual reality hardware, it will be possible to create immersive experiences for entertain-ment, training and research. In addition, terrain rendering is a key technology for planetary exploration, such as the Mars-Rover mission. It is already possible to
(a) Blue Marble Example (b) Gebco Example (c) 3D Example
Figure 3.2:(a) Blue Marble Texture published by the NASA Blue Marble Project1. (b)
Gebco digital terrain map. (c) Example for a3D cave showing also overhangs and3D
structures.
create complete 3Dreal-time simulations from satellites and rovers on extrater-restrial objects, and therefore, explore extraterextrater-restrial planetary surfaces from a home computer.
3.2 Related Work
Terrain rendering is a well known area of research and for many aspects of a ter-rain rendering system there exist good solutions. In this section we discuss related work and the theoretical background for terrain rendering systems. In general, ter-rain rendering research can be divided into the following categories: triangulation algorithms, level of detail structures, client server architectures, compression al-gorithms and applications of terrain analytics. Because this chapter is focused on terrain visualization we will not go into detail about terrain modeling or procedu-ral modeling algorithms. An introduction to the principles of terrain modeling can be found in the book [Li et al., 2005]. A hands on explanation for building a 3D terrain rendering engine is given in the book [Cozzi and Ring, 2011]. The most re-cent survey about state-of-the-art methods can be found in [Mahdavi-Amiri et al., 2015].
3.2.1 Terrain Rendering Pipelines
There are two different ways for top level designs of terrain rendering pipelines. The traditional approach uses aDEMto generate a triangulated mesh and will be discussed in detail in this chapter. The second approach uses aDEMinside a ray casting engine as proposed in [Dick et al., 2009a] and [Dick et al., 2010]. The main difference between them is that ray casting is a highly pixel based method and does not need any detailed mesh structure from aDEM. The papers show that this method is able to perform terrain ray casting in real time. As usual for
ray casting algorithms, the hardware requirements for the GPU in terms of perfor-mance are high. The reason is that ray casting demands a lot of processing power from the fragment shader, especially for large screens. Therefore, it might be a challenge to achieve high frame rates forHDor 4Kscreens, or on systems with limited hardware capacity such as embedded systems. It is highly likely that this limitation is omitted in the future, because of increasing performance on graph-ics hardware and new techniques for rendering. For example, it is possible to compute safety shapes fromDEMinformation to accelerate rendering as shown in [Baboud et al., 2012]. In the following section we will focus on triangulated meshes and we will discuss several methods for generating triangular meshes from grid structures.
3.2.2 Terrain Triangulation
An overview over terrain triangulation and terrain rendering can be found in [Pa-jarola and Gobbetti, 2007]. Triangulated terrains can be divided into triangulated irregular meshes, also called triangular irregular networks (TIN), semi regular grids and regular grids as illustrated in Fig. 3.3. Here, we assume that aDEMis always interpreted as regular grid of data points. Therefore, for this work we will not go further into details about triangulated irregular networks or triangulation of semi regular grids, even if some algorithms or challenges might be applicable to these cases as well.
The triangulation of regular grids and regular height fields is discussed in detail in [Pajarola and Gobbetti, 2007] and other sources. For this reason, this section will focus on explaining major requirements to understand the challenges with regular grid triangulation. These requirements for terrain triangulation algorithms are listed in Tab. 3.1. In the following paragraphs, we will discuss these criteria in more detail.
Restricted vs. Non-Restricted Quadtree
Triangulation algorithms for terrains rely on hierarchical data structures to enable level of detail rendering. Usually, theDEMis processed beforehand to a hierarchi-cal data structure such as a quadtree. A typihierarchi-cal example is illustrated in Fig. 3.4. Details to this data structure can be found in the book of Hanan Samet [Samet, 2005]. A quadtree offers several advantages such as out-of-core data loading, faster spatial queries on the terrain information and in some cases data compres-sion. The triangulation of the terrain mesh has to be adapted to such quadtree data structure. There are two categories of quadtrees, namely non-restricted quadtrees and restricted quadtrees. The difference is that a restricted quadtree assumes for every node that all it’s neighboring nodes have not more than 1 level difference to
(a) TIN (b) Semi Regular Grid (c) Regular Grid
Figure 3.3: (a) A triangulated irregular network. (b) A semi regular grid with arbi-trary movements of equally distributed points. Grids are also called semi regular if the distances between point rows or columns differ. (c) Example for a regular grid with an arbitrary triangulation. In regular grids, data points have the same distance to it’s neigh-bours within all rows and within all columns.
this node. It holds that every nodevin a quadtreeQ= (K,E)has a depthd(k) which is the shortest path distance to the root node within the treeQand has a set of neighboring nodesS={k0
0, ...kn0},S2Q. In a restricted quadtree the following
holds for every nodek2K:
|d(k) d(k0)|<=18k02S (3.1)
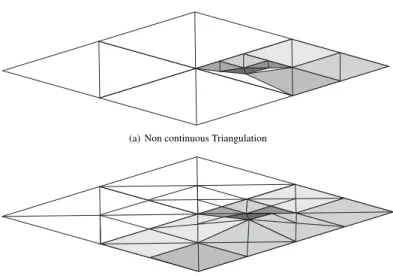
Fig. 3.4(a) shows a non-restricted quadtree whereas a restricted quadtree can be seen in Fig. 3.4(b). In both illustrations we can see errors in the mesh caused by differing height values at T-joints. These errors are called cracks. Cracks can appear in quadtree meshes, whenever an edge has less vertices than a neighboring edge and therefore, a differing height function at these vertices.
Obviously these errors only appear if the height value at a point differs from the height values of the neighboring vertices. Such cracks and T-joints are the main reason why we distinguish between continuous and non continuous triangu-lations.
Continuous and Non-Continuous Triangulations
Example for continuous and non-continuous triangulations are shown in Fig. 3.5. A continuous triangulation simply means that all T-joints and cracks in the mesh structure are eliminated. A continuous triangulation is often required for several reasons. The main reason is the visual disturbance of cracks in the mesh. But also, because more advanced mesh processing algorithms could rely on the requirement of a correctly connected mesh. This might not be important for purpose of visual-ization of height values but it can get important for subsequent algorithms such as fluid simulations, collision detection on the terrain or interactive terrain
deforma-(a) Unrestricted Quadtree
(b) Restricted Quadtree
Figure 3.4:(a) A non-restricted quadtree containing cracks on multiple positions. (b) A restricted quadtree containing a crack at a T-joint.
tion and editing. Algorithms or systems using a non continuous triangulation often use so called skirts for filling the cracks. This technique is discussed in [Thatcher, 2002]. Skirts are extensions to the triangulated mesh, such as ribbons around the quad tree tiles with the purpose to hide the height difference at T-joint locations. However, introducing skirts can lead to texturing artifacts by itself and the whole terrain mesh topology will still be unconnected. Furthermore, skirts produce arti-ficial data within a visualization which should be avoided if possible.
Triangle Soups, Strips and Fans
Earlier triangulation research in computer graphics often had a focus on generat-ing triangle strips and fans from a triangle soups. Graphics cards offer the func-tionality to interpret triangles in different ways. A triangle soup can be defined as a group of individual not connected triangles in space as shown in Fig. 3.6(a). This representation assumes that every triangle is defined with three vertices. But there are two other major ways to describe triangles by reusing vertices of a preceding