Analysis of Multitarget Activities and
Assay Interference Characteristics of
Pharmaceutically Relevant Compounds
Kumulative Dissertation
zur Erlangung des Doktorgrades (Dr. rer. nat.)
der Mathematisch-Naturwissenschaftlichen Fakultät
der Rheinischen Friedrich-Wilhelms-Universität Bonn
vorgelegt von
Swarit Jasial
aus Hoshiarpur, Indien
Bonn
January, 2019
Angefertigt mit Genehmigung
der Mathematisch-Naturwissenschaftlichen Fakultät
der Rheinischen Friedrich-Wilhelms-Universität Bonn
1. Referent: Univ.-Prof. Dr. rer. nat. Jürgen Bajorath
2. Referent: Univ.-Prof. Dr. rer. nat. Thomas Schultz
Tag der Promotion: 26th April, 2019
Abstract
The availability of large amounts of data in public repositories provide a useful source of knowledge in the eld of drug discovery. Given the increasing sizes of compound databases and volumes of activity data, computational data mining can be used to study dierent characteristics and properties of compounds on a large scale. One of the major source of identication of new compounds in early phase of drug discovery is high-throughput screening where millions of compounds are tested against many targets. The screening data provides op-portunities to assess activity proles of compounds.
This thesis aims at systematically mining activity data from publicly avail-able sources in order to study the nature of growth of bioactive compounds, analyze multitarget activities and assay interference characteristics of pharma-ceutically relevant compounds in context of polypharmacology. In the rst study, growth of bioactive compounds against ve major target families is monitored over time and compound-scaold-CSK (cyclic skeleton) hierarchy is applied to investigate structural diversity of active compounds and topolog-ical diversity of their scaolds. The next part of the thesis is based on the analysis of screening data. Initially, extensively assayed compounds are mined from the PubChem database and promiscuity of these compounds is assessed by taking assay frequencies into account. Next, DCM (dark chemical matter) or consistently inactive compounds that have been extensively tested are sys-tematically extracted and their analog relationships with bioactive compounds are determined in order to derive target hypotheses for DCM. Further, PAINS (pan-assay interference compounds) are identied in the extensively tested set of compounds using substructure lters and their assay interference charac-teristics are studied. Finally, the limitations of PAINS lters are addressed using machine learning models that can distinguish between promiscuous and DCM PAINS. Structural context dependence of PAINS activities is studied by assessing predictions through feature weighting and mapping.
Acknowledgments
I would like to express my gratitude to Prof. Dr. Jürgen Bajorath for giving me opportunity to pursue my PhD in his group. I am highly grateful for his invaluable guidance during my doctoral studies. Thank you for your scientic inspiration and continuous support. I would like to thank Prof. Dr. Thomas Schultz for being the co-referent of my thesis.
I would also like to oer my sincere thanks to Dr. Ye Hu and Dr. Martin Vogt for their guidance and useful suggestions in all our collaborative projects. I am highly thankful to all the members of LSI group for providing a nice and interactive working environment. Special thanks to my dear colleagues Dr. Andrew Anighoro, Filip Miljkovi¢, Dr. Tomoyuki Miyao, Dr. Ryo Kunimoto, Dimitar Yonchev, Huabin Hu, and J Jesús Naveja for all the good times we shared. Many thanks to Erik Gilberg and Thomas Blaschke for productive and pleasant collaborations. I would particularly like to pay gratitude to Dr. Shilva Kayastha who always helped me in everything since the rst day I arrived in Bonn. She will always be remembered as an amazing friend.
Being a rm believer in God, I would like to thank Almighty for giving me courage and strength in every sphere of life. I am deeply grateful to all my friends in Bonn for always being there on my side and uplifting my spirits. Spe-cial thanks go to Pranika Singh Rana, Meemansa Sood, Arka Mallick, Gurnoor Singh and Aaqib Parvez. I would also like to express my gratitude to all my friends in India specially Abhinav Anand and Prateek Mahajan for always keep-ing faith and believkeep-ing in me.
I thank Prof. Dr. Andreas Weber and Prof. Dr. Michael Gütschow for agreeing to be members in my doctoral committee. Last but not the least, I want to thank my parents and family who were always there to support and encourage me during my studies.
Contents
1 Introduction 1
1.1 Publicly Available Compound Databases . . . 1
1.1.1 ChEMBL . . . 2 1.1.2 PubChem . . . 2 1.1.3 ZINC . . . 3 1.1.4 DrugBank . . . 3 1.2 Promiscuity . . . 3 1.3 Assay Interference . . . 4
1.4 Dark Chemical Matter . . . 6
1.5 Data Representations . . . 7 1.5.1 Molecular Descriptors . . . 8 1.5.2 Molecular Fingerprints . . . 8 1.5.3 Scaolds . . . 10 1.6 Similarity Assessment . . . 11 1.7 Machine Learning . . . 14
1.7.1 Support Vector Machines . . . 14
1.7.2 Random Forests . . . 17
1.7.3 Neural Networks . . . 20
1.8 Thesis Outline . . . 22
2 Assessing the Growth of Bioactive Compounds and Scaolds over Time: Implications for Lead Discovery and Scaold Hop-ping 25 Introduction . . . 25
Publication . . . 27
Summary . . . 35
3 Determining the Degree of Promiscuity of Extensively Assayed Compounds 37 Introduction . . . 37
Publication . . . 39
4 Dark Chemical Matter in Public Screening Assays and
Deriva-tion of Target Hypotheses 57
Introduction . . . 57 Publication . . . 59 Summary . . . 65 5 How Frequently Are Pan-Assay Interference Compounds
Ac-tive? Large-Scale Analysis of Screening Data Reveals Diverse Activity Proles, Low Global Hit Frequency, and Many
Con-sistently Inactive Compounds 67
Introduction . . . 67 Publication . . . 69 Summary . . . 77 6 Machine Learning Distinguishes with High Accuracy between
Pan-Assay Interference Compounds That Are Promiscuous or
Represent Dark Chemical Matter 79
Introduction . . . 79 Publication . . . 81 Summary . . . 91
Conclusion 93
Chapter 1
Introduction
In pharmaceutical research and drug discovery, increasing numbers of com-pounds and activity data are becoming available with the advent of methods such as high-throughput screening (HTS)1 where increasingly large libraries of
compounds are screened against drug targets in a short period of time. The increase in data volumes has also been accompanied by increasing data com-plexity and heterogeneity indicating that the big data phenomena originating from biology and bioinformatics have also entered medicinal chemistry, though still at a lesser magnitude.25 These large volumes of complex activity data
provide considerable challenges to drug discovery scientists.6 Although it is
dif-cult to analyze rapidly growing numbers of compounds and publicly available activity data, it represents a valuable source of knowledge and provides oppor-tunities to learn in the eld of drug discovery.7 Several eorts have been made
to build publicly available databases in order to store and maintain informa-tion concerning increasing numbers of compound structures and their biological activity records against dierent targets.
1.1 Publicly Available Compound Databases
Four major public compound repositories are discussed in detail in the following:1.1.1 ChEMBL
ChEMBL is an annotated public database containing activity data for small drug-like bioactive compounds.8,9 It is maintained by European
Bioinformat-ics Institute (EBI) of the European Molecular Biology Laboratory (EMBL). It provides information regarding binding, functional, and ADMET (absorp-tion, distribu(absorp-tion, metabolism, excre(absorp-tion, toxicity) properties of large number of compounds.8,9 The core activity data is manually extracted from the
pub-lished medicinal chemistry literature on a regular basis and then curated and standardized to enhance the quality and utility across dierent drug discovery problems.8 ChEMBL version 24 contains nearly 1.8 million compounds from
medicinal chemistry sources that are active against 12,091 targets, forming a total of more than 15 million ligand-target interactions. ChEMBL also incor-porates activity data from PubChem database.
1.1.2 PubChem
PubChem is a public repository for chemical structures and their activities against biological assays.10 It is administered by the US National Institutes
of Health (NIH). The information in PubChem is organized into three related databases: Substance, Compound and BioAssay. The Substance database con-tains contributed sample descriptions provided by depositors whereas the Com-pound database contains unique chemical structures derived from the substance depositions.11 The PubChem BioAssay database contains compound screening
data.12 The screening data is structured into three types of records: Summary,
Primary and Conrmatory. A Summary record gives the overview of an ex-periment. A Primary record contains results from the initial screen in which the activity assessment is based on percentage inhibition from a single dose. A Conrmatory record reports the eective concentrations of compounds passing the primary screen based on multi-concentration dose-response behavior.11The
PubChem BioAssay database comprises more than 1 million assays with nearly 3.4 million tested compounds, yielding a total of more than 237 million activity annotations covering more than 11,000 biological targets.
1.1.3 ZINC
ZINC is a publicly accessible database that collects compounds relevant for medicinal chemistry from vendor sources as well as other databases.13 It is
maintained by the Department of Pharmaceutical Chemistry at the University of California, San Francisco (UCSF). The current release of ZINC (ZINC 15) reports approximately 230 million commercially available compounds.14 ZINC
compounds are widely used for virtual screening applications.13,14
1.1.4 DrugBank
DrugBank is a freely accessible web resource containing information about drugs and drug candidates.15It contains detailed drug records such as chemical,
phar-maceutical and pharmacological data associated with comprehensive drug tar-get information such as sequences, structures and pathways. The latest release of DrugBank contains 11,885 drug entries; including 2528 FDA approved small molecule drugs and 5132 unique protein sequences.16
1.2 Promiscuity
Large volumes of compounds and activity data present in the databases can be used to analyze structure-activity relationships on a large scale which can help in chemical optimization. It is also possible to study the binding character-istics of dierent targets17 and systematically explore multitarget activities of
small molecules on the basis of available data.7 These multitarget activities
pro-vide the foundations of polypharmacology. Polypharmacology is an emerging concept in drug discovery according to which many pharmaceutically relevant compounds elicit their therapeutic eects by acting on multiple biological tar-gets.1822 The molecular basis of polypharmacology is provided by compound
promiscuity, which is dened as the ability of compounds to specically in-teract with multiple targets.2325 Promiscuity can be estimated
computation-ally by mining rapidly increasing amounts of compound activity data and sys-tematically assembling target annotations for compounds.21,24,25However, data
integrity and condence levels have to be carefully taken into consideration 3
in order to arrive at reliable promiscuity estimates.26 In recent years, several
studies involving rigorous data-driven analysis have provided dierent promis-cuity measures of bioactive compounds and drugs. It has been shown by data analysis that approved drugs directed against dierent target families bind to an average of two to seven targets.21 Furthermore, analysis of high-condence
data from ChEMBL for bioactive compounds indicated that they interact with an average of one to two targets and the most promiscuous compounds with on average two to ve targets belonging to same target family.25,27 Drug and
compound promiscuity were also monitored over time for a period of 14 years (2000 to 2014). Average degree of promiscuity of drugs extracted from Drug-Bank increased from 1.5 in 2000 to 3.2 in 2014 whereas it remained constant at 1.5 targets for bioactive compounds extracted from high-condence data in ChEMBL, despite the massive growth of compound activity data during that time.28,29Thus, computational data mining studies lead to the conclusions that
active compounds and drugs have overall low degrees of promiscuity and drugs on average have a higher degree of promiscuity compared to bioactive com-pounds. Promiscuity estimates obtained from computational studies are often questioned because of data sparseness30 as all active compounds are not tested
against all the targets. However, given the large size of data samples and con-sistency in results, these observations might not be largely determined by data incompleteness and should be statistically meaningful.
1.3 Assay Interference
High-throughput screening is a key technology used by pharmaceutical industry to nd potential drug candidates.1 However, HTS data is always prone to false
positives or false hits due to undesirable mechanisms of action.3133
Promiscu-ity should be clearly distinguished from these non-specic interactions or assay artifacts.34 Not all the interactions between compounds and multiple targets
make positive contributions to polypharmacology. It is important to identify compound classes that are frequently responsible for false positive assay read-outs or bad promiscuity. These interaction artifacts are generally caused by compounds prone to colloidal aggregation3537 or interference compounds that
are highly reactive under assay conditions.38,39 Compounds responsible for
Figure 1.1: Exemplary PAINS. Compounds belonging to three dierent PAINS classes are shown. PAINS substructures are highlighted in red.
say interference have been found to originate from both synthetic and natural sources.40,41Various mechanisms of compound-based assay interference include
autouorescence and quenching,42 covalent modication of proteins and assay
reagents,43 redox reactivity44 or metal chelation.45
Assay artifacts are often dicult to detect and are recognized in the later stages of drug discovery programs thereby leading to substantial loss of time and resources. False-positive activities as a result of assay interference spread throughout the scientic literature and cause problems in further investiga-tions.46 Therefore, it is important to lter compounds with liable mechanism
of action before proceeding to biological or chemical optimization. System-atic eorts have been made to identify, select and lter compounds that can cause assay artifacts. In a landmark study, Baell and Holloway carried out an analysis of compounds that demonstrated activity in multiple AlphaScreen assays and put forward 480 chemical classes as candidates for assays interfer-ence.38 Compounds containing these reactive chemical entities were referred to
as pan-assay interference compounds.38,39,47 PAINS-dening moieties typically
represent a compound's substructure and include various classes such as ani-lines, rhodanines, curcuminoids, Michael acceptors or Mannich bases. Figure 1.1 shows exemplary compounds from three dierent PAINS classes namely quinones, catechols and rhodanines.
PAINS classes do not cover the entire spectrum of assay interference mecha-nisms, still they provide a basis for exploring compounds with potential
terference characteristics. The extrapolative power of PAINS lters has been called into question as they were derived from limited experimental data.48,49
Furthermore, evidence of PAINS has been seen in the marketed drugs50,51
in-dicating that overestimating the magnitude of assay interference can lead to exclusion of useful compounds with desired activities. Therefore, one has to be careful while ltering any potentially reactive compound as predicting assay interference requires thorough chemical knowledge and experience. Data-driven studies related to promiscuity and PAINS can help to better understand the interference potential of liable compounds.
1.4 Dark Chemical Matter
In HTS campaigns, considerable eorts have been made to design screening libraries focusing on chemical diversity and good quality of hits.5254 Millions
of compounds are subjected to screening and evaluated on the basis of activity proles against diverse targets. However, it has been seen that large numbers of compounds in screening decks do not show any signicant biological activity even after being tested in hundreds of biochemical or cellular assays.55 These
consistently inactive compounds either have specic properties that make them biologically inert or they have not been exposed to the appropriate target. In this context, a broad analysis of the bioactivities of small molecules in the Novartis and NIH Molecular Libraries screening collections56 was carried out
and a large fraction of compounds were found to be consistently inactive. The compounds which were lacking a biological prole despite having been screened in hundreds of high-throughput assays were termed as dark chemical matter.57
DCM compounds were notably smaller, more soluble and less hydrophobic than other compounds in the screening library. Furthermore, when DCM compounds were tested in additional high-throughput screens, they were found to be active. Follow-up dose-response experiments conrmed that DCM compounds were potent hits.57 This illustrates that although DCM compounds are less active
than other screening compounds under normal HTS conditions, they are far from being biologically inert. In fact, DCM compounds might prove to be a potentially valuable resource for nding hits that are less likely to be false positives caused by assay interference. Thus, DCM yields less promiscuous
hits that might have unique selectivity towards a particular target and might become small molecule probes or lead candidates.
Some of the major concepts in chemoinformatics that have been used in this thesis for the analysis of data growth, promiscuity, assay interference and DCM compounds are discussed in next sections.
1.5 Data Representations
Molecules can be easily represented as graphs which are two-dimensional (2D) representations of chemical structures where nodes correspond to atoms and edges to bonds. 2D molecular graphs provide information about the connectiv-ity between atoms and the topology of the molecules. They are simplied ver-sions of molecular structures and are easily interpretable by medicinal chemists. They can be converted into machine interpretable form using connection tables consisting of atom coordinates, bond orders and hybridization states. How-ever, storing large data sets of complex structures as molecular graphs is not computationally ecient. Therefore, chemical languages such as the simpli-ed molecular-input line entry system (SMILES) were introducsimpli-ed to facilitate storage, retrieval, and modeling of chemical structures and chemical informa-tion.5860 SMILES transform molecular graphs into strings of ASCII characters
based on predened rules for representing molecular structures. SMILES strings are compact compared to other methods of representing molecular structures and reduces the size of large databases considerably. Atoms are represented by their atomic symbols and branching is denoted by parentheses in SMILES notation. There are special symbols to denote chirality, isotopes, aromaticity and stereochemistry of a molecule. SMILES arbitrary target specication or in short SMARTS is an extension of SMILES which introduces atom and bond labels containing logical operators.61 It is generally used for searching patterns
or substructure queries in databases. PAINS which are usually present as sub-structures in a molecule are represented in the form of SMARTS patterns. 2D molecular representations cannot account for spatial arrangement of atoms or conformations in a small molecule. For this purpose, three-dimensional (3D) representations such as pharmacophore models and molecular surfaces are used.
1.5.1 Molecular Descriptors
For many chemoinformatics applications, compounds are represented using molecular descriptors, which numerically describe molecular structure and prop-erties. Dierent types of molecular descriptors are available to account for physicochemical, topological, surface and other properties of small molecules.6264
Molecular descriptors can be classied as 1D, 2D or 3D based on the molecu-lar representation from where they are derived.65 1D descriptors are calculated
from the molecular formula and are very simple such as atom counts and molec-ular weights. 2D descriptors are calculated from molecmolec-ular graphs, for example, models for estimating the water solubility of a compound are based on 2D rep-resentations. 3D descriptors are determined from molecular conformations.
1.5.2 Molecular Fingerprints
One of the most popular types of molecular descriptors are molecular nger-prints which are generally dened as bit string representations of molecular structure or properties. Each bit position usually accounts for the presence or absence of a given feature in a binary ngerprint although dierent types of ngerprints vary substantially in their design and length. If the feature is present in a molecule, the bit is set to '1' and if the feature is not present, it is set to '0'. There are also nonbinary versions of ngerprints where in addi-tion to presence or absence of a feature, frequency of occurrence of a feature in a molecule is also monitored.66,67 Such ngerprints are referred to as count
ngerprints. A variety of molecular ngerprints have been developed over the years that dier in composition, complexity and length.68 Substructure-based
ngerprints are one of the most common and widely used 2D ngerprints that represent dictionaries of predened structural fragments. The length of these type of ngerprints is xed. A classical example of substructure-based nger-prints is Molecular ACCess System (MACCS) structural keys,69 the publicly
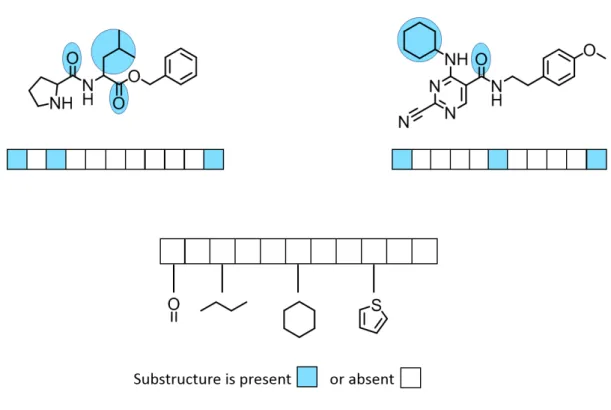
available version of which consists of 166 bits, each of which accounts for the presence or absence of a structural pattern. Figure 1.2 depicts an example of substructure-based ngerprint of xed length 11.
Fingerprints representing molecular topology are another major class of struc-8
Figure 1.2: Substructure-based ngerprint. A substructural-type ngerprint represent-ing 11 features is shown for two dierent compounds. If a feature is present in a compound, the corresponding bit is set on as indicated by sky blue color, otherwise it is set o. Sub-structural features that account for a particular bit to be set on are also highlighted in the compound structures. The gure has been adapted from reference [68].
tural 2D ngerprints. One prominent example of topological ngerprints is the extended connectivity ngerprint (ECFP).70It generates dierent layers of
cir-cular atom environments at a specied distance (depending on the specied bond diameter) centered around a non-hydrogen atom. Figure 1.3 gives an il-lustration of how atom environments are calculated for topological ngerprints. In case of ECFP4, the maximum bond distance between atoms considered in the neighborhood of the central atom is four. Each unique environment is mapped to an integer using a hashing function and the collection of integers forms the ngerprint. ECFP4 can theoretically represent about 4 billion features. How-ever, the features dier from molecule to molecule; hence they are variable in length. Both MACCS and ECFP4 ngerprints are frequently used to represent compounds in many machine learning applications.
Figure 1.3: Topological ngerprint. Calculation of two atom environment layers with a carbon atom (red) at the center are shown. The rst layer is colored in blue and the second layer in green. The resulting circular environments are hashed. The gure has been adapted from reference [68].
1.5.3 Scaolds
Another important concept that is widely used in medicinal chemistry to de-scribe core structures of bioactive compounds is the molecular scaold. This concept is important for hierarchically classifying compounds present in large compound databases or screening libraries.71In general terms, a scaold refers
to a molecular core to which functional groups are attached. The scaold con-cept has several denitions in chemoinformatics and is applied in a subjec-tive manner.72,73 The most extensively applied scaold denition is the
Bemis-Murcko scaold (BM scaold) according to which scaolds are obtained from compounds by the removal of all non-ring R-groups while retaining all ring structures and linker fragments connecting the ring structures.74 One can
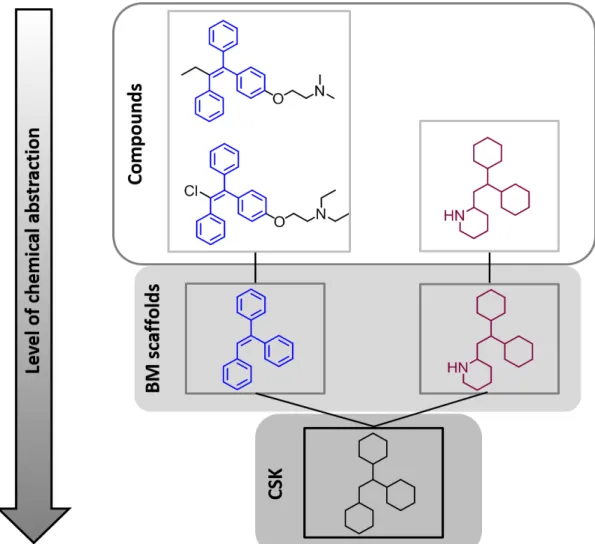
fur-ther abstract from chemical structures by generating cyclic skeletons from BM scaolds by converting all heteroatoms to carbon and setting all bond orders to one. According to the molecular hierarchy, a BM scaold can represent many compounds and a CSK can represent a set of topologically equivalent BM scaf-folds.75,76 A compound-scaold-CSK hierarchy is depicted in Figure 1.4 with
the help of two examples.
Dierent applications of the scaold concept in medicinal chemistry include the search for privileged substructures or core structures that preferentially inter-act with a specic target family.77 Furthermore, identication of structurally
distinct compounds having similar activity, a task known as scaold hopping is another major application of scaold concept. Scaold hopping refers to the ability of computational methods to recognize active compounds with dierent core structures.78 Ligand-based virtual screening approaches start from known
active compounds for a given target as reference molecules or search templates and try to identify novel compounds active against the same target. It is one of the major aims of virtual screening calculations to detect scaold hops.79
1.6 Similarity Assessment
The assessment of structural similarity of compounds is regarded as a key con-cept in chemoinformatics and drug discovery. Similarity assessment is gener-ally required in order to relate structure and biological activity of compounds to each other. Also, several learning algorithms use similarity measures to quantify the similarity between two compounds. Computational similarity assessment mainly depends on the molecular representation and similarity metric used.80,81
The similarity between two compounds is typically calculated by a ngerprint comparison or in other words as overlap between ngerprint strings. For this purpose, many dierent similarity coecients have been introduced such as Tanimoto coecient (Tc), Dice coecient (Dc), Tversky coecient (Tv) and Cosine coecient.81,82 The most popular measure of ngerprint similarity in
chemoinformatics is the Tanimoto or Jaccard coecient.82,83 For two binary
molecular ngerprints A and B, the Tc is dened as Tc(A,B) = c
a+b−c
whereaandbare the number of bits set on in ngerprints A and B, respectively
and ccorresponds to the number of bits set on in both the ngerprints. Tc
val-ues range from 0 to 1 with 0 corresponding to no ngerprint overlap and 1 to 11
Figure 1.4: Compound-scaold-CSK hierarchy. For three exemplary compounds, cor-responding scaolds and CSKs are shown. Two compounds on the left have the same scaold highlighted in blue and the scaold of the third compound is highlighted in maroon. These structurally distinct scaolds are represented by the same CSK and therefore are topologically equivalent. The gure has been adapted from reference [76].
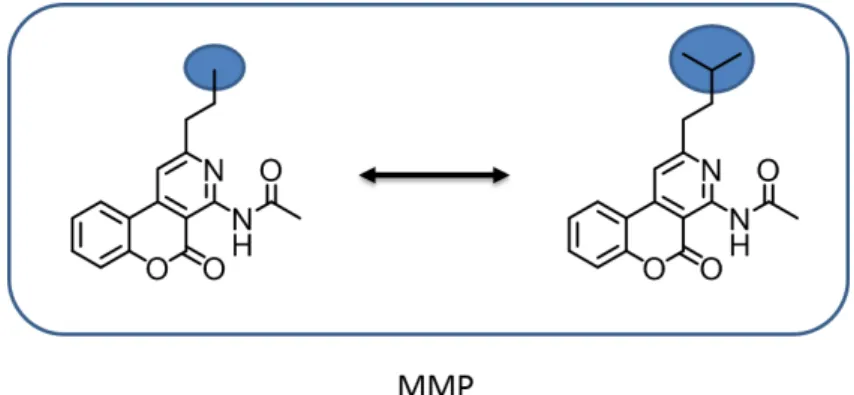
Figure 1.5: Matched molecular pair. Two compounds forming an MMP relationship are shown. The exchanged substructures representing a chemical transformation are highlighted in blue. The remaining part of the compounds represent the common core.
identical ngerprints but not necessarily identical molecules. Tc is an example of a symmetrical similarity coecient, which means the value of comparing A to B is the same as for comparing B to A. The similarity value distributions of Tc values for MACCS and ECFP4 ngerprints are generally centered on a mean value of 0.4 to 0.6 and 0.25, respectively.84
Another popular similarity concept for chemical structures in medicinal chem-istry is the matched molecular pair (MMP), which is dened as pair of com-pounds that only dier by a structural change at a single site.85,86 This single
modication to convert one compound to another is termed chemical transfor-mation. Figure 1.5 shows an example of two compounds forming an MMP.
MMPs are mostly generated by fragmentation or maximum common substructure-based algorithms. MMPs are chemically intuitive compared to numerical sim-ilarity measures as chemical transformations such as R-group replacements or core structure modications can directly be associated with activity or other properties of a molecule. MMPs can further be extended to generate matched molecular series (MMSs) which are series of structurally analogous compounds that are only distinguished by chemical modications at a single site.87 MMPs
are usually size-restricted and only small structural changes are allowed in chem-ical transformations. MMPs can also be generated on the basis of retrosynthetic fragmentation by applying reaction rules following the retrosynthetic combina-torial analysis procedure (RECAP).88 These MMPs which are based on
cal reactions are termed as RECAP-MMPs.89Furthermore, global network
rep-resentations can be generated in which nodes represent compounds and edges represent pairwise RECAP-MMP relationships. Each separate cluster in this network represents a unique analog series (AS).90
1.7 Machine Learning
Machine learning methods are used to develop computational models that have the ability to learn from patterns in the data and make predictions. They have become increasingly popular in the eld of drug discovery over the past years for classication of compounds and property predictions. Machine learning methods are extensively used in ligand-based virtual screening in order to rank database compounds.79 Some of the most prominent machine learning
meth-ods are naïve Bayesian classication (NB),91 random forests (RF),92 neural
networks (NN)93 and support vector machines (SVM).94
1.7.1 Support Vector Machines
Support vector machines are among the most widely used machine learning algorithms in chemoinformatics95 mainly for compound activity predictions.
SVM is a supervised learning method originally used for binary object classi-cation96but has also been adapted for multitarget predictions97and compound
ranking.98SVMs have gained popularity due to their ability to reach higher
per-formance levels than other prediction methods in many applications.
During learning, SVM uses a set of n training instances {xi, yi} (i= 1, ...., n)
where xi ∈ Rd is the feature vector and yi ∈ {−1,1} is the class label
(pos-itive or negative) of a training compound i. Positive and negative training
objects are projected into a feature space. A hyperplaneH is derived that best
separates positive and negative objects:
H ={x|hw,xi+b = 0}
y x hw, xi+ b= 0 hw, xi+ b= 1 hw, xi+ b= −1 2 ||w || b ||w || w
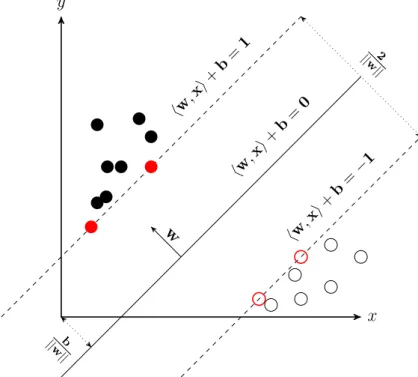
Figure 1.6: Support vector machine algorithm. A maximum margin hyperplane for classifying linearly separable data is derived. Positive and negative data are represented by lled and empty circles, respectively. The optimal hyperplane is shown by the solid black line. Data points determining the hyperplane or the support vectors are depicted by red circles. where w is the normal vector, b is the bias, and h·,·iis a scalar product.
As there can be many hyperplanes that can correctly classify linearly sepa-rable data, the SVM algorithm chooses an optimal hyperplane that maximizes the distance between the nearest training objects and the hyperplane. This distance is called as margin. Figure 1.6 shows a representation of an SVM for linearly separable data. In this gure, positive data is represented by lled circles towards the y axis and negative data is represented by empty circles
to-wards the xaxis. b/||w|| is the oset of the hyperplanehw,xi+b= 0 from the origin. The two dotted hyperplanes hw,xi+b = 1 and hw,xi+b=−1 repre-sent the two borders of the margin with 2/||w|| as the distance between them.
In order to maximize this margin, ||w|| should be minimized. Positive and
negative data on the borders of the margin (depicted by red circles) are called support vectors. Support vectors determine the position of the hyperplane.
For data that is not linearly separable, the parameters w andbof the hyperplane
are derived by solving the following optimization problem: minimize: 1 2||w|| 2+C n X i=1 ξi
subject to:yi(hxi,wi+b)≥1−ξi with ξi ≥0 and i∈ {1, ...., n}
whereξi represent the slack variables99that are added to permit errors for
train-ing instances falltrain-ing within the margin or on the incorrect side of the hyperplane and Cis the cost or regularization hyperparameter introduced to balance
train-ing errors and margin size.
Instead of directly solving the primal optimization problem, it is also possi-ble to formulate an equivalent dual propossi-blem using Lagrangian multipliers:100
maximize: n X i=1 λi− 1 2 n X i=1 n X j=1 λiλjyiyjhxi,xji subject to: n X i=1 λiyi = 0 with 0≤λi ≤C and i∈ {1, ...., n}
where λi are the Lagrangian multipliers. Dual expression makes it possible to
compute the normal vector of the hyperplane as:
w=
n X
i=1 λiyixi
Lagrangian multipliers can be non-zero only for training examples that fall onto the margin of the hyperplane or are misclassied. This subset of training ex-amples with non-zero coecients falling onto the margin represents support vectors. Hence, the majority of training examples other than support vectors can be discarded following the training phase, which makes SVM modeling suit-able for large data sets.
Test data is then projected into the feature space and classied depending
on the side of the plane onto which they fall, as determined by the following decision function:101 f(x) =sgn X i λiyihxi,xi+b !
Test points withf(x) = 1are classied as positive andf(x) =−1are classied as negative. Furthermore, the decision function can be transformed to a ranking function by removing the signum function from the above equation and thus, generating real values for test examples:
g(x) = X
i
λiyihxi,xi+b
The dual formulation also enables the use of the kernel trick,102 which is of
critical relevance for SVM modeling. If linear separation of training classes in a given feature space is not possible, the scalar producth·,·iis replaced by a kernel
function K(·,·) , which corresponds to evaluating the scalar product in higher dimensional space (without an explicit feature representation in that space). A variety of kernel functions have been developed, including the Gaussian or radial basis function kernel, the Tanimoto kernel, and more complex graph kernels.103,104 The Tanimoto kernel, dened in accordance with the Tanimoto
coecient, is one of the most popular kernel function in chemoinformatics. It is dened as follows for two compound ngerprints u and v:
K(u,v) = hu,vi
hu,ui+hv,vi − hu,vi
SVMs utilizing kernels usually have much higher prediction capacity compared to linear models. However, the use of kernel functions comes at the price of lack-ing model interpretability due to black box character of the resultlack-ing models.
1.7.2 Random Forests
Random Forest is a machine learning classication method based on an en-semble of decision trees.92 Each tree is built from a bootstrapped sample of
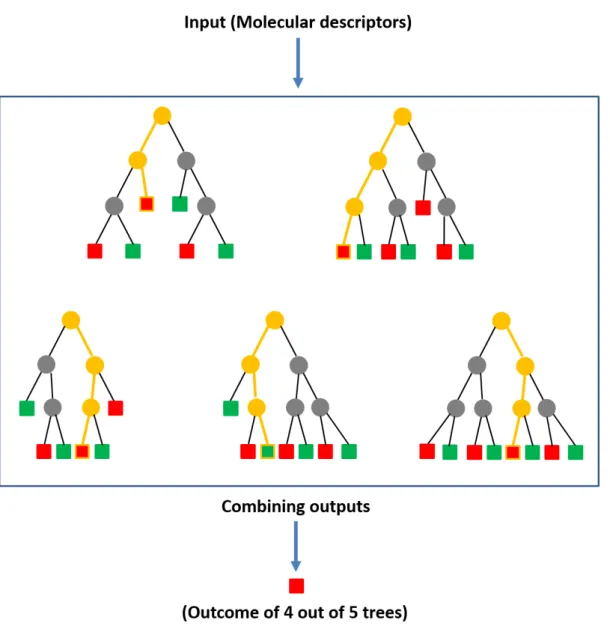
training data using a recursive partitioning method. A random subset of fea-tures is considered during node splitting for the construction of trees, which avoids the presence of correlated trees because of feature dominance. The nal outcome depends on the prediction by the majority of trees i.e., a consensus prediction. Figure 1.7 shows an example of a small random forest of ve decision trees. RF has proven to be a very successful method in chemoinfor-matics105 in dierent contexts such as QSAR (Quantitative Structure-Activity
Relationship) modeling106 and predicting protein-ligand binding anity.107
Suppose we aim to build an ensemble ofB trees{T1(X), ..., TB(X)}, where
X ={x1, ..., xp}is ap-dimensional vector of molecular descriptors. For training,
let there be a set of n molecules, D={(X1, Y1), ...,(Xn, Yn)}, whereXi, i=
1, ..., n, is a vector of descriptors and Yi is the corresponding class label i.e.,
active or inactive or any property of interest. The training algorithm proceeds as follows:
1. From the training data, a bootstrap sample is drawn i.e., a random sample with replacement from n molecules.
2. For each bootstrap sample, a tree is grown where the best split is chosen from a randomly selected subset of descriptors at each node. The tree is grown to the maximum size and not pruned back.
3. The above steps are repeated until the required number of trees (B) are
grown.
The training forest is then used to predict test data. The ensemble produces
B outputs nYˆ1 =T1(X), ...,YˆB=TB(X) o
where Yˆb, b = 1, ..., B, is the pre-diction for a molecule by the bth tree. Outputs of all the individual trees are
combined to produce one nal prediction. For classication tasks, Yˆ is the class label predicted by the majority of the trees whereas for regression, it is the average of individual tree predictions.92,106
RF calculations have relatively low computational costs and a large number of trees can easily be generated. RF is computationally ecient even for very large numbers of descriptors.
Figure 1.7: Random forest. Five exemplary decision trees are shown, which form a random forest for classication. The leaf nodes can either be red or green depending upon the class. The path taken by each test instance is highlighted in yellow. Four out of ve decision trees predict that the test instance belongs to the red class, whereas one decision tree predicts that it belongs to the green class. Therefore, the nal prediction is red by the random forest as it has the majority vote amongst the built trees. The gure has been adapted from reference [105].
Figure 1.8: Deep Neural Network. A fully connected feed-forward deep neural network is shown with three hidden layers. Figure has been adapted from reference [108].
1.7.3 Neural Networks
An articial neural network (ANN) is an interconnected group of nodes, similar to the vast network of neurons in brain. ANN consists of three basic layers: input, hidden and output layer. Input variables are taken by input nodes and the variables are transformed through hidden nodes, and in the end output values are calculated at output nodes. The output values of a hidden unit are calculated from input values via an activation function which is generally a nonlinear function to transform linear combination of input signal from input nodes to an output value. The output value Yi of the node i is calculated as
shown below: Yi =g X j Wij ∗aj !
where aj are input variables, Wij is the weight of input node j on node i and
g is activation function. The training of ANN is done by modifying the weight
values iteratively in the network.
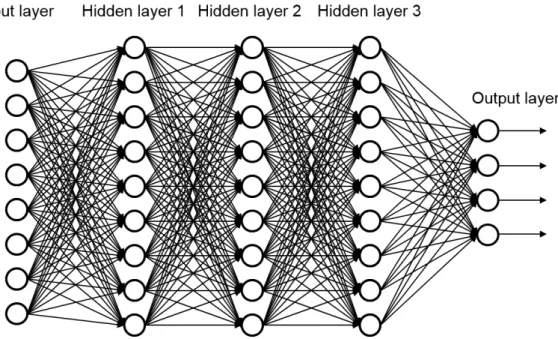
Deep Neural Networks (DNNs)108 contain larger number of hidden layers
compared to traditional ANNs, which accounted for one or two hidden layers 20
due to limitation of computational power. Availability of more powerful CPUs and GPU hardware has allowed NN to use many more nodes in each layer. Figure 1.8 shows an example of a fully connected DNN with three hidden layers. A fully connected deep feed-forward NN comprises of hundreds of non-linear process units in multiple hidden layers. DNNs can take large number of input features and the nodes can automatically extract features at dierent hierarchical levels.109
In summary, a variety of machine learning concepts are applied in chemoin-formatics and computational medicinal chemistry.
1.8 Thesis Outline
This thesis comprises ve studies organized into individual chapters. The main focus of the studies has been to analyze the growth of bioactive compounds over time as well as to assess the activity proles of compounds present in screening data. Promiscuity and assay interference of screening compounds are explored in detail. Methods are presented to deduce target hypotheses for inactive compounds and to rene and extend PAINS lters.
• Chapter 2 presents a study focusing on the target-dependent growth of
bioactive compounds and scaolds over time. Structural diversity of com-pounds and topological diversity of scaolds were explored on a time scale by applying compound-scaold-CSK hierarchy. Implications for small molecule drug discovery were discussed.
• In Chapter 3, the promiscuity of screening compounds was analyzed with
respect to assay frequency. Most extensively assayed compounds tested against hundreds of assays were extracted from PubChem and their promis-cuity was systematically determined.
• In Chapter 4, consistently inactive or DCM compounds were
systemati-cally identied from screening data and other bioactive compounds were searched for analogs. Analog series were generated consisting of DCM and bioactive compounds and target hypotheses for DCM compounds were derived.
• Chapter 5 presents a large-scale analysis of PAINS in biological screening
assays. Activity proles and hit rates of extensively assayed screening compounds detected by PAINS lters were studied in detail.
• In Chapter 6, machine learning models were introduced in order to
distin-guish between PAINS with high and low frequency of activity. SVM, RF and DNN models were trained using promiscuous and DCM PAINS data sets and ways to investigate structural context of PAINS were discussed. Chapter 7 summarizes the major ndings of all the studies in this thesis and contains concluding remarks.
Chapter 2
Assessing the Growth of Bioactive
Compounds and Scaolds over
Time: Implications for Lead
Discovery and Scaold Hopping
Introduction
In medicinal chemistry, the growth of bioactive compounds over time has re-cently been nearly exponential. This increasing volume of data provides a rich source of knowledge for exploring structure-activity relationships. Furthermore, activity data can be used to study interaction of ligands with therapeutic tar-gets or promiscuity of bioactive compounds.
Activity data can also be used to determine the structural diversity of com-pounds globally as well as for individual targets. In this context, scaolds are often used in order to represent the core structures of active compounds. Scaolds are systematically extracted from active compounds by removing all substituents while retaining all ring structures and linker fragments between ring structures. As a further abstraction from scaolds, CSKs are generated to focus on the molecular topology. The hierarchical organization from compounds to scaolds to CSKs facilitates comparison of structures at dierent levels of abstraction.
In this work, we intended to explore the nature of compound data growth and investigate if the newly available active compounds for targets were struc-turally similar or diverse. The growth of bioactive compounds and scaolds was monitored over a span of 15 years for ve major target families. Scaolds and CSKs were systematically extracted for compounds with high-condence activity data from ChEMBL database and compound-scaold-CSK hierarchy was employed to analyze structural diversity of compounds and topological di-versity of scaolds over time for all major target families.
Reprinted with permission from Jasial, S.; Hu, Y.; Bajorath J. Assessing the Growth of Bioactive Compounds and Scaolds over Time: Implications for Lead Discovery and Scaold Hopping. Journal of Chemical Information and Modeling 2016, 56, 300-307. Copyright 2016 American Chemical Society
Assessing the Growth of Bioactive Compounds and Sca
ff
olds over
Time: Implications for Lead Discovery and Sca
ff
old Hopping
Swarit Jasial, Ye Hu, and Jürgen Bajorath*
Department of Life Science Informatics, B-IT, LIMES Program Unit Chemical Biology and Medicinal Chemistry, Rheinische Friedrich-Wilhelms-Universität, Dahlmannstr. 2, D-53113 Bonn, Germany
ABSTRACT: The increase in compounds with activity against five major therapeutic target families has been quantified on a time scale and investigated employing a compound−scaffold−cyclic skeleton (CSK) hierarchy. The analysis was designed to better understand possible reasons for target-dependent growth of bioactive compounds. There was strong correlation between compound and scaffold growth across all target families. Active compounds becoming available over time were mostly represented by new scaffolds. On the basis of scaff old-to-compound ratios, new active old-to-compounds were structurally diverse and, on the basis of CSK-to-scaffold ratios, often had previously unobserved topologies. In addition, novel targets emerged that complemented major families. The analysis revealed that compound growth is associated with increasing chemical diversity and that current
pharmaceutical targets are capable of recognizing many structurally different compounds, which provides a rationale for the rapid increase in the number of bioactive compounds over the past decade. In light of thesefindings, it is likely that new chemical entities will be discovered for many small molecule targets including relatively unexplored ones as well as for popular and well-studied therapeutic targets. Moreover, given the wealth of new“active scaffolds”that have been increasingly identified for many targets over time, computational scaffold-hopping exercises should generally have a high likelihood of success.
■
INTRODUCTIONIn pharmaceutical research, increasing volumes of compounds and activity data are becoming available. Not only data volumes but also complexity and heterogeneity are increasing, giving rise to the advent of big data phenomena in medicinal chemistry,1,2 similar to developments in biology and bioinformatics over the past decade,3 albeit still at lesser magnitude. Although large volumes of complex activity data are difficult to analyze, these data represent a valuable knowledge base for the large-scale exploration of structure−activity relationships and compound design.4Analysis of activity data also helps to better understand ligand binding characteristics of therapeutic targets5 or promiscuity among bioactive compounds,6,7 which is defined as the ability of small molecules to specifically interact with multiple targets, a prerequisite for polypharmacological effects.8−10
Activity data can also be related to structural classification schemes. For example, the scaffold concept has been applied over the last two decades to define core structures of compounds in a consistent manner.11 Scaffolds are typically extracted from compounds by systematic removal of sub-stituents.12 Accordingly, a series of analogs yields the same scaffold. The scaffold concept has provided a basis for the generation of data structures such as the scaffold tree13
to systematically organize compound collections and annotate them with activity information. Scaffold-based compound organization can be extended through the generation of carbon skeletons, also termed cyclic skeletons (CSKs),14 which
represent a further abstraction from chemical structures focusing on molecular topology and enable the implementation of compound−scaffold−CSK hierarchies for structural organ-ization and data analysis.15A CSK represents a set of scaffolds that share the same topology and are only differentiated by heteroatom replacements and/or bond order variations. Scaffold and CSK analysis is often carried out to assess the structural diversity of compound collection, which is from a chemical perspective more intuitive than the calculation of descriptor-based similarity values.16−18
The compound−scaffold−CSK hierarchy was previously employed by us to systematically explore structural relation-ships between scaffolds across bioactive compounds and study the potency range distribution of compounds sharing the same activity that were represented by different scaffolds.15
A major finding of this analysis was that many pairs of structurally distinct scaffolds represented highly potent compounds.15
The scaffold concept has also been applied to introduce “scaffold hopping”,19,20 which refers to computer-aided identification of compounds that share the same activity but differ in their core structures. Scaffold hopping through virtual compound screening is often regarded as one of the central tasks in computational medicinal chemistry.
We have been interested in exploring the nature of compound data growth in relation to scaffold growth and Received: December 1, 2015
Published: February 2, 2016
Article
pubs.acs.org/jcim
© 2016 American Chemical Society 300 DOI: 10.1021/acs.jcim.5b00713
diversity. How fast are volumes of bioactive compounds increasing and why are they increasing? Might the increase largely be due to extension of known compound series (perhaps reflecting a form of chemical “me-too-ism”)? Or is diversity generated among novel active compounds? Alter-natively, might the increase be due to the emergence of novel targets for which new active compounds are identified? We have set out to explore these previously unaddressed questions. Therefore, the increase in bioactive compounds over time was quantified for five major target families, and the compound−scaffold−CSK hierarchy was employed to charac-terize increasing volumes of bioactive compounds and analyze compound-to-scaffold ratios. For thefirst time, the growth of bioactive compounds and scaffolds extracted from them was followed on a time course over 15 years. This made it possible to monitor compound-to-scaffold ratios during periods of largest compound and activity data growth and compare the progression to earlier years when compound and data volumes were limited. A major and rather unexpected finding of our analysis has been that target-based growth of active compounds was consistently paralleled by increases in scaffold diversity across all major target families, independent of compound and data volumes. This has several implications for small molecule discovery as also discussed herein.
■
MATERIALS AND METHODSData Selection and Curation. Compounds and activity data were extracted from ChEMBL (release 20).21 Only compounds active against targets belonging to five major families were considered, including class A G protein-coupled receptors (GPCRs), ion channels, protein kinases, nuclear receptors, and proteases. These target families were organized following the UniProt22 and ChEMBL target classification schemes.
To ensure high data confidence, several preselection criteria were applied as implemented in ChEMBL. Compounds were extracted for which direct interactions (i.e., assay relationship type “D”) with human single-protein targets at the highest confidence level (assay confidence score 9) were reported. The two parameters,“assay relationship type”and“assay confidence score”, qualify and quantify the level of confidence that a compound is tested against a given target in a relevant assay system, respectively. Relationship type “D” and confidence score 9 indicate the highest level of confidence for activity data from ChEMBL. Furthermore, two types of potency measure-ments were considered including (assay-independent) equili-brium constants (Ki) and (assay-dependent) IC50values. Only explicitly specified Kiand IC50values were taken into account, and all approximate measurements such as“>”,“<”, or“ ∼” were discarded. In addition, activity records with comments “inactive”, “inconclusive”, or “not active” were removed. Furthermore, compounds with activity records that did not contain publication dates were disregarded.
For a given target, activity data were examined to detect compound potency values reported in the same or different years. The following selection criteria were applied. Com-pounds with multiple potency measurements for the same year that differed by more than 1 order of magnitude were removed. In addition, compounds having multiple measurements in multiple years that differed by more than 1 order of magnitude were also discarded. However, if multiple measurements were reported in different years that fell into the same order of magnitude, the compound and thefirst reported potency value
were retained. For example, if a potency value of 4 nM was reported for a given compound in 2010 and 3 nM in 2011 for the same target, the compound was selected and 2010 potency value (4 nM) was assigned to the target. Furthermore, compounds with a single qualifying potency measurement were also retained.
Selected compounds and their activity data were assigned to individual years from 2000 to 2014 (all data reported prior to 2000 were assigned to year 2000).
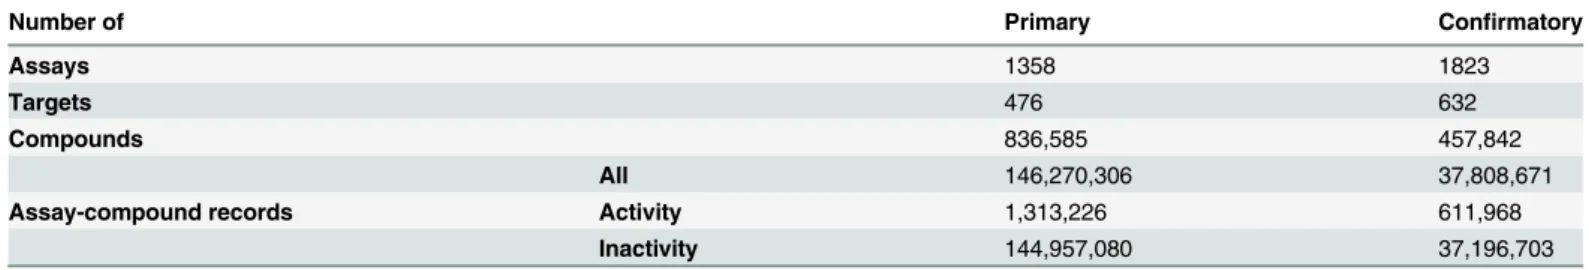
The final curation step yielded all target-based compound sets for thefive major families.Table 1reports the total number
of targets and compounds available for individual families. A target belonging to any one of these families was only considered if at least 10 active compounds were available. Accordingly, new targets or targets that had for other reasons very low compound coverage were omitted from further analysis. The number of these largely unexplored targets varied from three (nuclear receptors) to 100 (kinases). The number of compounds that were exclusively active against these targets and were also excluded from the analysis only ranged from six (nuclear receptors) to 57 (kinases). Hence, major target families contained novel and unexplored targets. For these targets, only small numbers of compounds were available, and their exclusion could not possibly bias the analysis given the large number of more than 100,000 qualifying compounds reported inTable 1. Moreover, when unexplored targets were omitted, a total of 507 qualifying targets with different degrees of chemical exploration remained that were associated with 101,825 active compounds including unique 99,216 molecules (and 2609“promiscuous”compounds belonging to more than one target family). Given the large number of qualifying targets and compounds, the probability that the analysis might be biased by individual targets was extremely low.
Compound−Scaffold−Skeleton Hierarchy. For com-pounds of all target sets, a molecular hierarchy was generated. First, scaffolds were systematically extracted from active compounds by removing all substituents and retaining ring systems and linkers between them.12 For each target, the scaffold-to-compound ratio was calculated by dividing the number of unique scaffolds available in a given year by the total number of compounds these scaffolds represented. Hence, a ratio of 1 meant that each compound contained a unique scaffold (reflecting highest possible scaffold-based diversity). In addition, cyclic skeletons (CSKs) were derived from scaffolds by converting all heteroatoms to carbon and all bond orders to single bonds.14A given CSK might represent multiple scaffolds with conserved topology. For each target, the CSK-to-scaffold Table 1. Target Family-Based Compound Setsa
number of target family all targets all compounds qualifying targets qualifying compounds GPCRs 165 46,905 153 46,885 kinases 276 21,756 176 21,699 ion channels 80 10,748 50 10,723 nuclear receptors 27 5032 24 5026 proteases 143 17,534 104 17,492 a
For each family, the total number of targets and compounds available in ChEMBL and the number of targets and compounds qualifying for our analysis are reported.
Journal of Chemical Information and Modeling Article
DOI: 10.1021/acs.jcim.5b00713 J. Chem. Inf. Model.2016, 56, 300−307
ratio was also calculated by dividing the number of unique CSKs in a given year by the total number of scaffolds they represented. A ratio of 1 reflected the highest level of topological diversity within a scaffold set (i.e., all scaffolds were topologically distinct). All scaffolds and CSKs were calculated using in-house implementations that utilize the OpenEye toolkit.23
■
RESULTS AND DISCUSSIONAnalyzing the Increase in Active Compounds and Scaffolds over Time. The compound selection strategy applied here made it possible to follow target- and family-based growth of active compounds over time. For each year, the number of newly reported compounds and the cumulative number of active compounds were determined on a per-target basis and monitored for each family. Corresponding scaffolds and CSKs were also determined. The numbers of compounds, scaffolds, and CSKs were then related to each other, hence permitting a target family-based assessment of scaffold growth and topological diversity accompanying the increase in compound volumes over time.
Growth of Compounds and Targets. Figure 1 reports the family-based growth of active compounds and targets over
different years. Beginning in about 2006, a significant general increase in the number of compounds and targets was observed. For example, for class A GPCRs and the kinase family, the number of active compounds increased from 1227 to 46,885 (Figure 1a) and 380 to 21,699 (Figure 1b), respectively. The number of corresponding targets increased at different rates. The growth rate of targets from the class A GPCR family was slower than the growth of the corresponding compounds, as reported in Figure 1a. Steady increase in the number of targets was detected for the kinase, ion channel, and protease family, which paralleled the compound growth, as shown inFigure 1b, c, and e, respectively. A different pattern
was observed for nuclear receptors where the number of targets significantly increased in 2004 and then essentially remained constant between 2008 and 2012 (Figure 1d).
Increase in Scaffolds.Figure 2reports the increase in the number of scaffolds in target sets over time. Here, different observations were made. Both on the basis of the maximal and average number of scaffolds, striking scaffold growth was observed for all target families from 2000 to 2014. As a representative example, the number of available scaffolds for histamine H3 receptor increased from only one in 2000 to 1270 in 2014. Furthermore, compounds with HERG antitarget Figure 1.Growth of compounds and targets. In panels (a−e), the growth of compounds and targets is reported for thefive target families. For each year, the cumulative number of compounds is shown using bar graphs (scale on the left vertical axis). In addition, the cumulative number of targets is traced using a black line (scale on the right axis).
Journal of Chemical Information and Modeling Article
DOI: 10.1021/acs.jcim.5b00713 J. Chem. Inf. Model.2016, 56, 300−307
activity were first detected in 2004. By 2014, HERG ligands were represented by 2457 scaffolds.
Interestingly, significant differences were evolving between the median and average number of scaffolds across all families, except nuclear receptors. The differences indicated that the scaffold distribution was increasingly dominated by a subset of the target sets with rapidly growing numbers of scaffolds, as indicated by the maximal numbers reported inFigure 2. On the basis of median numbers of scaffolds reported inTable 2, there was substantial overall growth in scaffold numbers since 2000.
However, different target families exhibited scaffold growth at varying magnitude. For example, the median number of scaffolds for class A GPCR targets increased from 14 in 2000 to 102 in 2014. Furthermore, in 2000, only 24 compounds represented by two scaffolds were detected having activity against a single nuclear receptor. However, by 2014, the median number of scaffolds for this family was 68 (Table 2). The overall smallest increase in the median number of scaffolds, from 18 to 31, was detected for kinases, although large increases were observed for a limited number of kinase sets, as reflected by the differences between median and average numbers.
The relationship between compound and scaffold growth was analyzed for all families and was found to be highly correlated, with correlation coefficients between 0.97 and 0.99. This strong correlation indicated that data increase was largely due to the addition of new compounds represented by new scaffolds. As a control calculation, the correlation between the number of compounds and scaffolds was also analyzed for all available targets, regardless of their family relationships. Nearly perfect correlation was also observed in this case.
Taken together, thefindings revealed a steady and significant increase in the amount of scaffolds for all major target families, Figure 2.Growth of scaffolds. In panels (a−e), the growth of scaffolds is reported for thefive target families using box plots for each year. A box plot gives the smallest number of scaffolds per year (bottom line),first quartile (lower boundary of the box), median value (thick line), third quartile (upper boundary of the box), and largest number of scaffolds per year (top line). The largest number of scaffolds per year is explicitly reported for years when this number exceeds the maximal value given on the vertical axis. The average number of scaffolds per year is traced using a black line.
Table 2. Scaffold Mediansa
median number of scaffolds
target family 2000 2014 GPCRs 14 102 kinases 18 31 ion channels 4 23.5 nuclear receptors 2 68 proteases 16 42 a
For each family, the median number of unique scaffolds over all target sets is compared for 2000 and 2014.
Journal of Chemical Information and Modeling Article
DOI: 10.1021/acs.jcim.5b00713 J. Chem. Inf. Model.2016, 56, 300−307
which strongly correlated with the growth of compounds. These families included target sets for which very large numbers of scaffolds became available over time. New compounds becoming available each year were predominantly represented by new scaffolds.
Structural Diversity of Compounds. The
scaffold-to-compound ratio was calculated to quantitatively assess the structural diversity of active compounds.Figure 3reports the distribution of scaffold-to-compound ratios for targets from all five families. Different trends were observed. As shown in
Figure 3a, b, and e, targets from the class A GPCR, kinase, and protease family displayed a wide range of scaffold-to-compound ratios. In these families, targets interacting with structurally diverse compounds (i.e., ratio close to 1) or structurally homogeneous compounds (ratio close to 0) frequently occurred. However, the median and average scaffold-to-compound ratios remained nearly constant over time, i.e., close to 0.5. Hence, on average, an individual scaffold represented two compounds across these target families.
By contrast, notable fluctuations in the distribution of the scaffold-to-compound ratios over time were observed for ion channels and nuclear receptors, as reported inFigure 3c and d, respectively. These fluctuations likely resulted from the presence of relatively small numbers of targets and active compounds for these two families during early years (giving rise
to statistical imbalances). In addition, the mean and average ratios were lower for these than the other three larger families. Hence, scaffold-based structural diversity of compounds active against different ion channels and nuclear receptors was generally limited.
Topological Diversity of Scaffolds.A CSK represents a set of topologically equivalent scaffolds. Thus, the CSK-to-scaffold ratio for a target set is an indicator of the degree of topological diversity among scaffolds. Distributions of the CSK-to-scaffold ratios for the five target families are reported in
Figure 4. Average and median CSK-to-scaffold ratios were
above 0.7 for most of the years. Fluctuations in these ratios over time and differences within and between target families were limited. Therefore, a high degree of topological diversity of scaffolds was observed for the majority of target sets.
Scaffold-to-Compound vs CSK-to-Scaffold Ratios.The CSK-to-scaffold ratios (Figure 4) were generally higher than the scaffold-to-compound ratios (Figure 3). On average, less than two scaffolds were represented by a given CSK. There was no detectable correlation between these two ratios over target sets and families (data not shown), indicating that high scaffold diversity (high scaffold-to-compound ratios) did not necessarily lead to topological diversity (high CSK-to-scaffold ratios) and vice versa.Figure 5shows scaffolds from two exemplary target
sets containing compounds with varying degrees of structural Figure 3.Scaffold-to-compound ratio. In panels (a−e), the scaffold-to-compound ratios are reported for thefive target families in a box plot format according toFigure 2. The average ratio per year is traced using a black line.
Journal of Chemical Information and Modeling Article
DOI: 10.1021/acs.jcim.5b00713 J. Chem. Inf. Model.2016, 56, 300−307
and topological diversity. In Figure 5a, scaffolds from beta-2
adrenergic receptor ligands are shown. Over time, a total of 355 compounds were found to be active against this receptor that were represented by 173 unique scaffolds and 137 unique CSKs. Accordingly, the scaffold-to-compound and CSK-to-scaffold ratios in 2014 were 0.49 and 0.79, respectively. Hence, in this case, a scaffold represented on average two compounds, and most of the scaffolds were topologically distinct. By contrast, Figure 5b shows scaffolds from inhibitors of MAP
kinase-activated protein kinase 5 that yielded a much higher scaffold-to-compound ratio and much lower CSK-to-scaffold ratio, i.e., 0.95 and 0.50, respectively. Thus, in this case, scaffolds had equivalent topology more frequently, but most of the scaffolds represented only a single inhibitor. In particular, recurrent scaffold topologies were detected in 2012 and 2013. Scaffolds sharing these topologies only differed by one or more heteroatoms, as illustrated in Figure 5b. A variety of combinations between scaffold-to-compound and CSK-to-scaffold ratios were observed.
Implications and Conclusions.Herein, we have presented a systematic analysis of growth of compounds active against major target families and the scaffolds and CSKs these compounds contain. The analysis was inspired by our interest to better understand what might be major cause(s) for the increase in the number of compounds active against major
target families and how the increase might relate to chemical diversity and the emergence of new targets. The compound− scaffold−CSK hierarchy was employed as an indicator of structural and topological diversity, taking into consideration that boundaries between existing compound series and new structural classes are oftenfluid. Compound series representing a spectrum of structural relationships might often yield distinct scaffolds due to heteroatom substitutions in core structures or ring additions. However, the compound−scaffold−CSK hier-archy is a robust and consistently applicable analysis scheme to organize compound populations and assess structural diversity. As quantified in our analysis, there has been rapid growth of compounds active against major target families over the past decade. In addition, new targets have emerged over time complementing these families. As reported herein, compound growth is accompanied by a significant increase in the amount of scaffolds for all major target families. Importantly, new active compounds mostly contain new scaffolds. Hence, on the basis of scaffold-to-compound ratios, new active compounds are structurally diverse and, on the basis of CSK-to-scaffold ratios, frequently display new topologies. Therefore, the picture is emerging that major targets interact with many chemically diverse compounds, giving rise to substantial growth of bioactive compounds. Although an earlier study had shown that many compound activity classes were characterized by high Figure 4.CSK-to-scaffold ratio. In panels (a−e), the CSK-to-scaffold ratios are reported for thefive target families in a box plot format according to
Figure 2. The average ratio per year is traced using a black line.
Journal of Chemical Information and Modeling Article
DOI: 10.1021/acs.jcim.5b00713 J. Chem. Inf. Model.2016, 56, 300−307
scaffold diversity,24
the creation of chemical diversity as a major cause of compound growth was not anticipated. This also implies that current pharmaceutical targets are capable of
recognizing many structurally distinct compounds. This ability is essentially at the root of the rapid growth of bioactive compounds and exploited using increasing numbers of Figure 5.Exemplary scaffolds. Shown are scaffolds extracted from compounds active against (a) beta-2 adrenergic receptor and (b) MAP kinase-activated protein kinase 5. For each target, the total number of compounds, scaffolds, and CSKs available in 2014 is reported together with the scaffold-to-compound and CSK-to-scaffold ratio. For each year, the number of novel scaffolds is given in bold. For example,“2001:8”means that eight new scaffolds became available in 2001. Panel (a) shows a representative scaffold per year. Panel (b) shows all new scaffolds for different years. Journal of Chemical Information and Modeling Article
DOI: 10.1021/acs.jcim.5b00713 J. Chem. Inf. Model.2016, 56, 300−307