RoleVAT: Visual Assessment of Practical Need for Role Based Access Control
Dana Zhang
The University of Melbourne [email protected]
Kotagiri Ramamohanarao The University of Melbourne
Steven Versteeg CA Inc
Rui Zhang
The University of Melbourne [email protected]
Abstract—Role based access control (RBAC) is a pow-erful security administration concept that can simplify permission assignment management. Migration to and maintenance of RBAC requires role engineering, the identification of a set of roles that offer administrative benefit. However, establishing that RBAC is desirable in a given enterprise is lacking in current role engineering processes. To help identify the practical need for RBAC, we propose RoleVAT, a Role engineering tool for the Visual Assessment of user and permission Tendencies. User and permission clusters can be visually identified as potential user groups or roles. The benefit and impact of this visual analysis in enterprise environments is discussed and demonstrated through testing on real life as well as synthetic datasets. Our experimental results show the effectiveness of RoleVAT as well as interesting user and role tendencies in real enterprise environments.
I. INTRODUCTION
Role-based access control (RBAC) is an efficient and flexible model for controlling computer resource access and enforcing organizational policies [1], [2]. In this security administration model, permissions are assigned to roles and roles are assigned to users. The additional layer of abstraction simplifies system administration and enhances security policy enforcement.
Deployment as well as maintenance of RBAC re-quires role engineering [3], the definition of a set of roles that accurately reflect the needs of the enterprise. Recent works have used role mining, the application of data mining techniques for automated and semi-automated approaches for role engineering [4], [5], [6], [7], [8]. Techniques that have been used include latticed based pattern search, pattern mining and graph representation for cost analysis. Fundamentally, all these role mining approaches use clusters of permissions to form roles.
A major problem in clustering is the assessment of cluster tendency, i.e., how many clusters to seek? Ten-dency analysis is an important first step prior to pattern extraction where input data is examined to see if clusters can be formed [9], [10], [11], [12]. In application to role mining, this means knowing if role clusters exist, the number of roles that are expected if role clusters do
exist and how distinctive these roles are. If roles cannot be formed, RBAC may not be practical in the given enterprise. A good result cannot be expected from role mining if role tendencies do not exist in the data. If roles can exist, the number of roles can be determined in advance and how many roles to search for is known. Tendency analysis can also determine distinctiveness of the roles; if roles are highly correlated and if roles contain overlapping permissions.
However, existing role mining approaches do not analyse role tendency. While the effect of different role quantities have been analysed in practice [13], there is currently no methodology for determining the best role quantity. If all permissions are very similar, only one role can be generated. This can occur when all users have been assigned the same permissions, allowable with the loosest possible administration reinforcement when everyone has all possible permissions. If all permission assignments are very distinct and too many roles are possible, implementation of RBAC may not be considered practical.
This can occur if no two users share responsibilities and each user performs a unique job functionality. In these situations, too few or too many roles are generated. While it may still be desirable to implement RBAC for the other benefits that roles can provide (adherence to policy, separation of duty constraints), role mining techniques may not be able to extract efficient roles.
Another important step in pattern or cluster analysis is to determine the number of clusters or patterns. In relation to role engineering, this is the determination of the role quantity. Identifying role quantity before the role engineering process is of great benefit for existing role mining methods and when deciding if RBAC can be beneficial.
Existing approaches also face limitations when the size of the data becomes too large. Cluster tendency analysis of users can identify if user groups exist, allow-ing for partitionallow-ing of permission data so a divide and conquer approach to role engineering can be deployed. Data partitioning of users into groups and role tendency analysis would complement existing approaches.
To address these issues, this research proposes Role-VAT, a Role engineering tool for the Visual Assessment of user and permission Tendencies. RoleVAT produces intensity images that represent the natural groupings of users and permissions. Permission similarity images show role tendencies and user similarity images show possible data partitioning. This visual assessment of permission clusters allow for immediate identification of the practical need for RBAC. RoleVAT is a prepro-cessing tool to assist role mining techniques, capable of determining if roles can be identified, how many roles can be identified and if the user permission data can be partitioned.
This paper is organised as follows. Section II will dis-cuss related work and motivation for our research. We introduce RoleVAT in Section III and test the approach in Section IV. Section V discusses our findings and we conclude in Section VI.
II. RELATEDWORK
An essential task for practical implementations of RBAC is role engineering, the definition of a set of roles that is complete, correct and efficient. Coyne [3] was the first to motivate such a task and subsequent methods have used both manual elicitation and auto-mated methods.
Initial user driven techniques for role engineering, termed top-down role engineering have used job func-tionalities, documented processes, usage scenarios as well as use cases to determine access rights [14], [15], [16]. However, manual derivation of roles requires large amounts of user input before effective roles can be defined. Manual elicitation is time consuming, costly and prone to errors.
To assist top-down role engineering, both research and practice have turned tobottom-up role engineering that analyses existing user permission assignments for automated role extraction. These role recommendations can then be used to assist the final design of the RBAC system.
The majority of bottom up approaches have usedrole mining: the application of data mining techniques for role definition [6]. Theoretical analysis by Vaidya et al. [17] and Lu et al. [18] show the problem of finding the minimal set of descriptive roles and relationships without disturbing permission assignments and their variations are NP-complete. Ene et al. [19] show the problems are also hard to approximate. As a result, heuristics and greedy approaches for role extraction currently offer the best solutions to the role mining problem. Majority of these methods have used clus-tering [7], [20], with more recent works focusing on
latticed based clustering. Colantonio et al. and Malloy et al. generate lattices of all possible permission clusters as roles and prune roles according to a cost metric [4], [5], [21]. Zhang et al. builds a lattice of permission clusters using a cost metric, each cluster identified as a role using frequent pattern extraction [8].
Graph mining approaches for automated role ex-traction have also been proposed. Zhang et al. [13] and Ene et al. [19] place users, permissions and their relationships into a cost graph as nodes and edges respectively. Zhang et al.’s heuristic inserts role nodes between users and permissions and merge roles if doing so reduces the cost of the graph structure. Ene et al. uses heuristics and graph theory to reduce the graph representations to find roles.
These approaches do not analyse the trends of the roles before the application of clustering; there is cur-rently no role tendency analysis to establish the practical need for RBAC.
III. ROLEVAT
Analysing cluster tendency is a challenging problem in data mining [12]. It is a step prior to actual clus-tering to determine if clusters exist. In application to role engineering, role cluster tendency analysis can be used to determine practical need for RBAC. Cluster tendency analysis can be performed on both users and permissions for the assessment of user groups and roles respectively.
A technique that exists in data mining for the Visual Assessment of cluster Tendency is VAT [9], [10], [11], [22], an approach that analyses cluster tendency using ordered dissimilarity images. VAT requires pairwise dissimilarity values between objects and reorders the values in a square matrix. An intensity image repre-sentation of the matrix shows clusters as dark block structures along the diagonal. Further analysis and proof of concept of original VAT can be found in [9].
To use VAT for role engineering, we propose Role-VAT, a Role engineering tool for the Visual Assessment of user and permission Tendencies to establish practical need for RBAC. RoleVAT can be used on both users and permissions given the user permission assignments of an enterprise. User dissimilarity can be measured using user’s permission assignments and can show organisa-tional units and user partitions. Permission dissimilarity can be measured using the users that have been assigned a particular permission, revealing permission cluster tendencies, role quantity and distinctiveness.
Section III-B will describe the RoleVAT algorithm and how to compute the required dissimilarity matrices and images for RBAC. To demonstrate the algorithm,
Section III-C will present a running example of the algorithm. As a preamble, Section III-A will introduce the RBAC terminology that will be used throughout the rest of the paper.
A. Preliminaries
The following concepts have been proposed by the National Institute of Standards and Technology (NIST) for RBAC [2]:
• USERS, ROLES and PRMS, the set of users, roles and permissions respectively where permissions represent allowable operations on objects within the system.
• UA⊆USERS×ROLES, a many to many mapping of user to role assignments.
• PA⊆PRMS ×ROLES, a many to many mapping of permission to role assignments.
• UserPermissions(u), the set of all permissions a given user gets through his or her roles.
To analyse the tendency of ROLES and USERS par-titions using RoleVAT, we focus on UP ⊆ USERS × PRMS, the underlying many to many mapping of user to permission assignments.UPcan be represented using{UserPermissions(u)}and{PermissionUsers(p)}, the multiset of permissions assigned to users and the multiset of users that has been assigned a particular permission respectively.
B. Algorithm
Algorithm 1 describes RoleVAT. RoleVAT requires either {UserPermissions(u)}, the multiset of permis-sion assignments for users or {PermissionUsers(p)}, the multiset of user assignments for permissions. {UserPermissions(u)}is required to identify user group clusters and {PermissionUsers(p)} is required for the analysis of role tendency. Since RoleVAT can be per-formed on either of these attribute sets, the initial input will be denoted{S}. Given the multiset{S}, RoleVAT can be understood in three components. The first part of RoleVAT producesD, a matrix containing dissimilarity measures of every pair of items in the multiset (lines 2– 7). The second part of the algorithm reorders D to place similar items closer to each other in a matrix (lines 8–15). Finally, the reordered matrixD′ is output as grayscale imageI(D′)(line 16).
The first part of RoleVAT creates the initial dissimi-larity matrix (Lines 2–7). Line 4 requires a dissimidissimi-larity measure between users or permissions. Since users are represented by permission sets and permissions can be described using user sets, a measure of set dissimilarity can be used. User and permission dissimilarity can be
Algorithm 1: RoleVAT - Role engineering tool for Visual Analysis of cluster Tendency
Require: multiset of user or permission sets{S}
begin 1
// Generate Dissimilarity Matrix D= [dij]
foreach setSi in{S}do
2
foreach permission setSjin{S}do
3
measure dissimilarity ofSiwith everySj
4
place similarity measure ofSiandSj indij
5 of matrixD end 6 end 7
// Reorder Dissimilarity Matrix D= [dij] to produce D′= [d′ij]
SetI=∅,J={1,2, . . . ,|{S}|}, 8
P= (0,0, . . . ,0)
Select(i, j)of largestdxywherex∈Jandy∈J
9
SetP(1) =i, add itoI, removeifromJ
10
forp= 2,3, . . . ,|{S}|do 11
Select(i, j)of smallestdxy inD wherex∈I
12
andy∈J
SetP(p) =j, add jtoI, removejfromJ
13 end 14 D′= [d′ij] = [d P(i)P(j)] 15
// Create intensity image
outputD′to as an intensity image I(D′)- eachd′ ij
16
represents a pixeliijin the grayscale image
end 17
computed using a variety of methods and substituted in line 4. For our approach, the following measure is used.
dis(Si, Sj) = 1−
|Si∩Sj|
|Si∪Sj|
(1) This measure is based on the Jaccard co-efficient [23], a statistical similarity measure where 0≤ |Si∩Sj|
|Si∪Sj| ≤1,
and0 implies no similarity between Si andSj, and 1 represents an exact match between Si and Sj. Using this, dissimilarity can be measured using Equation 1, where 0≤dis(Si, Sj)≤1, and1 implies no similarity between Si andSj, and a0 implies Si andSj are the same. Each dissimilarity measure between Si and Sj are placed into dij of matrix D in line 5. This measure was chosen due to its effectiveness for set comparison. A similarity distance between individual permissions is not required and every set can be compared to every other set without additional pre-processing.
The second part of RoleVAT produces D′, the re-ordered D where similar sets are placed next to each other in the matrix (lines 8–15). This can also be performed using a number of methods. In this approach, we have used the original VAT reordering method: a greedy approach that starts with the most dissimilar object and continuously places the next most similar
in the next position of the matrix until all values are reordered [9], [11].
To assist with the reordering, line 8 initialises I, J and P to be the collection of sorted matrix indices, the collection of unsorted matrix indices and the new positions of dij respectively. The first step of the re-ordering is to select the most dissimilar object in S, chosen as the column or row with the largestdij inD (line 9). This index is placed as the first position in P, added to the sorted indices I and removed from the unsorted indices J (line 10). This is the most costly component of RoleVAT and a straight forward implementation of the algorithm has complexityO(n3
) wherenis the number of permissions or users (|{S}|). However, RoleVAT reordering can be implemented in O(n2
) by keeping a cache of the previous iteration’s minimum distances between each element inJ and the set of already ordered elements, I.
The next step of the reordering is to choose an object in J that is most similar to the objects in I (line 12). After this item is found, the index is placed into the next position inP, the index is added toIand removed from J in line 13. This step is repeated until all the indices have been reordered (lines 11–14). Line 15 producesD′ using the reordered positions stored inP.
Finally, the dissimilarity matrix D′ is converted to a grayscale image with each dissimilarity measure in the matrix corresponding to a pixel in the imageI(D′) (line 16). When using Equation 1, every value inDand D′ is guaranteed to be between 0 and 1 (inclusive). By representing 0 as black, 1 and white and every value in between as a scaled intensity,I(D′)is a trivial mapping of matrix dissimilarity to pixel intensity.
C. Running Example
To assist RoleVAT comprehension, we present a sim-ple running examsim-ple of a scaled version of the problem. While RoleVAT is capable of analysing large datasets as shown in our experimentation in Section IV, this section demonstrates the fundamental steps that are required using a small dataset.
Table I contains the data that will be used in this example. Table I(a) lists the users that have been as-signed permissions. This information can also be turned into permission sets that are associated with users, as in Table I(b). For completeness, the role assignments in relation to users and permissions for RBAC are given in Tables I(c) and I(d).
Application of RoleVAT to permission analysis re-veals role tendency information and requires dissimi-larity of user sets. Using the information in Table I(a), theS that is required for Algorithm 1 is{{Anu, Chris,
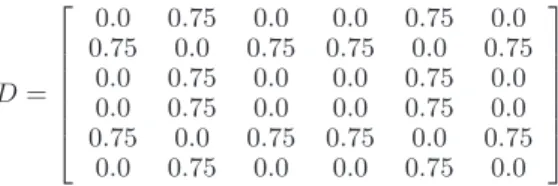
Sue}, {Bob, Sue}, {Anu, Chris, Sue},{Anu, Chris, Sue},{Bob, Sue},{Anu, Chris, Sue}}. Given{S}, the first step of Algorithm 1 is to generate dissimilarity matrix D (Lines 2–7). Using {S} and Equation 1 as a similarity measure, the following matrix with similar-ities to two decimal places can be generated.
D= 0.0 0.75 0.0 0.0 0.75 0.0 0.75 0.0 0.75 0.75 0.0 0.75 0.0 0.75 0.0 0.0 0.75 0.0 0.0 0.75 0.0 0.0 0.75 0.0 0.75 0.0 0.75 0.75 0.0 0.75 0.0 0.75 0.0 0.0 0.75 0.0
The dissimilarity of d1,1 and any di,i will be 0, as seen along the diagonal of matrixD. A set compared to itself will always yield an exact match. To generate d1,2, dis(U1, U2)is computed usingU1= {Anu, Chris, Sue} andU2 ={Bob, Sue}.
dis(U1, U2) = 1−
|{Anu, Chris, Sue} ∩ {Bob, Sue}| |{Anu, Chris, Sue} ∪ {Bob, Sue}|
= |{Sue}|
|{Anu, Bob, Chris, Sue}|
= 1−1
4 = 0.75
Dissimilarity dis(U1, U2) =dis(U2, U1)and is placed into d1,2 and d2,1 of matrix D, resulting in reflective values along the diagonal. All similarities between pairs of permission sets can be generated in this manner.
The next steps of Algorithm 1 reorders the matrixD to produceD′ (lines 8–15). In accordance with Line 8, I,J andP are as follows.
• I=∅,J={1,2,3,4,5,6} andP=(0,0,0,0,0,0)
The highest dissimilarity value in D is 0.75, one of which is in position d1,2. We choose this as the most dissimilar value, and update I,J andP as follows.
• I={1},J={2,3,4,5,6}andP=(1,0,0,0,0,0) During the first iteration of lines 11–14 to identify the next most similar item, a search for the smallest dij wherei∈ {1}, j∈ {2,3,4,5,6}results in positiond1,3 with value 0.0. After this position has been identified in line 12, line 13 updates the collections as follows.
• I={1,3},J={2,4,5,6}andP=(1,3,0,0,0,0) The next iteration of lines 11–14 searches for the smallest dij where i∈ {1,3}, j ∈ {2,4,5,6}. After 5 iterations of lines 11–14, all indices have been reordered with the following sequence of updates.
• I={1,3,4},J={2,5,6}andP=(1,3,4,0,0,0) • I={1,3,4,6},J={2,5}andP=(1,3,4,6,0,0) • I={1,2,3,4,6}, J={5}andP=(1,3,4,6,2,0) • I={1,2,3,4,5,6},J=∅andP=(1,3,4,6,2,5)
Table I
RUNNING EXAMPLE SET UP
(a) Permission to User Assignments Permission Users
perm1 Anu, Chris, Sue perm2 Bob, Sue perm3 Anu, Chris, Sue perm4 Anu, Chris, Sue perm5 Bob, Sue perm6 Anu, Chris, Sue
(b) User to Permission Assignments User Permissions
Anu perm1, perm3, perm4, perm6 Bob perm2, perm5
Chris perm1, perm3, perm4, perm6
Sue perm1, perm2, perm3, perm4, perm5, perm6
(c) User to Role Assign-ments
User Roles Anu role1 Bob role2 Chris role1 Sue role1, role2
(d) Role to Permission Assignments Role Permissions
role1 perm1, perm3, perm4, perm6 role2 perm2, perm5
(a) RoleVAT on permission clus-ter tendency
(b) RoleVAT on user cluster ten-dency
Figure 1. RoleVAT results on running example
Using the resultantP=(1,3,4,6,2,5), line 15 computes D′ as the following. D′= 0.0 0.0 0.0 0.0 0.75 0.75 0.0 0.0 0.0 0.0 0.75 0.75 0.0 0.0 0.0 0.0 0.75 0.75 0.0 0.0 0.0 0.0 0.75 0.75 0.75 0.75 0.75 0.75 0.0 0.0 0.75 0.75 0.75 0.75 0.0 0.0
Finally, the output produced in line 16 using D′ is shown in Figure 1(a). Two dark squares can be seen along the diagonal. Even though one user has been assigned to both roles causing some similarity between the permission clusters, the role tendencies clearly representrole1androle2from Table I(d).
For user cluster tendency analysis, users’ permission sets are compared for similarity. In accordance with Algorithm 1, the multiset {S} = {{perm1, perm2, perm3, perm4}, {perm2, perm5, perm6}, {perm1, perm2, perm3, perm4},{perm1, perm2, perm3, perm4, perm5, perm6}} produce the following dissimilarity matrices. D= 0.0 1.0 0.0 0.33 1.0 0.0 1.0 0.67 0.0 1.0 0.0 0.33 0.33 0.67 0.33 0.0 D′= 0.0 0.0 0.33 1.0 0.0 0.0 0.33 1.0 0.33 0.33 0.0 0.67 1.0 1.0 0.67 0.0
The resulting user group tendency image can be found in Figure 1(b). From this image, it can be seen that the user represented in position 1 of D′ is strongly dissimilar to the user represented position 4 with some similarity with users in position 2 and 3. Two or three user groups are possible. However, due to the size of the example dataset, partitioning of the data would not offer significant benefit.
IV. EXPERIMENTALRESULTS
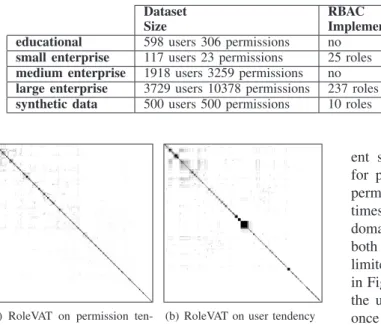
This section shows the results of the proposed Rol-eVAT on both real and synthetically generated user permission assignments. Real access control data was procured from three undisclosed enterprises of differ-ence sizes as well as from an educational domain. To validate our findings further, RoleVAT was also tested on synthetically generated data. Details of datasets as well as processing times can be found in Table II. The experiments analyse both user group and role tenden-cies, and were run using a single core on a 2.38GHz Dell Zeon E5440 Server.
The data from the educational domain originates from The Department of Computer Science and Software Engineering at The University of Melbourne. A Unix set up has been adopted into this environment, where groups are considered assignable permissions and users request permission to certain groups when required. The RoleVAT result on permission tendency is in Figure 2(a)
Table II
DATASET DETAILS ANDROLEVATPROCESSING TIMES
Dataset RBAC User RoleVAT Permission RoleVAT
Size Implemented Processing Time Processing Time
educational 598 users 306 permissions no 0.9 seconds 0.6 seconds small enterprise 117 users 23 permissions 25 roles 0.3 seconds 0.1 seconds medium enterprise 1918 users 3259 permissions no 0.6 minutes 1.1 minutes large enterprise 3729 users 10378 permissions 237 roles 10.9 minutes 37.1 minutes synthetic data 500 users 500 permissions 10 roles 12.0 seconds 7.0 seconds
(a) RoleVAT on permission ten-dency
(b) RoleVAT on user tendency
Figure 2. RoleVAT results on real data from an educational domain
(a) RoleVAT on permission ten-dency
(b) RoleVAT on user tendency
Figure 3. RoleVAT results on medium sized data from an enterprise domain
and the user tendency analysis result is in Figure 2(b). It can be seen that neither user tendency nor permission tendency analysis show distinct user groups or roles. Permission sets appear to be very unique with minimal overlap. There can possibly be one partition where all users have similar permission assignments, represented by the slightly larger black cluster in the middle of Figure 2(b). However, users and permissions exhibit strong dissimilarity with each other.
RoleVAT was also tested on three datasets from real enterprise environments of small, medium and large sizes. Like the data represented by Figure 2, the data from the medium sized enterprise domain also does not have RBAC implemented (Figure 3). There are
appar-ent similarities between Figure 3(a) and Figure 2(a) for permission tendency. Even though the number of permissions in the medium enterprise domain is ten times the number of permissions in the educational domain (as shown in Table II), it can be seen that both datasets contain very distinctive permissions with limited role cluster tendencies. User analysis of the data in Figure 3(b) show slight similarities between many of the users, however the similarities are not strong, and once again, no significant groupings form.
(a) RoleVAT on permission ten-dency
(b) RoleVAT on user tendency
Figure 4. RoleVAT results on small data from an enterprise domain The small and large datasets from enterprise domains both have RBAC implementations. In the RoleVAT results on these datasets (Figure 4 and Figure 5), it is possible to see that both roles and user groupings exist. In the small dataset shown by Figure 4, the large quantity of non-white pixels imply high degrees of similarity. If all permissions are very similar or if all users are very similar, only one role or user group can be formed. However, groupings of both permissions to form several roles and users to form multiple user groups are apparent even with the high correlation.
Figure 4(a) shows permission tendency analysis for roles; one distinctive role in the top left corner and two distinctive roles in the bottom right corner. There are also roles in the middle of the figure, some are large and some are over lapping. The largest possible role grouping consumes approximately a quarter of the image and can be seen to contain roles within it. This
can be due to a number of possibilities. The first is several roles are always assigned together, causing the permissions in these roles to merge into one permission cluster. The second is due to the presence of overlap-ping permissions in roles. If one role contains all the permissions of another role as well as other permissions (as possible in Hierarchical RBAC [24]) or if two roles have a common subset of permissions, the relationship will also be present in the RoleVAT images. While it may be a challenge to see all 25 roles exactly, RoleVAT analysis on permission tendencies show roles definitely exist in the small enterprise data.
RoleVAT on user tendencies for the small enterprise data is shown in Figure 4(b). Based on this RoleVAT result, it can be seen that there is a possibility of user partitioning. It would be possible to partition the data into three, one for each of the two major user groups tendencies and one for the remaining users. However, given the small size of the permission data, partitioning may not be necessary.
(a) RoleVAT on permission ten-dency
(b) RoleVAT on user tendency
Figure 5. RoleVAT results on large data from an enterprise domain Results of RoleVAT on data from the large enterprise domain are in Figure 5. Once again, it can be seen that there are clear role and user group tendencies. In both Figure 5(a) and Figure 5(b), a large proportion of the image is white pixels, making the dark clusters along the diagonal very prominent. Even though this dataset contains over 400 times more permissions and over 30 times more users than small enterprise data, distinct permission and user groupings can be clearly identified. Larger datasets can produce more distinct roles. In these organisations, more users have the same job functionalities and permissions. This produces role tendencies that are more defined.
Figure 5(a) show results of RoleVAT on permission tendency. There are two permission clusters of sig-nificant size with several roles of smaller size. The two largest roles are the permissions assigned to the most number of similar people, or the most frequently
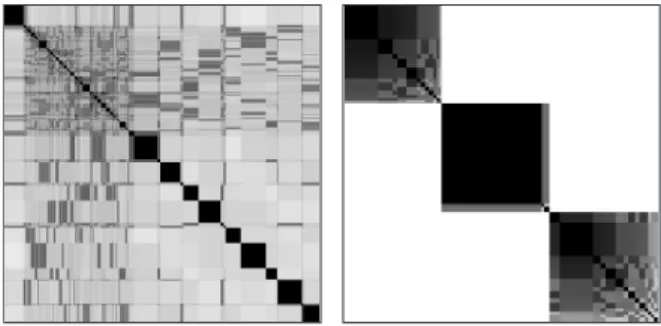
(a) RoleVAT on permission ten-dency on data with 10 roles
(b) RoleVAT on user tendency on data with 3 partitions
Figure 6. RoleVAT results on synthetic dataset
assigned roles. Due to the quantity of the roles, it is difficult to visually identify all 237 role clusters individually.
RoleVAT for user groupings using the large enterprise data can be found in Figure 5(b). Given this result, partitioning on the data with minimal effect on role engineering results is possible. The two prominent solid dark squares in the figure each represent user permission assignments that can separated as a data partition. It may also be possible to separate the slightly correlated user cluster in the top left corner of the image. Due to the size of the large enterprise data, partitions may be required for role mining techniques to produce results in acceptable times.
Finally, RoleVAT was tested with data created us-ing Zhang et al.’s data generator for role engineerus-ing testing [25]. The data generator randomly assigns per-missions to roles and roles to users using a Gaussian distribution given the number of users, roles and per-missions, and the average and standard deviation for number of permissions per role and roles per user. For our testing, data with 500 users and 500 permissions with 10 roles was generated. Each user was assigned an average of 3 roles with 1 role standard deviation and each role had an average of 50 permissions with a 10 permission standard deviation. The roles were removed and direct user permission data was analysed. Figure 6 show the results on the synthetically generated data, and once again, the user and permission tendencies are clear. Figure 6(a) show the RoleVAT result of permission tendency analysis. In this image, 10 prominent dark squares are visible along the diagonal, each representing one of the 10 roles from the original data. There are also significantly smaller squares along the diagonal, created due to the random nature of the data generation process. Zhang et al.’s data generator also allows for data par-titioning. Figure 6(b) shows RoleVAT on users that have been separated into 3 partitions. The 3 user partitions
can distinctively be identified along the diagonals of this image.
RoleVAT required less (often significantly less) than 2 minutes to complete on all datasets except for the large enterprise data, which required 10.9 minutes for 3729 users and 37.1 minutes for 10378 permissions. This is due to the high density of the data; there are 568,966 permission assignments. Given the intractability of the role mining problem and the size of the large enter-prise dataset, this is currently perceived as acceptable processing time.
V. DISCUSSION ANDANALYSIS
Existing role engineering tools cluster similar per-mission assignments to form roles. An important first step in data mining that is currently lacking in existing role mining techniques is cluster tendency analysis. Ten-dency analysis does not identify actual clusters, rather the existence of clusters. In relation to role engineering, tendency analysis is the confirmation of role existence. To address this issue, this research proposes RoleVAT, a preprocessing tool to establish practical need for RBAC through visualisation of user and permission tendency.
Experimental results show RoleVAT to be effective; analysis of computed intensity images immediately re-veal the existence or lack of RBAC capabilities. There is a significant difference between images produced from systems without RBAC in comparison to systems with RBAC. In permission assignment data from enterprises without RBAC, resultant RoleVAT images show limited cluster tendencies along the diagonal (Figure 2 and Figure 3). Given compliance and separation of duty constraints are benefits of RBAC, roles may still be desirable. However, role mining for the identification or roles are not expected to yield good results.
In enterprises suitable for RBAC, organisational units and roles can be visualised. RoleVAT on permission assignment data from enterprises with RBAC show distinctive permission and user clusters in the form of dark square pixels along the diagonal of the image (Figure 4, Figure 5 and Figure 6). This can be used for identification of user and permission groups as well as an indication of an organisation’s RBAC health.
The size and intensity also provides information about the significance of the cluster. A dark square rep-resents strong similarity between permissions or users in the cluster. A large square represents a role or a user group that contains many items. The count, or size of the cluster has often been used as a measure of role cost [4], [8].
Results from RoleVAT can improve with the size of the organisation. Both Figure 4 and Figure 5 contain
access control data from real enterprise domains with RBAC implemented. While strong cluster tendencies can be identified in both datasets, the results from the large enterprise data in Figure 5 show clearer cluster tendencies with crisper edges. Data from larger organ-isations can produce more prominent roles and data partitions.
RoleVAT can analyse both user and permission tendencies. RoleVAT on permission tendency identify trends in role groupings. If permission assignments form clusters, RBAC can easily be implemented. Each of the permission clusters can be mapped to a potential role. How roles relate to each other can also be seen in RoleVAT results. If permissions are assigned to more than one role, if roles have multiple sets of overlapping permissions, this can be identified in the RoleVAT image, as demonstrated in Figure 4(a).
Images produced from RoleVAT on permission as-sessment can also identify role quantity. In Figure 6(a), 10 significant role clusters can be identified, each representing one of the 10 roles in the original data. Currently, role quantity is determined using visual in-spection. Automated role quantity extraction on larger datasets is an avenue for future research.
RoleVAT using permission dissimilarity data reveal many interesting correlations between roles. RoleVAT using user dissimilarity show possible data partitioning, which can improve performance of current role mining techniques. The role mining problem and its variations are NP-Complete. As a result, optimal solutions are unlikely to be identified quickly. However, reasonable solutions can be found quickly in smaller datasets and it has been suggested that data partitioning and merging final results can improve performance. RoleVAT using user dissimilarity show when data partitions can be possible. RoleVAT can be used to identify when data can be partitioned into smaller subsets, thereby enabling faster execution.
RoleVAT is an effective tool for identifying practical need of RBAC within a given enterprise. Role ten-dencies can be identified using permission dissimilarity matrices and user groupings can be identified using user dissimilarities. In some situations, role quantity can also be identified. RoleVAT can be completed within reasonable run times given the complexity of the problem.
VI. CONCLUSION ANDFUTUREWORKS This paper proposes RoleVAT, a Role engineering tool for the Visual Assessment of user and permis-sion Tendencies to identify practical need for RBAC. RoleVAT produces images that represent the natural
permission and user groupings to determine if roles can be identified and if user permission data can be partitioned.
We test the approach on real access control data from enterprise environments as well as synthetically generated data. RoleVAT results reveal interesting at-tributes of RBAC environments. Visual assessment of users and permissions effectively allow for immediate identification of roles and data partitions. There is a clear distinction between datasets with RBAC and datasets without RBAC.
The number of possible data partitions and the quan-tity of roles can be identified. However, when the num-ber of roles is large, visually determining role quantity is tedious and prone to errors. Future work involve automatically determining role quantity using RoleVAT for larger datasets. Currently, RoleVAT analyses user tendency or permission tendency using a square dis-similarity matrix. How RoleVAT can be performed on both user and permission tendency using a rectangular dissimilarity matrix is being investigated.
REFERENCES
[1] D. F. Ferraiolo and D. R. Kuhn, “Role-Based Access Control,” in Proceedings of the 15th NIST-NCSC Na-tional Computer Security Conference, Bultimore, Mary-land, USA, 1992, pp. 554–563.
[2] D. F. Ferraiolo, R. Sandhu, S. Gavrila, D. R. Kuhn, and R. Chandramouli, “Proposed NIST standard for role-based access control,”ACM Transactions on Information and System Security (TISSEC), vol. 4, no. 3, pp. 224– 274, 2001.
[3] E. J. Coyne, “Role engineering,” inRBAC ’95: Proceed-ings of the first ACM Workshop on Role-based access control. New York, NY, USA: ACM Press, 1995, pp. 4–5.
[4] A. Colantonio, R. D. Pietro, and A. Ocello, “A cost-driven approach to role engineering,” inSAC ’08: Pro-ceedings of the 2008 ACM symposium on Applied com-puting. New York, NY, USA: ACM, 2008, pp. 2129– 2136.
[5] A. Colantonio, R. D. Pietro, and A. Ocello, “Leveraging lattices to improve role mining,” in Proceedings of The Ifip Tc 11 23rd International Information Security Conference (SEC’08). Boston: Springer, 2008, pp. 333– 347.
[6] M. Kuhlmann, D. Shohat, and G. Schimpf, “Role mining - revealing business roles for security administration us-ing data minus-ing technology,” inSACMAT ’03: Proceed-ings of the eighth ACM symposium on Access control models and technologies. New York, NY, USA: ACM Press, 2003, pp. 179–186.
[7] J. Vaidya, V. Atluri, and J. Warner, “Roleminer: Mining roles using subset enumeration,” in CCS ’06: Proceed-ings of the 13th ACM Conference on Computer and Communications Security. New York, NY, USA: ACM Press, 2006.
[8] D. Zhang, K. Ramamohanarao, T. Ebringer, and T. Yann, “Permission set mining: Discovering practical and useful roles,” in ACSAC ’08: Proceedings of the 2008 Annual Computer Security Applications Conference. Washing-ton, DC, USA: IEEE Computer Society, 2008, pp. 247– 256.
[9] J. C. Bezdek and R. J. Hathaway, “VAT: A tool for visual assessment of (clustering) tendency,” in Proceedings of the International Joint Conference on Neural Networks, 2002, pp. 2225–2230.
[10] J. M. Huband, J. C. Bezdek, and R. J. Hathaway, “bigvat: Visual assessment of cluster tendency for large data sets,”
Pattern Recognition, vol. 38, no. 11, pp. 1875 – 1886, 2005.
[11] L. Wang, X. Geng, J. C. Bezdek, C. Leckie, and K. Ra-mamohanarao, “Specvat: Enhanced visual cluster anal-ysis,” in Proceedings of the Eighth IEEE International Conference on Data Mining, 2008. (ICDM ’08), Dec. 2008, pp. 638–647.
[12] R. Xu and D. W. II, “Survey of clustering algorithms,”
Neural Networks, IEEE Transactions on, vol. 16, no. 3, pp. 645–678, May 2005.
[13] D. Zhang, K. Ramamohanarao, and T. Ebringer, “Role engineering using graph optimisation,” inSACMAT ’07: Proceedings of the 12th ACM symposium on Access control models and technologies. New York, NY, USA: ACM, 2007, pp. 139–144.
[14] E. B. Fernandez and J. C. Hawkins, “Determining role rights from use cases,” inRBAC ’97: Proceedings of the second ACM workshop on Role-based access control. New York, NY, USA: ACM Press, 1997, pp. 121–125. [15] G. Neumann and M. Strembeck, “A scenario-driven role
engineering process for functional RBAC roles,” in SAC-MAT ’02: Proceedings of the seventh ACM symposium on Access control models and technologies. New York, NY, USA: ACM Press, 2002, pp. 33–42.
[16] H. Roeckle, G. Schimpf, and R. Weidinger, “Process-oriented approach for finding to implement role-based security administration in a large industrial orga-nization,” in RBAC ’00: Proceedings of the fifth ACM workshop on Role-based access control. New York, NY, USA: ACM Press, 2000, pp. 103–110.
[17] J. Vaidya, “The role mining problem: Finding a minimal descriptive set of roles,” in SACMAT ’07: Proceedings of the twelfth ACM symposium on Access control models and technologies. New York, NY, USA: ACM Press, 2007, pp. 175–184.
[18] H. Lu, J. Vaidya, and V. Atluri, “Optimal boolean matrix decomposition: Application to role engineering,” in IEEE 24th International Conference on Data Engi-neering, Cancun, Mexico, April 2008.
[19] A. Ene, W. Horne, M. Milosavljevic, P. Rao, R. Schreiber, and R. E. Tarjan, “Fast exact and heuris-tic methods for role minimization problems,” in SAC-MAT’08: Proceedings of the thirteenth ACM symposium on Access control models and technologies, Estes Park, Colorado, June 2008.
[20] J. Schlegelmilch and U. Steffens, “Role mining with ORCA,” inSACMAT ’05: Proceedings of the tenth ACM symposium on Access control models and technologies. New York, NY, USA: ACM Press, 2005, pp. 168–176.
[21] I. Molloy, H. Chen, T. Li, Q. Wang, N. Li, E. Bertino, S. Calo, and J. Lobo, “Mining roles with semantic meanings,” inSACMAT’08: Proceedings of the thirteenth ACM symposium on Access control models and technolo-gies, Estes Park, Colorado, June 2008.
[22] J. C. Bezdek, R. J. Hathaway, and J. M. Huband, “Visual assessment of clustering tendency for rectangular dissim-ilarity matrices,”Fuzzy Systems, IEEE Transactions on, vol. 15, no. 5, pp. 890–903, Oct. 2007.
[23] R. R. Sokal and P. H. A. Sneath,Principles of Numeric Taxonomy. San Francisco: W.H. Freeman, 1963. [24] A. N. S. I. Inc., “Role Based Access Control,” ANSI
INCITS 359-2004, 2004.
[25] D. Zhang, K. Ramamohanarao, and R. Zhang, “Syn-thetic data generation for study of role engineering,” http://www.cs.mu.oz.au/∼zhangd/roledata, 2008.